Back to blog
Announcements

Introducing Token Metrics Investor Grade

Learn everything about the newly-launched Token Metrics Investor Grade.
Token Metrics Team
5 minutes
Want Smarter Crypto Picks—Free?
See unbiased Token Metrics Ratings for BTC, ETH, and top alts.
Thank you! Your submission has been received!
Oops! Something went wrong while submitting the form.
 No credit card | 1-click unsubscribe

Token Metrics is proud to launch the "TM Investor Grade" to help investors identify promising long-term investments in the world of cryptocurrency. The grade is comprised of three subsets: 

  • The Fundamental Grade
  • The Technology Grade, and 
  • The Valuation Grade. 

Our statistical analysis and machine learning techniques help calculate these grades. They account for many data points to provide a strong indication of the relative strength of each crypto asset or a project.

The TM Investor Grade is intended for use by investors looking to hold onto investments for a longer period of time, created by combining the Fundamental Grade with the Technology Grade and Valuation Grade.

Fundamental Grade

Fundamental analysis has always been a crucial part of the research process at Token Metrics. Before considering any potential long-term investments, we conduct a thorough fundamental analysis to understand an asset's underlying strengths and weaknesses. Our use of fundamental analysis is how we discovered the promising investment opportunity in Helium back in 2018.

However, manually performing fundamental analysis on every token in the market is not feasible. This is why our research and data science teams automated the process. The result is our Automated Long-term Investor Grade. This grade considers a wide range of data points and applies statistical analysis to provide scores in various categories, including valuation, investors, tokenomics, community, and more. 

Technology Grade

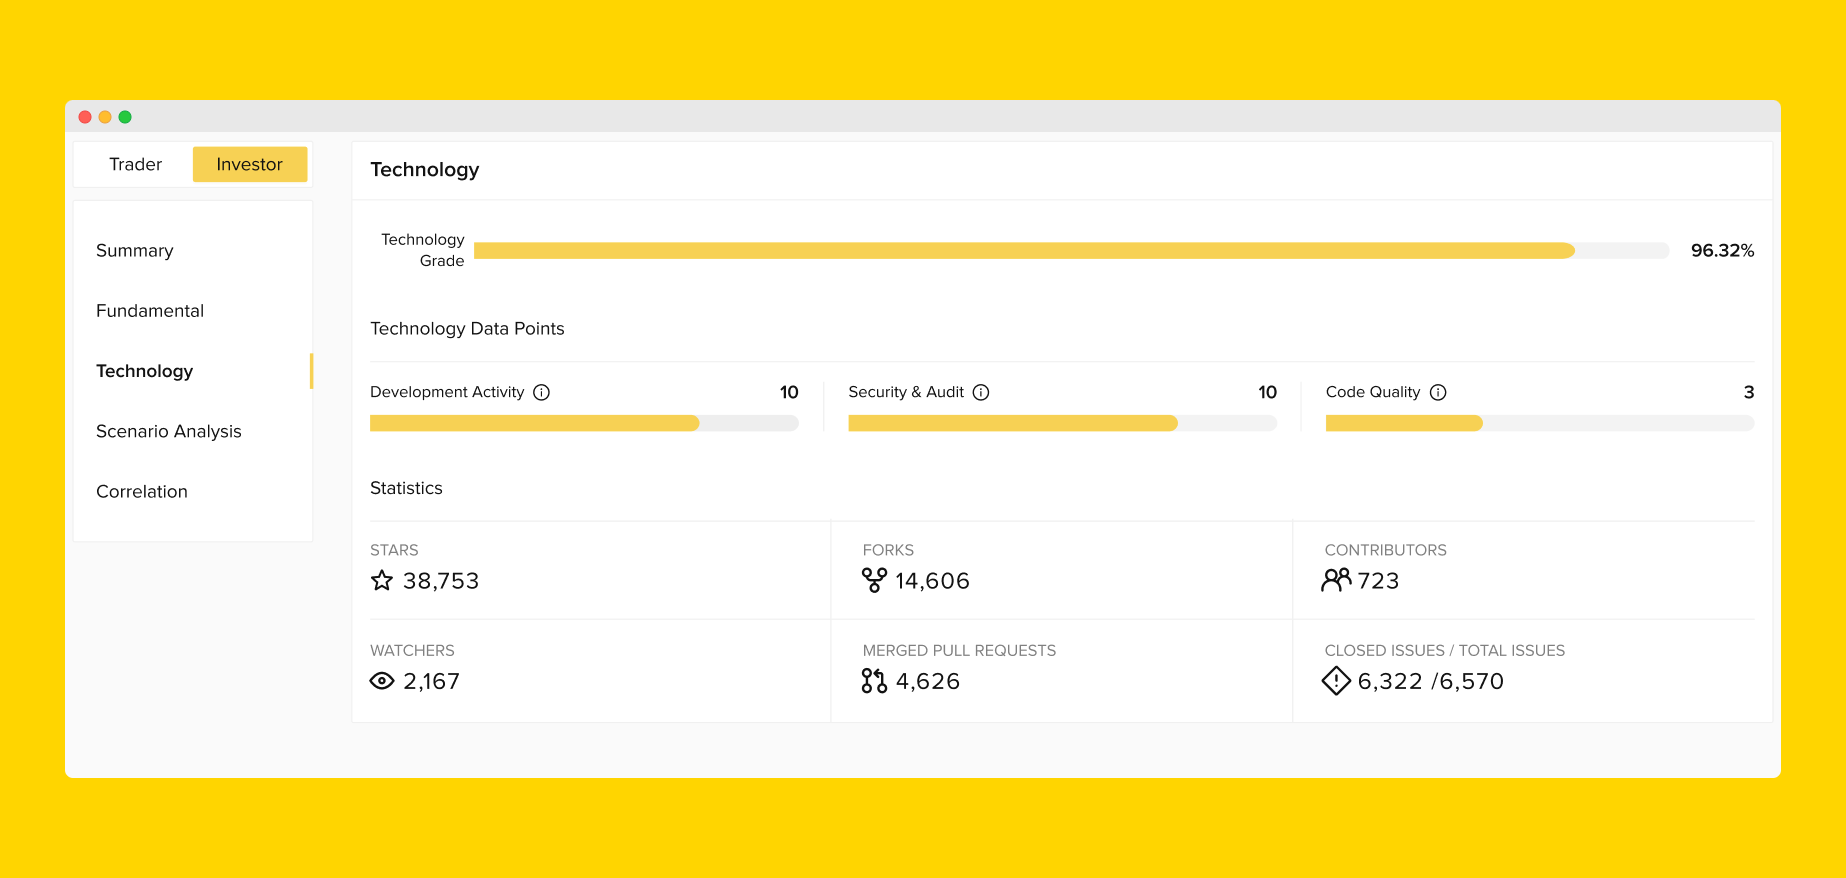
Token Metrics is also known for conducting code reviews on cryptocurrency projects. This is how we discovered that MATIC was a particularly strong project. Similar to fundamental analysis, our blockchain engineers carried out these reviews manually. However, we have now automated the entire process. Using open source data, we are able to provide technology scores for nearly all crypto assets. This is extremely valuable for investors, as it allows them to assess the long-term security and feasibility of different investments. Our technology scoring is based on three main categories: development activity, security and audit, and code quality.

The development activity category takes into account the contributions of the development community and tracks various community metrics. The security and audit category looks at the security of a project and tries to determine its resilience to hacks and other vulnerabilities. The code quality category measures how well the project's code is written, by evaluating the number of bugs and violations it has and how well it adheres to best coding practices and standards.

We are thrilled that our data science team, in collaboration with our engineering team, has been able to use statistical analysis to scale up our powerful technology scoring to cover almost all assets in the market.

Valuation Grade

The valuation grade compares a project's fully diluted value, or FDV, with the average FDV of different sectors that project belongs to.

Consider this example:

  • CRV belongs to sector A and B
  • CRV's FDV = 10
  • Average FDV in sector A = 20
  • Average FDV in sector B = 50

This will show a high valuation grade because the project is undervalued compared to its sectors.

By combining these grades, we get the TM Investor Grade which is much more powerful in determining the strength of the project in the long run.

How To Access

To view the Investor Grade, you can go to the individual token details page. Click on the 'Investor' tab on the left of the screen, and then click on the 'Fundamentals' tab. Then, you will be able to see how the asset is performing in each of the 9 categories we use . All these categories are combined to create the overall Fundamental grade. To generate this grade, we use a wide variety of data sources to gather all the necessary information.

In the same tab, you will find the 'Technology' grade. This grade comprises many different data points. These data points combine into three major categories:

  • Development Activity
  • Security and Audit, and 
  • Code Quality.

You can also access the newly-launched feature on the Rating page by pressing the Investor switch next to Trader. This will help you sort all crypto assets by our Long-term Investor Grade.

If you look at the Ratings page - sorted by Investor Grade in descending order [highest to lowest] - these are assets that Token Metrics believes have strong potential in the future.

The TM Investor Grade is a powerful tool for evaluating the long-term potential of cryptocurrency projects. By considering various data points, including fundamental analysis, technology scoring, and valuation grades, the grade provides a comprehensive assessment of a project's strengths and weaknesses.

The grade updates regularly to reflect changing market conditions, making it an essential tool for anyone looking to invest in the cryptocurrency space.

FAQs

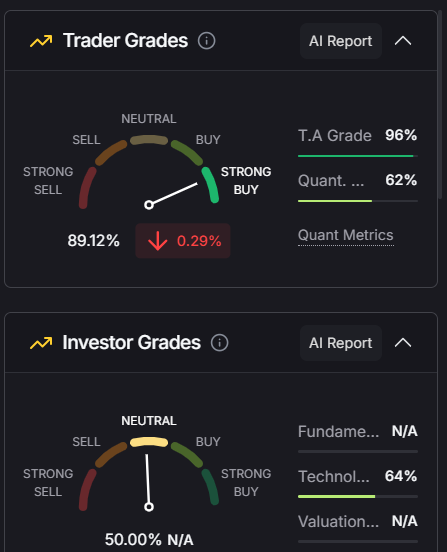
1. How does the Investor Grade differ from the Trader Grade?

The Investor Grade is intended for long-term investing, while the Trader Grade is geared toward short-term trading. The data points used to calculate the Investor Grade differ from those used for the Trader Grade.

2. Which grade should I pay more attention to - the Investor Grade or Trader Grade?

If you are interested in short-term trades based on price action, such as swing or day trades, you should consider the Trader Grade. On the other hand, the Investor Grade is more suitable for customers who want to invest long-term and hold on to their assets for the potential of significant returns or to discover undervalued assets.

Build Smarter Crypto Apps &
AI Agents in Minutes, Not Months
Real-time prices, trading signals, and on-chain insights all from one powerful API.
Grab a Free API Key
About Token Metrics
Token Metrics: AI-powered crypto research and ratings platform. We help investors make smarter decisions with unbiased Token Metrics Ratings, on-chain analytics, and editor-curated “Top 10” guides. Our platform distills thousands of data points into clear scores, trends, and alerts you can act on.
30 Employees
analysts, data scientists, and crypto engineers
Daily Briefings
concise market insights and “Top Picks”
Transparent & Compliant
Sponsored ≠ Ratings; research remains independent
Want Smarter Crypto Picks—Free?
See unbiased Token Metrics Ratings for BTC, ETH, and top alts.
Thank you! Your submission has been received!
Oops! Something went wrong while submitting the form.
 No credit card | 1-click unsubscribe
Token Metrics Team
Token Metrics Team

Recent Posts

Research

Dogecoin (DOGE) Price Prediction July 2025: Can the Meme Coin Hit $10 This Bull Cycle?

Token Metrics Team
8 min

As of July 2025, Dogecoin (DOGE) is once again in the spotlight—trading near $0.20, its highest level in over a year. Powered by Bitcoin’s rally past $112,000, renewed interest from Elon Musk, and increasing institutional attention, DOGE is gaining bullish momentum. But can the original meme coin hit $1.00 or beyond in this bull cycle?

In this highly informative and SEO-optimized blog post, we break down the catalysts, technical setup, and risk factors for Dogecoin in 2025. Most importantly, we’ll explore how Token Metrics’ AI price prediction tools can help investors navigate the volatility and time DOGE trades with precision.

🔍 Current Market Snapshot: DOGE in July 2025

  • Current Price: ~$0.19–$0.20
  • Resistance Levels: $0.20 (key), $0.30 (breakout zone)
  • Support Levels: $0.15, $0.12
  • YTD Price Growth: +140%
  • Institutional Inflows: Rising due to ETF speculation
  • Key Narrative Drivers: Elon Musk, DOGE payments, ETF approval hopes

🚀 Key Catalysts Driving DOGE’s Bullish Momentum

✅ 1. Bitcoin Rally Fuels Risk-On Appetite

Bitcoin’s price blasting through $112,000 has triggered broad bullish sentiment across altcoins—especially meme tokens like DOGE. In every prior bull market, DOGE has benefited from retail euphoria and momentum trading when Bitcoin leads the charge.

✅ 2. DOGE ETF Speculation Heats Up

With Bitcoin and Ethereum ETFs approved, attention is turning to the next wave of altcoin ETFs. Analysts believe:

  • DOGE has a realistic chance (65%+) of ETF approval in late 2025
  • Institutional appetite for meme coin exposure could surge
  • An ETF would legitimize DOGE and make it accessible in traditional portfolios

✅ 3. Elon Musk’s Continued Influence

Elon Musk remains one of Dogecoin’s biggest champions, now using DOGE as a payment option across:

  • Tesla’s online store
  • SpaceX merchandise
  • His new America Party platform for micro-donations and merch

His social media engagement continues to drive waves of DOGE buying—creating short-term surges and long-term loyalty.

✅ 4. Growing Merchant Adoption

More online platforms are integrating DOGE as a payment method. This includes:

  • Shopify stores
  • WooCommerce plugins
  • Even NFT platforms enabling DOGE payments

Merchant adoption reinforces DOGE’s use case as a fast, low-fee transactional token.

✅ 5. Whale Accumulation and Bullish Technicals

On-chain data shows:

  • Major DOGE wallets accumulating since March 2025
  • Supply on exchanges declining
  • Formation of a golden cross (50-day MA crossing above 200-day MA)

These are classic signals of a trend reversal and long-term bullish setup.

📈 DOGE Price Prediction for 2025

Based on fundamentals, on-chain metrics, and sentiment, here’s a breakdown of DOGE’s projected price scenarios:

Key Resistance to Break: $0.20, $0.30
Short-Term Support: $0.15
Critical Support: $0.12

⚠️ Risks and Challenges to Monitor

Despite its meme coin charm, Dogecoin is not without risks:

❌ 1. Unlimited Supply

Unlike Bitcoin, DOGE has no hard cap. It adds 5 billion DOGE per year, which:

  • Dilutes long-term value
  • Requires constant demand to offset inflation
  • May discourage long-term holders

❌ 2. Hype-Driven Volatility

DOGE relies heavily on social media buzz, influencer tweets, and trending memes. While this fuels rallies, it also:

  • Creates rapid, unpredictable corrections
  • Leaves the price vulnerable to sentiment shifts

❌ 3. Lack of DeFi or Smart Contract Ecosystem

Compared to Ethereum or Solana, DOGE lacks:

  • DeFi protocols
  • NFT platforms
  • Developer activity

This limits its utility beyond payments and speculation.

🧠 How Token Metrics Helps You Trade DOGE Smarter

With such a volatile asset, traders need more than gut feelings—they need data-backed predictions, AI-generated signals, and real-time alerts. That’s where Token Metrics shines.

✅ 1. AI-Powered Price Predictions

Token Metrics uses deep learning models trained on:

  • Historical DOGE price data
  • Whale wallet movements
  • Social sentiment
  • Exchange inflow/outflow

These models provide short- and long-term predictions for DOGE—helping investors spot trends before they go viral.

✅ 2. Real-Time Buy and Sell Signals

DOGE signals on Token Metrics are updated daily and triggered by:

  • RSI and MACD trends
  • Moving average crossovers
  • Momentum and volatility indicators
  • Social volume spikes

This gives traders a clear view of when to enter and exit—not based on hype, but on quantified momentum.

✅ 3. Trader and Investor Grades

Each token—including DOGE—receives:

  • A Trader Grade (short-term technicals and sentiment)
  • An Investor Grade (long-term fundamentals and sustainability)

DOGE’s Trader Grade often spikes during retail-driven rallies, helping you catch the wave early.

✅ 4. DOGE Token Details Page

DOGE’s Token Page on Token Metrics offers:

  • Live chart and performance since listing
  • Social buzz and tweet volume analysis
  • On-chain data: holder stats, transfers, top wallets
  • Historical signal accuracy

It’s the ultimate dashboard for anyone actively trading Dogecoin.

✅ 5. Custom Alerts Across Channels

Never miss a DOGE breakout again. Token Metrics lets you:

  • Set alerts for DOGE crossing $0.25, $0.50, or $1.00
  • Get notified on Telegram, Discord, or Email
  • Track grade upgrades and real-time signals

It’s like having an AI trading assistant for DOGE, 24/7.

🔮 Will DOGE Hit $1 in 2025?

The answer depends on:

  • Bitcoin’s trajectory: If BTC hits $150K, DOGE will likely follow
  • ETF approval: Adds legitimacy and capital inflows
  • Retail hype: Viral moments can push DOGE far beyond its fair value

With a bullish setup in place and key macro trends aligned, DOGE hitting $0.55 to $1.25 by Q4 2025 is within reach.

But volatility will remain high—so timing, data, and discipline are critical.

✅ Final Thoughts: Use Token Metrics to Ride the DOGE Wave Safely

Whether you’re a meme coin enthusiast or a data-driven trader, DOGE in 2025 presents real profit potential—especially with the right tools.

With Token Metrics, you can:

  • Get real-time price predictions
  • Time entries with AI signals
  • Monitor whale activity and hype spikes
  • Stay ahead of the crowd with alerts

👉 Start your free trial at tokenmetrics.com
🚀 Explore the DOGE token page, check signal history, and set your moonshot alerts.

Research

Cardano (ADA) Price Prediction July 2025: Can ADA Break $100 This Bull Cycle?

Token Metrics Team
8 min

Click here to buy Cryptocurrencies from Gate.io

As of July 12, 2025, Cardano (ADA) is showing renewed strength, climbing toward the critical $0.75 resistance level as Bitcoin soars above $112,000. After months of consolidation, the smart contract platform is gaining attention from investors, driven by key upgrades, growing DeFi activity, and a broader crypto bull market.

But can ADA reclaim the $1.00 milestone—or even surge beyond $1.50—by the end of the year?

In this highly informative and SEO-optimized article, we’ll explore Cardano’s 2025 price outlook, fundamental drivers, potential risks, and how Token Metrics’ AI tools can help you make smarter, data-backed investment decisions.

🔍 Quick Snapshot: Cardano in July 2025

  • Current Price: ~$0.74
  • Resistance: $0.75 (major), $0.80 (breakout trigger)
  • Support: $0.62 (short-term), $0.50 (long-term)
  • Year-to-Date Institutional Inflows: $73M
  • Daily Active Addresses: ~30,000
  • TVL Growth Since April: +21%
  • ETF Approval Probability: 75%

🚀 Key Catalysts for Cardano’s Bullish Momentum

✅ 1. The Plomin Hard Fork: Governance Upgrade

The Plomin Hard Fork, implemented in Q1 2025, marked a turning point in Cardano’s evolution. It introduced:

  • Decentralized on-chain governance
  • Community-driven protocol updates
  • Greater autonomy for ADA holders

This governance upgrade enhanced Cardano’s appeal to long-term investors and DeFi developers by aligning protocol evolution with community consensus.

✅ 2. Rising DeFi Activity on Cardano

Cardano’s DeFi ecosystem is gaining traction, with Total Value Locked (TVL) increasing by 21% since April. Leading protocols like Minswap, Indigo, and LiQwid have seen significant upticks in user activity and liquidity.

This growth signals:

  • Greater developer interest
  • Improved user adoption
  • Strengthening demand for ADA as collateral and transaction gas

✅ 3. Potential Integration of $RLUSD Stablecoin

Cardano could soon integrate Ripple’s newly launched $RLUSD stablecoin, offering:

  • Seamless liquidity for ADA-based DeFi protocols
  • Cross-chain interoperability with Ripple and Ethereum ecosystems
  • Stability for yield-generating DeFi strategies

Stablecoin adoption is a key growth driver for any Layer-1 network aiming to scale its DeFi infrastructure.

✅ 4. Institutional Capital Inflows

Cardano has attracted $73 million in institutional inflows in 2025 so far, according to data from leading asset managers. This shows:

  • Rising confidence in ADA’s long-term value
  • Anticipation of ETF approval in the U.S. or Europe
  • ADA’s inclusion in emerging crypto index products

With a 75% probability of ETF approval, institutional demand could surge further in Q4.

📈 Cardano Price Prediction for 2025

Analysts and machine learning models—including those from Token Metrics—project a bullish range for ADA in 2025, depending on technical and macroeconomic conditions.

Breakout Level to Watch: $0.80
Support to Hold: $0.62

Click here to buy Cryptocurrencies from Gate.io

⚠️ Potential Risks to ADA’s Growth

Despite bullish fundamentals, Cardano still faces several challenges that could cap or delay price gains:

❌ 1. Low Daily Active Users

With only 30,000 daily active addresses, Cardano still lags behind competitors like:

  • Solana (~500,000 DAU)
  • Ethereum (~400,000 DAU)

Low user activity may:

  • Limit dApp growth
  • Weaken DeFi liquidity
  • Lower investor excitement

❌ 2. Strong Competition

Cardano must compete with:

  • Ethereum’s mature DeFi and NFT ecosystems
  • Solana’s blazing-fast, low-cost transactions
  • New entrants like Aptos and Sui

ADA needs to differentiate itself with real-world adoption and enterprise use cases.

❌ 3. Profit-Taking and Macro Uncertainty

Even in a bull market, sharp corrections happen. ADA could:

  • Face sell-offs at key resistance ($0.80, $1.00)
  • React negatively to macro risks like inflation or Fed policy
  • Be impacted by whale liquidation events

🧠 How Token Metrics Helps You Predict ADA’s Next Move

In crypto’s high-volatility environment, AI-driven research tools are essential. Token Metrics empowers ADA investors with real-time signals, grades, and analytics to stay ahead of the market.

✅ 1. AI-Powered Price Predictions

Token Metrics' machine learning models forecast ADA’s short- and long-term price movements based on:

  • Historical trading patterns
  • On-chain data (TVL, active addresses)
  • Market sentiment
  • Exchange flow analysis

These forecasts update in real time as market conditions evolve.

✅ 2. Trader & Investor Grades for ADA

  • Trader Grade: Indicates short-term momentum and technical strength. Ideal for swing traders.
  • Investor Grade: Evaluates ADA’s long-term fundamentals and ecosystem health.

Grades are updated daily, providing clarity even during volatile market swings.

✅ 3. Buy/Sell Signals

Token Metrics issues real-time bullish and bearish signals on ADA, helping users:

  • Avoid emotional trades
  • Enter during early momentum
  • Exit before trend reversals

Each signal is backed by over 80 on-chain and technical data points.

✅ 4. Token Details Page

ADA’s dedicated page includes:

  • Live price chart
  • ROI since listing
  • Exchange and wallet data
  • Historical grading performance
  • AI-based outlooks and narratives

It’s a comprehensive research hub for Cardano investors.

✅ 5. Custom Alerts

Set up personalized alerts for ADA based on:

  • Price targets (e.g., alert me at $1.00)
  • Percentage changes (e.g., +10% move)
  • Grade improvements or downgrades

Receive alerts via email, Discord, Telegram, or Slack, keeping you informed 24/7.

📉 Bearish Scenario: What If ADA Fails to Break Out?

If ADA cannot break above $0.80, it may retrace toward:

  • $0.62 (short-term support)
  • $0.50 (key historical demand zone)

In that case, investors should:

  • Monitor Token Metrics’ bearish signals
  • Look for re-entry setups at lower prices
  • Track DeFi TVL and whale accumulation

✅ Final Thoughts: Is ADA a Strong Buy in 2025?

Cardano is making meaningful strides:

  • Governance decentralization (Plomin Hard Fork)
  • Growing DeFi ecosystem
  • Strong institutional interest
  • Potential ETF approval

If these trends continue and Bitcoin remains in a bull cycle, ADA could reach $1.10–$1.65 by year-end.

However, investors should stay cautious of competition, user activity metrics, and potential volatility.

With Token Metrics, you can:

  • Predict price movements with AI
  • Track technical and fundamental grades
  • Get alerts before the crowd reacts

🔗 Start Using Token Metrics to Trade ADA Smarter

Ready to take advantage of Cardano’s potential?

👉 Visit tokenmetrics.com
🚀 Access AI price predictions, moonshot opportunities, and real-time signals
📲 Set custom alerts so you never miss a breakout

Click here to buy Cryptocurrencies from Gate.io

Research

Ripple (XRP) Price Prediction 2025: Will XRP Hit $500 This Bull Cycle?

Token Metrics Team
8 min

BUY XRP FROM MEXC!

Ripple’s native token, XRP, is experiencing renewed momentum in 2025, surging to $2.58 and breaking the long-standing $2.50 resistance level. This price movement coincides with Bitcoin's rally past $112,000, signaling that XRP is riding the current bull market wave.

But what’s driving this surge in XRP? Is it sustainable? And could we see XRP hit $5, $7—or even $10—before the end of 2025?

In this highly informative and SEO-optimized blog post, we analyze the factors behind XRP’s rise, evaluate its future potential, and explain why Token Metrics’ AI-powered price prediction tools offer unmatched insights for crypto investors.

🚀 XRP’s Bullish Breakout: A New Chapter in 2025

In July 2025, XRP’s breakout above $2.50 marks one of its strongest price performances since the 2017 bull run. Key drivers behind this bullish trend include:

✅ 1. Ripple’s Legal Victory Against the SEC

Ripple finalized its years-long lawsuit with the U.S. Securities and Exchange Commission (SEC) by paying a $50 million settlement—without admitting XRP is a security. This outcome:

  • Removes a major legal overhang
  • Boosts investor and institutional confidence
  • Clears the path for U.S. regulatory clarity

With the lawsuit resolved, XRP is now eligible for listings, ETF consideration, and greater adoption in regulated financial environments.

✅ 2. Launch of RLUSD Stablecoin

Ripple has successfully launched RLUSD, its native stablecoin backed 1:1 by U.S. dollars. RLUSD provides:

  • Liquidity for XRP-based DeFi
  • Seamless on/off ramps for cross-border payments
  • Utility for RippleNet’s institutional clients

This ecosystem expansion strengthens Ripple’s value proposition and increases XRP utility and demand.

✅ 3. Potential Approval of XRP ETFs

With Ethereum and Bitcoin ETFs already active, XRP is next in line. Analysts estimate:

  • A 90%+ likelihood of XRP ETF approval before 2026
  • Significant inflows from institutional investors upon approval

ETF listings would make XRP easily accessible in retirement accounts, financial advisors’ portfolios, and wealth management platforms—further legitimizing the asset.

✅ 4. Expanding Global Financial Partnerships

Ripple now boasts partnerships with 300+ financial institutions, including:

  • Santander
  • Standard Chartered
  • SBI Holdings
  • Integration with Wormhole for cross-chain liquidity

This positions XRP as a global standard for cross-border payments—a market worth $150+ trillion annually.

📈 XRP Price Prediction for 2025

Analysts and AI models predict a strong upside potential for XRP during this bull cycle. Here's a breakdown of possible scenarios:

Breakout Level to Watch: $3.40
Support Level: $2.10

⚠️ Risks and Challenges Ahead

Despite the bullish momentum, XRP still faces several risks:

❌ 1. Regulatory Ambiguity Outside the U.S.

Although the SEC case is resolved, Ripple faces:

  • Different classifications of XRP in Europe and Asia
  • New compliance standards (e.g., MiCA)
  • Potential resistance from central banks promoting CBDCs

❌ 2. Stablecoin Competition

RLUSD must compete with:

  • USDT and USDC (dominant players)
  • CBDCs and national digital currencies
  • Traditional payment rails like SWIFT GPI

Failure to achieve rapid RLUSD adoption could cap XRP's growth potential.

❌ 3. Market Volatility and Profit-Taking

After explosive gains, whales may lock in profits, causing sharp pullbacks. Key support at $2.10 must hold to maintain bullish structure.

🧠 Why Token Metrics Has the Best XRP Price Prediction Tools

In a fast-moving market, investors need real-time, data-driven predictions—not guesswork. Token Metrics offers the most advanced tools for XRP investors.

✅ 1. AI-Powered Price Forecasts

Token Metrics uses machine learning models trained on years of crypto market data to generate high-accuracy price forecasts.

For XRP, these models consider:

  • Whale wallet accumulation
  • Cross-border transaction volume
  • Stablecoin liquidity metrics
  • Token velocity and exchange flows

The result? A forward-looking price forecast you can trust.

✅ 2. XRP Buy/Sell Signals

The Token Metrics platform issues real-time bullish or bearish signals based on:

  • Technical indicators (MACD, RSI)
  • Exchange net flow
  • Trend strength
  • Historical reversal patterns

These signals help you:

  • Enter at optimal times
  • Avoid fake breakouts
  • Time your profit-taking during rallies

✅ 3. Trader and Investor Grades

Token Metrics assigns every token—including XRP—a:

  • Trader Grade (short-term trend strength)
  • Investor Grade (long-term fundamental health)

Both are AI-calculated using 80+ metrics, and they update daily. This helps you:

  • Decide whether to swing trade or HODL XRP
  • Compare XRP with other cross-border payment tokens

✅ 4. Custom Alerts and Analysis

With Token Metrics, you can set personalized alerts for XRP:

  • Price thresholds (e.g., alert me if XRP hits $3.40)
  • Percent change triggers (e.g., alert me on +15% move)
  • Grade changes (e.g., notify me if Trader Grade goes above 80)

Alerts are delivered via email, Slack, Telegram, or Discord—so you never miss a key movement.

✅ 5. Detailed Token Page for XRP

The XRP profile page on Token Metrics provides:

  • Live price chart and ROI
  • Real-time exchange volume
  • Whale wallet movements
  • Historical signal success rates

Everything you need for informed XRP investing in one place.

📊 XRP vs. Other Altcoins in 2025

While many altcoins are chasing narratives (AI, memecoins, DePIN), XRP’s case is fundamentally driven by:

  • Regulatory clarity
  • Real-world adoption
  • Enterprise integrations

Token Metrics’ crypto indices help investors diversify by creating thematic portfolios (e.g., “Institutional Adoption,” “Layer-1 Networks,” “Cross-Border Payments”)—with XRP often at the top of the cross-border category.

📉 What If XRP Corrects?

Corrections are part of every bull market. If XRP fails to hold above $2.50:

  • A retracement to $2.10 is likely
  • A break below $2.10 could lead to a retest of $1.80
  • Traders should watch BTC’s movement closely—if Bitcoin reverses sharply, XRP could follow

Use Token Metrics’ bearish signal alerts to de-risk in real time.

✅ Final Thoughts: XRP Is One to Watch in 2025

With legal clarity, a new stablecoin, ETF approval potential, and over 300 institutional partnerships, Ripple and XRP are in their strongest position in years.

If Bitcoin continues its uptrend and XRP breaks above $3.40, the next major rally could take it to $5–$10 by the end of 2025.

But success depends on regulatory support, stablecoin adoption, and institutional inflows—all factors Token Metrics tracks daily with precision.

🔍 Take Action: Use Token Metrics to Trade XRP Smarter

  • Track XRP’s real-time price predictions
  • Monitor short- and long-term signal strength
  • Set alerts for breakouts or corrections
  • Analyze fundamentals and on-chain data

👉 Start now at tokenmetrics.com and gain an edge in XRP trading and investing

Choose from Platinum, Gold, and Silver packages
Reach with 25–30% open rates and 0.5–1% CTR
Craft your own custom ad—from banners to tailored copy
Perfect for Crypto Exchanges, SaaS Tools, DeFi, and AI Products