Announcements

Token Metrics TradingView Indicator - Trade Cryptocurrencies with Confidence

Learn more about the Token Metrics TradingView Indicator, a powerful tool to provide Long/Short signals for crypto assets.
Token Metrics Team
7 minutes
MIN

Trading indicators are a crucial aspect of the investing world, and in the volatile world of cryptocurrency, it becomes all the more important to have them on your side. 

TradingView, the leading social trading platform, provides traders with the tools they need to make informed decisions and take their trading game to the next level.

Among the tools offered by TradingView is the Token Metrics Indicator, a powerful tool that combines multiple technical analysis indicators to provide Long/Short signals for crypto assets.

In this blog, we will dive into the Token Metrics TradingView Indicator and how it can help you to improve your trading strategy. 

Whether you are a seasoned trader or just starting out, the Token Metrics TradingView Indicator can help you make informed investment decisions and potentially avoid costly mistakes.

That said, let’s get started.

What is Token Metrics TradingView Indicator? 

The Token Metrics TradingView Indicator is a powerful tool for crypto assets on TradingView, combining multiple strategies to give you clear Long and Short signals for your trades. 

It gives you a clear picture of the market with four key components: Clouds, Trend Line, Signals, and Channels. The Clouds show the current trend (green for bullish and red for bearish), the Trend Line provides a long-term market outlook with resistance and support levels, the Signals provide buy/sell signals and the Channels help to determine the previous swing high and low to get an idea of where resistance/support might be forming and where breakouts can occur.

The backtesting feature allows users to assess the strategy's historical performance and understand its potential, risk profile, and suitability for different market conditions. 

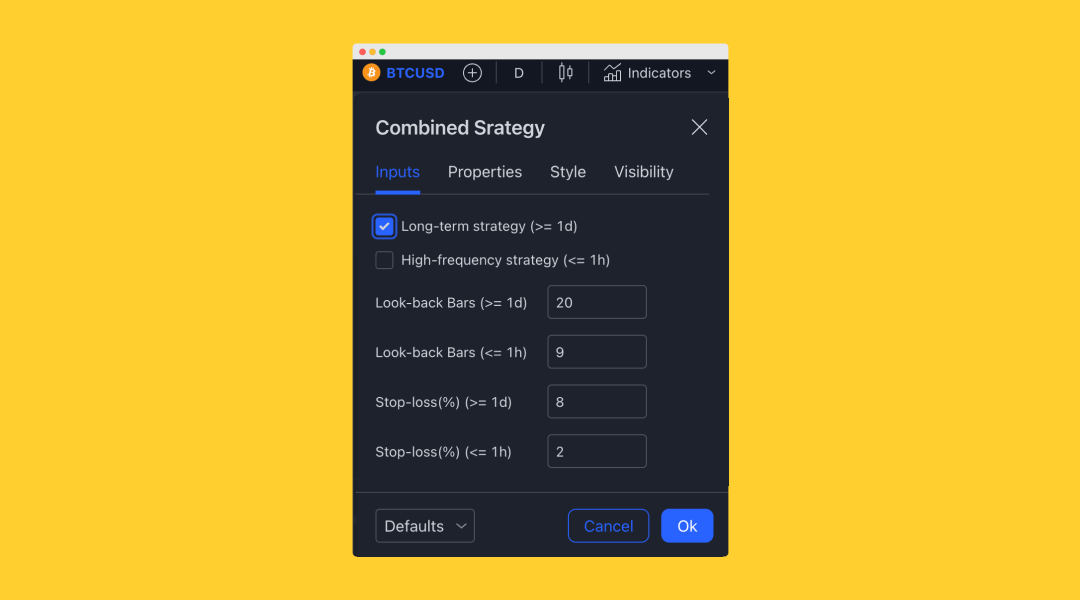
The Token Metrics TradingView Indicator offers customization options to match individual trading preferences through its inputs.

Users can adjust these values based on risk tolerance and market conditions, allowing optimal performance and profitability. Whether you prefer a fast-reacting or slow-adapting strategy, the Token Metrics TradingView Indicator has you covered.

Supports All Types of Traders

The Token Metrics Trading View Indicator offers traders two distinct approaches to cryptocurrency trading: long-term and high-frequency trading. Each style has its considerations and best practices to maximize profitability.

For long-term traders, the Token Metrics TradingView Indicator provides a trend-following strategy best suited for Daily and Weekly timeframes. This approach excels in trending markets but may produce false signals in choppy or range-bound markets. It is important for long-term traders to keep in mind that the goal is to gain exposure to strong trends without excessive trading.

On the other hand, high-frequency traders can take advantage of the mean-reverting capabilities of the Token Metrics TradingView Indicator. This approach is best suited for 15min, 30min, and 1hr timeframes and works best in choppy and range-bound markets. Mean-reversion is stronger on low time frame charts, making this strategy ideal for traders looking to buy at the bottom of the channel and sell at the top. It is important for high-frequency traders to remember that this strategy is not intended for exposure to prevailing trends.

Whether you prefer long-term or high-frequency trading, the Token Metrics TradingView Indicator provides the tools and customization options to match your individual style. By understanding the strengths and limitations of each approach, you can make the most out of your trading strategy with the Token Metrics TradingView Indicator.

How to Get the Token Metrics TradingView Indicator

The Token Metrics TradingView Indicator is included in all Token Metrics Plans. 

You can also get this indicator as a standalone product by visiting this page to learn more.

Conclusion

In conclusion, the Token Metrics TradingView Indicator is a versatile tool that can be customized to fit the needs of both long-term and high-frequency traders.

Whether you're looking to gain exposure to strong trends or to take advantage of mean-reversion in choppy markets, the Token Metrics TradingView Indicator provides the features and flexibility you need to achieve your trading goals.

With its comprehensive backtesting capabilities, you can get a deep understanding of the performance of your strategy, allowing you to make informed decisions and achieve consistent profits in the cryptocurrency market.

Build Smarter Crypto Apps &
AI Agents in Minutes, Not Months
Real-time prices, trading signals, and on-chain insights all from one powerful API.
Grab a Free API Key
Token Metrics Team
Token Metrics Team

Recent Posts

Research

Understanding Web3: How It Differs From Today's Internet

Token Metrics Team
4
MIN

Introduction

The internet has become an integral part of modern life, continually evolving since its inception. In recent years, a new paradigm called Web3 has emerged, promising to reshape how users interact with digital platforms. This blog post explores the fundamental differences between Web3 and the current internet, often referred to as Web2, to clarify what Web3 entails and its potential impact.

What Is Web3?

Web3 represents the next phase of the internet, built on the principle of decentralization. Unlike the current centralized internet infrastructure, Web3 aims to distribute control away from traditional intermediaries like corporations and governments to users and communities. Key technologies underpinning Web3 include blockchain, decentralized finance (DeFi), non-fungible tokens (NFTs), and decentralized autonomous organizations (DAOs).

At its core, Web3 is designed to empower users to own and control their data, digital assets, and online identities through cryptographic proof rather than relying on centralized entities. This shift holds the promise of enhanced privacy, improved security, and greater transparency across digital services.

How Web3 Differs From the Current Internet

The current internet, or Web2, is characterized by centralized platforms such as social media networks, content-sharing sites, and cloud service providers. These platforms control user data and have significant influence over digital ecosystems. Web3 introduces several pivotal differences:

  • Decentralization: Traditional web services store data on central servers. Web3 applications (dApps) operate on decentralized networks like Ethereum, distributing data across many nodes.
  • Data Ownership and Privacy: In Web3, users have sovereignty over their personal data via cryptographic keys, reducing dependency on intermediaries.
  • Trustless Interactions: Web3 uses smart contracts to automate transactions without requiring trust in a third party, enhancing transparency.
  • Monetization and Incentives: Users can directly monetize their contributions or assets through tokens without relying on platform-controlled advertising models.

Key Technologies Enabling Web3

A few seminal technologies make the Web3 vision feasible:

  1. Blockchain: A distributed ledger technology providing an immutable record of transactions and data accessible to all network participants.
  2. Cryptographic wallets: Tools that allow users to manage private keys securely, facilitating ownership and transaction signing.
  3. Smart contracts: Self-executing contracts with the terms directly written into code, automating agreements and processes without intermediaries.
  4. Decentralized storage: Networks like IPFS provide distributed data hosting, improving resilience and censorship resistance.

These technologies collectively foster environments where decentralized applications can function effectively, distinguishing Web3 from legacy web systems.

Impact of AI Research Tools in Understanding Web3

Analyzing the Web3 space requires comprehensive research and understanding of complex, rapidly evolving technologies. AI-driven research platforms like Token Metrics use machine learning and data analytics to provide insights into blockchain networks, emerging protocols, and token metrics. By leveraging these tools, researchers and enthusiasts can assess technological fundamentals and ecosystem trends in a structured, data-informed manner, facilitating a clearer understanding of Web3 developments.

Practical Considerations for Exploring Web3

For those interested in exploring Web3, keeping the following factors in mind can enhance comprehension and engagement:

  • Focus on fundamentals: Evaluate protocols and projects based on technology, use case, and community involvement.
  • Understand risk: Web3 technologies are experimental and subject to regulatory and technical challenges.
  • Use credible research tools: Platforms like Token Metrics offer analytical data that aid in objective evaluation.
  • Stay informed: The Web3 landscape evolves rapidly, requiring continuous learning and monitoring.

Future Outlook: Web3 vs. Web2

While Web3 promises a more decentralized and user-empowered internet, it is essential to consider practical implications. Adoption hurdles, scalability, user experience, and regulatory frameworks will shape its trajectory. Unlike Web2, which offers convenience and centralized control, Web3 emphasizes autonomy and distributed governance. The future internet may well integrate strengths from both models, providing a hybrid approach that balances user control with usability.

Conclusion

Web3 represents a transformative vision for the internet, aiming to decentralize control and enhance user ownership of data and digital assets. Its key distinctions from the current internet (Web2) include decentralization, trustless interactions, and new economic models. Technologies like blockchain and smart contracts drive these changes, supported by analytical tools such as Token Metrics that aid in navigating this complex environment. As Web3 continues to evolve, understanding its fundamentals remains crucial for anyone interested in the future of the internet.

Disclaimer

This blog post is intended for educational and informational purposes only and does not constitute financial or investment advice. Readers should conduct their own research and consider their risk tolerance before engaging with Web3 technologies or cryptocurrencies.

Research

Understanding Why Blockchain Transactions Are Irreversible

Token Metrics Team
5
MIN

Introduction

The concept of irreversible transactions is a foundational aspect of blockchain technology and cryptocurrencies. Unlike traditional banking systems where transactions can be reversed or disputed, blockchain transactions are designed to be permanent and unalterable once confirmed. This unique feature raises an important question: why are blockchain transactions irreversible? This article delves into the fundamental principles, technological mechanisms, and security frameworks that underpin transaction irreversibility in blockchains. In addition, it highlights how analytical and AI-driven research platforms such as Token Metrics can help users better understand the underlying dynamics.

Basics of Blockchain Transactions

To answer why blockchain transactions are irreversible, it is essential to understand what constitutes a blockchain transaction. At its core, a blockchain is a decentralized and distributed digital ledger of transactions, grouped into blocks and linked through cryptographic hashes.

  • Transaction creation: Users initiate transactions by digitally signing them with private keys, ensuring authenticity and ownership.
  • Broadcast and validation: Transactions are broadcast to a network of nodes, where consensus algorithms validate and verify them based on predefined rules.
  • Inclusion in blocks: Validated transactions are bundled into a block.
  • Linking blocks into a chain: Each block references the previous block through a cryptographic hash, forming a chronological chain.

Once a transaction is included in a confirmed block, it becomes part of the immutable ledger, considered permanent and irreversible.

Role of Immutability and Cryptography

Immutability is the cornerstone of transaction irreversibility. Blockchain achieves immutability using cryptographic techniques and decentralized consensus.

  • Cryptographic hashes: Each block contains a hash of the previous block, creating a tamper-evident chain. Changing any transaction data in a previous block alters its hash and breaks the chain's continuity.
  • Digital signatures: Transactions are signed by senders using private keys, and their validity is verified through public keys.
  • Decentralization: Since multiple nodes maintain copies of the ledger, altering one copy would require overwhelming control over the network to rewrite history, which is prohibitively difficult.

This design ensures that once a transaction is confirmed and embedded in a block, it is computationally infeasible to modify or reverse it without consensus from the majority of the network.

Consensus Mechanisms and Finality

Consensus algorithms play an essential role in determining when transactions are considered final and irreversible.

  • Proof of Work (PoW): In PoW systems like Bitcoin, miners solve complex puzzles to add new blocks. The longer the subsequent chain grows past a block, the more secure and irreversible the transactions within it become, as rewriting would require significant energy expenditure.
  • Proof of Stake (PoS) and others: Other consensus models like PoS, delegated PoS, or Byzantine Fault Tolerant algorithms offer different methods of achieving agreement but similarly provide guarantees on transaction finality.

Network participants generally treat transactions as irreversible after a certain number of confirmations (additional blocks). This requirement reduces risks from temporary forks or reorganizations.

Technical Challenges to Reversing Transactions

Reversing a blockchain transaction would entail rewriting the blockchain history, which is impeded by several technical realities:

  1. Hash chain dependency: Because every block contains the hash of its predecessor, any change would cascade through the chain, invalidating all subsequent blocks.
  2. Network consensus: The majority of nodes must agree on a change, which is practically impossible in secure, well-distributed networks without control of a 51% attack.
  3. Resource expenditure: The computational power and time required to modify past transactions increase exponentially with block depth.

Therefore, even accidental or malicious attempts to reverse a transaction face insurmountable obstacles.

Practical Implications of Irreversibility

The irreversible nature of blockchain transactions carries both benefits and risks.

  • Benefits: Enhanced security against fraud and censorship, fostering trust in decentralized financial systems.
  • Risks: Users need to exercise caution, as mistakes such as sending to incorrect addresses or falling victim to scams cannot be undone.

Understanding these implications is critical for users engaging with blockchain-based systems, and tools like Token Metrics provide data-driven insights to enhance awareness and decision-making.

How AI and Analytics Support Understanding

With the growing complexity of blockchain ecosystems, AI-driven platforms are increasingly valuable for dissecting transaction behaviors and network health.

  • Transaction analysis: AI can identify patterns, potential risks, or anomalies in blockchain activity.
  • Market insights: Analytical tools can augment research on transaction volumes, confirmation times, and network congestion.
  • Educational resources: Platforms such as Token Metrics leverage AI to provide accessible metrics and ratings that inform users about blockchain projects and technologies.

Utilizing these resources supports a better grasp of the irreversible nature of transactions and the broader blockchain infrastructure.

Conclusion

Blockchain transaction irreversibility is rooted in the technology’s core principles of immutability, decentralization, and consensus-driven finality. These mechanisms collectively ensure that once a transaction is recorded on the blockchain and sufficiently confirmed, it cannot be altered or undone without prohibitive computational effort and majority network control. While irreversible transactions provide robust security and trustlessness, they also emphasize the importance of user diligence. Leveraging AI-powered analytical tools like Token Metrics can enhance comprehension and navigational confidence within blockchain ecosystems.

Disclaimer

This article is intended for educational purposes only and does not constitute financial advice. Readers should conduct their own research using varied sources, including specialized platforms such as Token Metrics, before engaging with blockchain or cryptocurrency activities.

Crypto Basics

What Indicators Should I Use for Technical Crypto Analysis?

Token Metrics Team
8 min
MIN

If you’re serious about trading cryptocurrency, technical analysis (TA) is an essential skill. It helps you understand price movements, predict trends, and identify high-probability entry and exit points.

But with hundreds of technical indicators available, one common question is: “Which indicators should I use for technical analysis?”

In this guide, we’ll break down the most effective indicators for crypto trading, explain how they work, and show you how Token Metrics combines them with AI-driven insights to help you trade smarter.

Why Use Technical Indicators in Crypto?

Unlike traditional stocks, cryptocurrency markets trade 24/7, are more volatile, and are largely driven by sentiment and speculation.

Technical indicators help you:

  • Identify trends (bullish or bearish).

  • Pinpoint support and resistance levels.

  • Detect overbought or oversold conditions.

  • Find entry and exit points with better timing.

The key is not using one indicator in isolation but combining multiple tools for confirmation—which is exactly what Token Metrics does with its AI-driven trading signals.

The Most Important Indicators for Technical Analysis

Here are the must-know indicators for crypto traders:

1. Moving Averages (MA & EMA)

What they do:
Moving averages smooth out price data to help you identify overall market direction.

  • Simple Moving Average (SMA): Calculates the average closing price over a set period (e.g., 50-day, 200-day).

  • Exponential Moving Average (EMA): Gives more weight to recent prices, making it more responsive.

How to use them:

  • Golden Cross: When the 50-day MA crosses above the 200-day MA → bullish signal.

  • Death Cross: When the 50-day MA crosses below the 200-day MA → bearish signal.

Best for:
Spotting long-term trends and momentum.

2. Relative Strength Index (RSI)

What it does:
RSI measures price momentum and identifies overbought (70+) or oversold (30-) conditions.

How to use it:

  • Above 70: Asset may be overbought → possible pullback.

  • Below 30: Asset may be oversold → potential bounce.

Best for:
Finding reversal points and confirming trend strength.

3. Moving Average Convergence Divergence (MACD)

What it does:
MACD measures the relationship between two EMAs (usually 12-day and 26-day) and generates buy/sell signals based on crossovers.

How to use it:

  • Bullish crossover: MACD line crosses above the signal line.

  • Bearish crossover: MACD line crosses below the signal line.

Best for:
Spotting trend changes early.

4. Bollinger Bands

What they do:
Bollinger Bands create a price channel around an asset using a moving average plus/minus two standard deviations.

How to use them:

  • Price near upper band: Potential overbought condition.

  • Price near lower band: Potential oversold condition.

  • Band squeeze: Indicates upcoming volatility.

Best for:
Predicting volatility and identifying breakout opportunities.

5. Volume Indicators (OBV & VWAP)

What they do:
Volume indicators confirm price movements and help spot trend strength.

  • On-Balance Volume (OBV): Tracks buying/selling pressure.

  • VWAP (Volume-Weighted Average Price): Shows average price relative to volume.

Best for:
Confirming whether a trend is supported by strong trading volume.

6. Fibonacci Retracement

What it does:
Identifies key support and resistance levels based on Fibonacci ratios (23.6%, 38.2%, 50%, 61.8%, etc.).

How to use it:

  • Place retracement levels between swing highs and lows to find potential pullback or breakout zones.

Best for:
Setting targets and identifying price zones for entries/exits.

7. Stochastic Oscillator

What it does:
Measures price momentum by comparing closing prices to recent price ranges.

How to use it:

  • Above 80: Overbought.

  • Below 20: Oversold.

  • Use crossovers for potential buy/sell signals.

Best for:
Short-term traders looking for momentum shifts.

8. Ichimoku Cloud

What it does:
Provides a complete view of trend, momentum, and support/resistance levels in one indicator.

How to use it:

  • Price above cloud: Bullish.

  • Price below cloud: Bearish.

  • Cloud crossovers: Signal trend reversals.

Best for:
Swing traders who need multi-factor confirmation in one tool.

How Token Metrics Combines Indicators with AI

Instead of manually tracking dozens of indicators, Token Metrics uses AI to analyze 80+ technical, fundamental, and sentiment-based data points for each asset—giving you actionable insights without the guesswork.

Here’s how:

1. AI-Powered Bullish & Bearish Signals

Our system combines RSI, MACD, MAs, and more to generate real-time buy/sell signals.

2. Trader & Investor Grades

  • Trader Grade: Helps short-term traders focus on cryptos with strong technical setups.

  • Investor Grade: Identifies long-term investment opportunities with strong fundamentals.

3. Narrative Detection

Token Metrics tracks emerging narratives (AI tokens, DeFi, etc.) so you can spot trends before they explode.

4. AI-Managed Indices

Don’t want to analyze charts? Our AI-driven indices automatically rebalance portfolios using technical indicators and market conditions.

How to Combine Indicators Effectively

The most successful traders don’t rely on one indicator. Instead, they combine them for confirmation.

Example:

  • Use RSI to spot oversold conditions.

  • Confirm with MACD bullish crossover.

  • Check volume to ensure strong buying pressure.

When multiple indicators align, your trade has a higher probability of success—and Token Metrics does this automatically.

Advanced Tips for Using Indicators

  1. Don’t Overload: Use 3–5 indicators for clarity.

  2. Adjust for Volatility: Crypto is more volatile than stocks—shorten timeframes for faster signals.

  3. Combine With Fundamentals: Use Token Metrics Investor Grades to pair TA with project fundamentals.

  4. Practice Risk Management: Even the best indicators fail—always use stop-loss orders.

Final Thoughts

So, what indicators should you use for technical analysis?

Start with moving averages, RSI, MACD, Bollinger Bands, and Fibonacci levels—then add volume indicators and advanced tools like the Ichimoku Cloud as you gain experience.

But here’s the truth: indicators are only as good as the trader using them. That’s why Token Metrics simplifies the process by combining dozens of technical indicators with AI-powered analysis, giving you clear, actionable insights for smarter trades.

Whether you’re a day trader or a long-term investor, Token Metrics helps you use technical indicators strategically—not emotionally.

Choose from Platinum, Gold, and Silver packages
Reach with 25–30% open rates and 0.5–1% CTR
Craft your own custom ad—from banners to tailored copy
Perfect for Crypto Exchanges, SaaS Tools, DeFi, and AI Products