Back to blog
Research

Top 10 Pump.fun Livestream Tokens by Market Cap

A data-driven leaderboard of Pump.fun livestream tokens ranked strictly by Market Cap, with quick project snapshots and links to TV Live for real-time crypto market news.
Token Metrics Team
10 min read
Want Smarter Crypto Picks—Free?
See unbiased Token Metrics Ratings for BTC, ETH, and top alts.
Thank you! Your submission has been received!
Oops! Something went wrong while submitting the form.
 No credit card | 1-click unsubscribe

Market Cap Rankings for Pump.fun Livestream Tokens

Market Cap represents the circulating valuation of a token. For livestream tokens on Pump.fun, market cap provides a fast way to compare where capital has concentrated, and which communities have built sustained traction. This post references pump.fun crypto context where relevant.

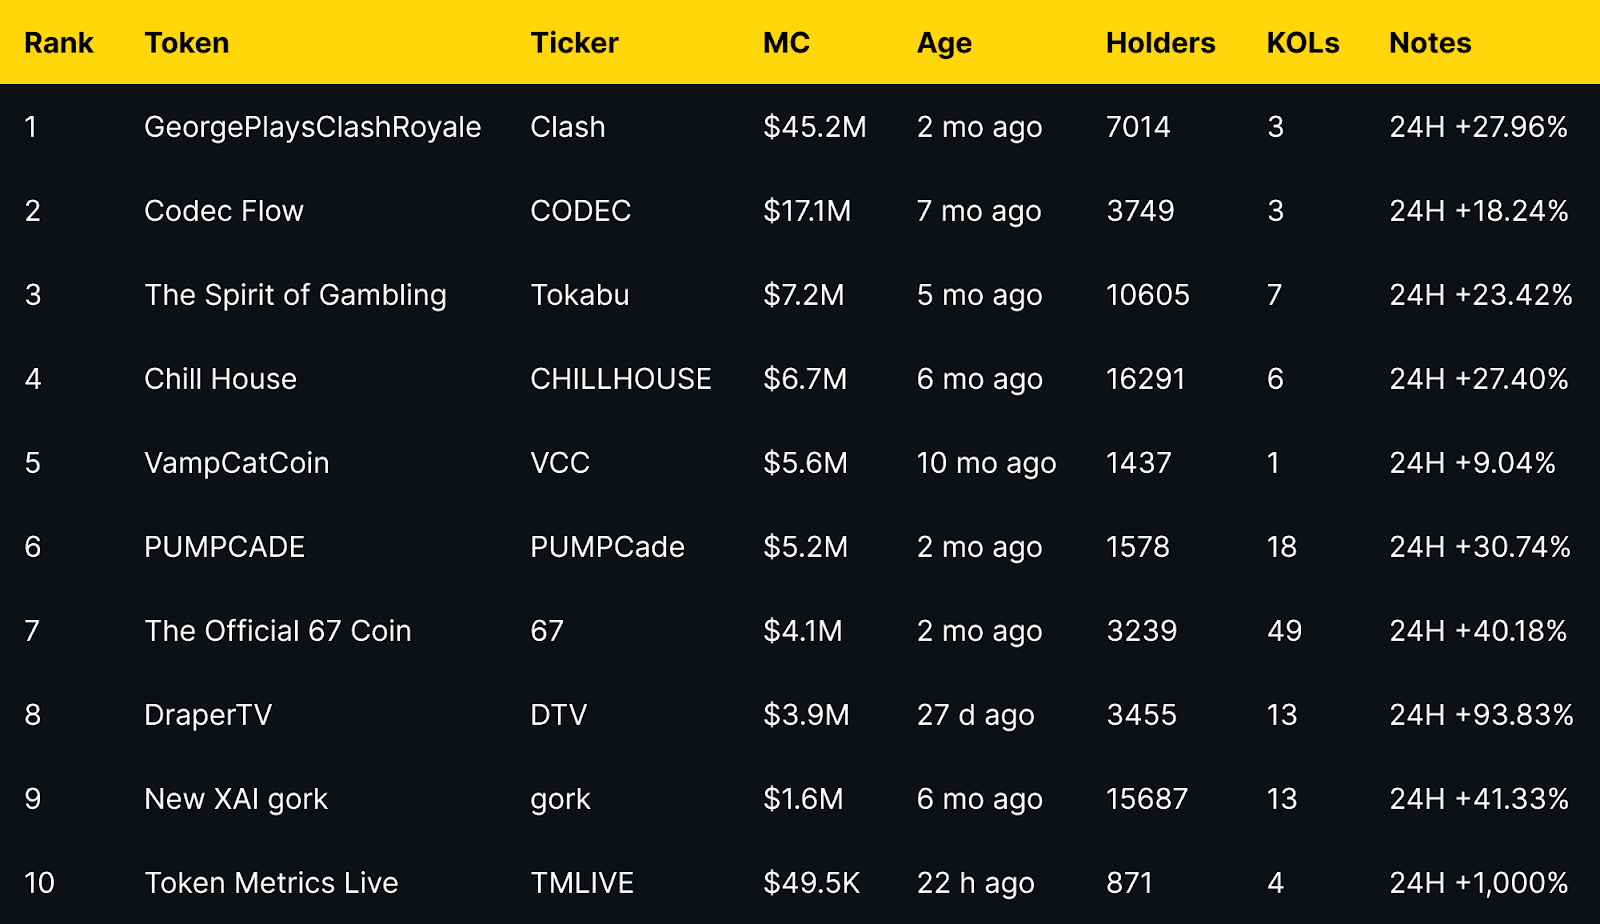
This ranking selects the top 10 Pump.fun tokens by Market Cap from the provided screenshots. Numbers, tickers, and dates are kept exactly as shown, and any missing datapoints are marked with a dash.

Methodology and Secondary Signals

Market cap is a snapshot of attention and liquidity at a point in time. We also track engagement rate and seven-day retention as complementary signals of durability.

When market cap pairs with strong engagement and retention, Pump.fun projects tend to sustain momentum longer. For discovery, some readers follow pump.fun trending tokens and pump.fun new token launches to compare momentum.

Token Metrics Live (TMLIVE): Research-Backed Analysis Enters Pump.fun

While most Pump.fun livestream tokens center on memes, gaming, or creator personalities, Token Metrics Live (TMLIVE) brings a different approach, research-driven market analysis backed by 7 years of consistent crypto content and a 500K+ audience.

TMLIVE launched on Pump.fun on November 4, 2024, capturing 876 holders in its first 22 hours. The token reached an ATH market cap of $291.7K with $1.7M in 24-hour volume, demonstrating strong initial adoption from both the existing Token Metrics community of 100,000+ platform users and new Pump.fun participants.

The team behind TMLIVE has a proven track record in identifying market opportunities early, including coverage of MATIC and Helium in 2018, both became significant market winners. This credibility factor differentiates TMLIVE from hype-driven tokens, positioning it as a substance-over-speculation play in the Pump.fun livestream space.

This blog ranks the top 10 Pump.fun livestream tokens by holder count, examining how community distribution patterns reveal different engagement strategies and durability signals across the ecosystem.

TLDR: Top Pump.fun Token Highlights

  • GeorgePlaysClashRoyale leads by a wide margin at $45.2M MC, followed by Codec Flow at $17.1M.
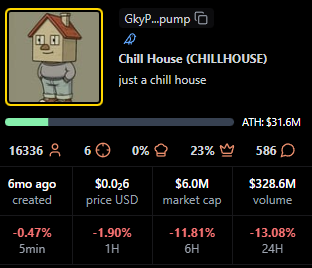
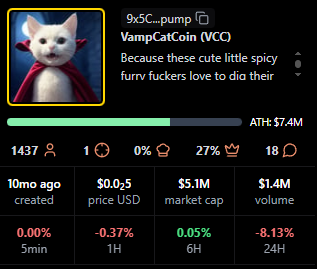
  • Mid-tier projects like Tokabu, Chill House, VampCatCoin, and PUMPCade cluster in the $5 to $7M range.
  • New XAI gork shows strong 24H momentum (+41.33 percent) despite a smaller $1.6M MC.
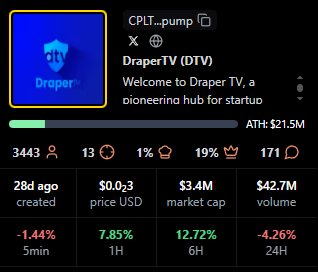
  • DraperTV posts the largest 24H move among mid-caps at +93.83 percent.
  • Token Metrics Live is new with $49.5K MC and early holder growth. For context on valuation, readers often check pump.fun token price or pump.fun price on public pages before comparing caps.

Leaderboard: Pump.fun Tokens by Market Cap

Note, data is taken from screenshots at the time of capture. Reference signals like pump.fun trending tokens 24h gain holders volume for additional context.


Benchmarks to Watch for Pump.fun Livestream Success

  • Peak concurrent viewers
  • Average watch time
  • Chat messages per minute
  • Follower conversion rate from viewers
  • Seven day retention versus launch day

Use these to compare Pump.fun projects beyond market cap. If a data point is not visible in public screenshots, mark it with a dash in the table.

The distribution shows a clear long tail. One mega cap leader, one strong upper mid cap, then a cluster between $3.9M and $7.2M. Several mid caps display notable 24H moves, suggesting active communities and recent stream driven interest.

What Each Pump.fun Livestream Token Does

GeorgePlaysClashRoyale (Clash): Creator Gaming Stream

Watch George play the game Clash Royale on Pump.fun livestreams. Community interest is driven by creator led live content and regular gameplay moments that translate to token engagement. As a pump.fun coin on Solana, the appeal is creator first.

Quick facts: chain = Solana, status = live, milestone = ATH $87.9M shown


https://pump.fun/coin/6nR8wBnfsmXfcdDr1hovJKjvFQxNSidN6XFyfAFZpump 

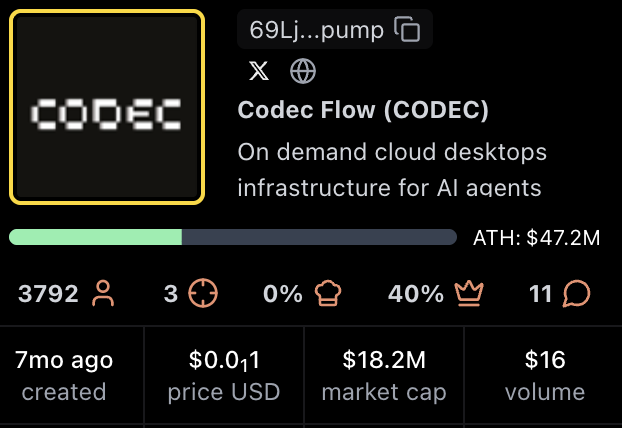
Codec Flow (CODEC): Infrastructure for AI Agents

On demand cloud desktops infrastructure for AI agents. The Codec Flow narrative centers on AI tooling and always on compute for agents using streamed engagement.

Quick facts: chain = Solana, status = live, milestone = ATH $47.2M shown


https://pump.fun/coin/69LjZUUzxj3Cb3Fxeo1X4QpYEQTboApkhXTysPpbpump 

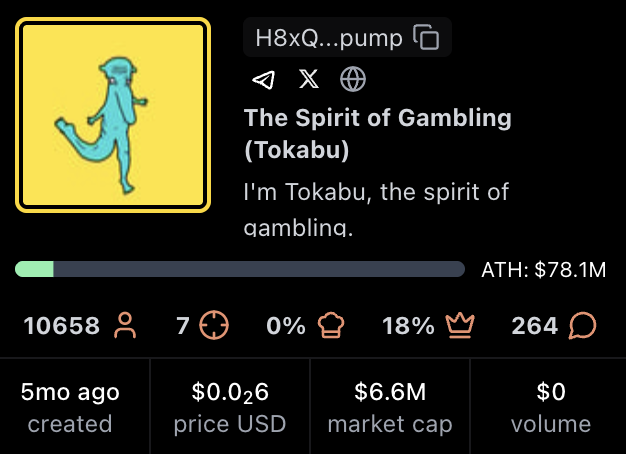
The Spirit of Gambling (Tokabu): Meme Character with Gambling Motif

"I am Tokabu, the spirit of gambling." The Tokabu project leans into a playful narrative and steady Pump.fun live presence.

Quick facts: chain = Solana, status = live, milestone = ATH $78.1M shown


https://pump.fun/coin/H8xQ6poBjB9DTPMDTKWzWPrnxu4bDEhybxiouF8Ppump 

Chill House (CHILLHOUSE): Community Meme with Cozy Theme

"Just a chill house." The Chill House theme suggests community vibes and frequent participation during Pump.fun streams.

Quick facts: chain = Solana, status = live, milestone = ATH $31.6M shown


https://pump.fun/coin/GkyPYa7NnCFbduLknCfBfP7p8564X1VZhwZYJ6CZpump

VampCatCoin (VCC): Cute Vampire Cat Meme

Cats and campy vampire aesthetics drive the VampCatCoin meme. Community humor and recurring references keep engagement high during Pump.fun streams.

Quick facts: chain = Solana, status = live, milestone = ATH $7.4M shown


https://pump.fun/coin/9x5CLPb3SeYSBKvautqpJWPjX9TUCVcWTS12Xawapump

PUMPCADE (PUMPCade): Arcade Mini Games Inside Live Chat

"Play arcade games with others in a Pump.fun live chat and win." The hook is interactive gameplay blended with streaming.

Quick facts: chain = Solana, status = live, milestone = ATH $9.3M shown


https://pump.fun/coin/Eg2ymQ2aQqjMcibnmTt8erC6Tvk9PVpJZCxvVPJz2agu

The Official 67 Coin (67): Creator and Fan Coin

The 67 Coin meme centers on a creator identity and fan-driven momentum on Pump.fun.

Quick facts: chain = Solana, status = live, milestone = ATH $8.0M shown 

https://pump.fun/coin/9AvytnUKsLxPxFHFqS6VLxaxt5p6BhYNr53SD2Chpump

DraperTV (DTV): Media and Community Token

"Welcome to Draper TV, a pioneering hub for startup innovation." The DraperTV token sits at the intersection of media, startups, and community engagement during Pump.fun streams.

Quick facts: chain = Solana, status = live, milestone = ATH $21.5M shown


https://pump.fun/coin/CPLTbYbtDMKZtHBaPqdDmHjxNwESCEB14gm6VuoDpump

New XAI gork (gork): Minimal Meme

No description available. Project details unclear at time of writing.

Quick facts: chain = Solana, status = live, milestone = ATH $100.9M shown 

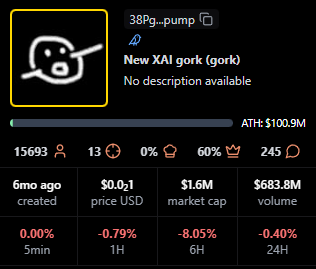
https://pump.fun/coin/38PgzpJYu2HkiYvV8qePFakB8tuobPdGm2FFEn7Dpump

Token Metrics Live (TMLIVE): Media and Live Coverage Token

Token Metrics Live: real-time, data-driven crypto analysis with token breakdowns and live Q&A. 7 years streaming, 500K+ audience. We turn on-chain signals into strategy, actionable insights, smart tools, and a learning community.. TMLIVE powers Token Metrics live coverage and community streams on Pump.fun.

Authority and substance tend to win on Pump.fun. Consistent analyst-led segments, live screening, and real Q and A-drive engagement that lasts beyond a single meme spike.

Quick facts: chain = Solana, status = Created 22 h ago, milestone = ATH $291.7K shown


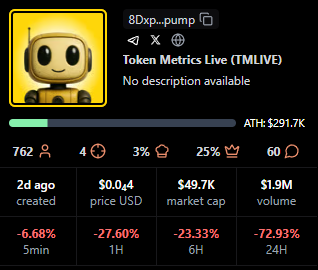
https://pump.fun/coin/8Dxpc8Q8jg7TK8TT1pVntcqunHGofqpetCaP5fEhpump

Signals From Market Cap Performance

  • Higher Market Cap tends to coincide with creator led narratives and sustained streaming cadence on Pump.fun. Several tokens in the $5 to $7M range show steady 24H gains, suggesting ongoing participation rather than one off spikes.
  • Smaller caps with large percentage moves (for example gork and DTV) indicate where attention may be rotating intra day.
  • Market Cap alone does not imply durability, so pairing this view with holders, viewers, and fees is essential. Some readers also track pump.fun solana new tokens feeds for rotation clues.

Additional Signals to Watch for Pump.fun Token Success

  • Structured segments and interactive formats increase average watch time and chat velocity, which correlate with healthier communities after launch.
  • Clear expectations and transparent messaging improve seven day retention compared with hype only streams.
  • Multi channel amplification across X, Telegram, Discord, and email consistently lifts day one reach and discovery for Pump.fun tokens.

Why This Matters for Creators and Traders

  • Creators can design Pump.fun launches around consistent live segments and clear narratives. The leaders here demonstrate how personality, interactivity, or utility themes can carry Market Cap beyond a single hype window.
  • Traders can use Market Cap to quickly size a Pump.fun token's current standing, then layer in Avg Viewers, holders, and fees to judge staying power and crowd quality.

Creator Playbook: Turn Market Cap into Staying Power

  1. Build a real audience first with four to eight weeks of consistent shows on Pump.fun.
  2. Run a structured show for forty five to sixty minutes with clear segments.
  3. Deliver value beyond price talk with analysis, frameworks, and tools viewers can reuse.
  4. Invest in stable audio and video, use on screen CTAs, and make it easy to follow or subscribe.
  5. Coordinate X, Telegram, Discord, and email pushes, then measure results in real time and adjust.

Watch Real Time Coverage on TV Live

  • TV Live brings fast, reliable coverage of Pump.fun streams, token leaderboards, and community momentum. Catch live breakdowns, context on spikes, and interviews with creators.
  • CTA: Watch TV Live for real time crypto market news → TV Live Link
  • CTA: Follow and enable alerts → TV Live
  • For pump.fun news today and real-time breakdowns, watch Token Metrics Live.
Why Token Metrics Is Your Edge for Livestream Crypto Research

Use Token Metrics discovery tools, AI-powered data, and deep analyst research to compare Pump.fun tokens beyond price momentum. Tap into livestreamed daily crypto market intelligence, on-chain signals, and automated alerts to stay ahead of meme coin and Solana trend cycles. Join 100,000+ active users — try Token Metrics free.

FAQs About Pump.fun Livestream Token Market Caps

What non market cap signals matter most for Pump.fun token durability?

Engagement rate measured as messages per viewer per hour, average watch time, follower conversion from viewers, and seven day retention matter most for Pump.fun token durability. These show whether attention sticks once the stream ends.

What is the best way to track Pump.fun livestream leaders by Market Cap?

Use stalkchain.com/streams/scanner or Pump.fun token pages to view current market cap rankings. For historical context, save periodic screenshots to compare changes over time.

Does higher Market Cap predict higher future returns for Pump.fun tokens?

Higher Market Cap does not necessarily predict higher future returns. Market Cap reflects current valuation, not forward performance. Combine it with viewers, fees, and holder growth to evaluate momentum and resilience.

How often do Pump.fun token market cap rankings change?

Pump.fun token market cap rankings change intraday in many cases. This post reflects the timestamp of the provided screenshots.

what is pump.fun

Pump.fun is a Solana based launch and livestream platform where creators can launch tokens and stream to communities. It is a directory of coins and live shows with token pages, a feed, and basic discovery features.

how does pump.fun work

Creators launch a token and go live, viewers discover and watch streams, and token pages show public metrics. Always verify contract addresses on chain and avoid relying on unverified claims.

is pump.fun legit

Pump.fun is a widely used Solana site for token launches and streams. As with any crypto site, use caution, verify contracts, and never invest more than you can afford to lose.

how to make a coin on pump.fun / how to create a coin on pump.fun

On the pump.fun website, creators use the launch flow to create a token, provide basic details, and publish. Review the interface carefully and confirm on chain details before sharing links.

pump.fun program id solana / pump.fun solana program id / pump.fun program id

On Solana, a program ID identifies the deployed program that executes instructions. The program ID typically appears in developer tooling or Explorer views for the pump.fun contracts.

pump.fun api / pump.fun api docs / pump.fun api documentation

APIs let developers read public data like token lists or recent launches. Check official pump.fun documentation pages for endpoints and usage, then test carefully in a sandbox.

pump.fun bonding curve formula

A bonding curve describes how token price changes as supply increases. Many launch tools use curves that raise prices as more tokens are bought. This is educational only and not investment advice.

pump.fun airdrop

Airdrops are sometimes mentioned by communities. Treat any airdrop claims with caution and verify through official channels. There are no guarantees.

pump.fun price prediction

Price predictions are inherently uncertain and speculative. For education, compare public metrics and historical snapshots, and avoid relying on forecasts.

pump.fun coin / pump.fun token

These phrases generally refer to tokens launched on the site. Always verify token pages and on chain data.

pump.fun token price / pump.fun price / pump.fun pump price / pump.fun token pump price

Current price views are available on token pages. Prices change frequently during livestreams and may differ across aggregators.

pump.fun bot

Some users employ trading or alert bots to monitor launches and prices. Use third party tools with care and do not share private keys.

pump.fun revenue

Public pages sometimes describe fees and platform mechanics. Revenue models can include creator or platform fees documented on official resources.

teen pump.fun 250m khaliliwired / teen 50k pump.fun

These look like search phrases seen in community chatter. Treat unrelated viral terms with skepticism and rely on official project pages for facts.

pump.fun token bonding time raydium listing

Some launches discuss bonding or listing timelines. Check the specific token page or official posts for any Raydium listing details.

pump.fun logo

Logos typically appear on token or platform pages. Use official assets from the pump.fun website when available.

pump.fun website

Visit the main directory to explore streams, coin pages, and recent launches. Bookmark official links only.

Next Steps for Tracking Pump.fun Tokens

  • Subscribe to TV Live updates → [NEWSLETTER_OR_ALERTS_LINK]
  • Read the next leaderboard post in this series.
  • Join the community stream on Pump.fun if a link is provided.
  • Track viewer, chat, follow, and retention metrics for each token you monitor, then re rank your personal list every week.

Disclosure

Educational content only. Cryptocurrency involves risk. Always do your own research.

Build Smarter Crypto Apps &
AI Agents in Minutes, Not Months
Real-time prices, trading signals, and on-chain insights all from one powerful API.
Grab a Free API Key
About Token Metrics
Token Metrics: AI-powered crypto research and ratings platform. We help investors make smarter decisions with unbiased Token Metrics Ratings, on-chain analytics, and editor-curated “Top 10” guides. Our platform distills thousands of data points into clear scores, trends, and alerts you can act on.
30 Employees
analysts, data scientists, and crypto engineers
Daily Briefings
concise market insights and “Top Picks”
Transparent & Compliant
Sponsored ≠ Ratings; research remains independent
Want Smarter Crypto Picks—Free?
See unbiased Token Metrics Ratings for BTC, ETH, and top alts.
Thank you! Your submission has been received!
Oops! Something went wrong while submitting the form.
 No credit card | 1-click unsubscribe
Token Metrics Team
Token Metrics Team

Recent Posts

Research

Hedera Price Prediction 2027: $0.10-$1.42 Target Analysis

Token Metrics Team
8 min read

Hedera Price Prediction: Portfolio Context for HBAR in the 2027 Landscape

Layer 1 tokens like Hedera represent bets on specific blockchain architectures winning developer and user mindshare. HBAR carries both systematic crypto risk and unsystematic risk from Hedera's technical roadmap execution and ecosystem growth. Multi-chain thesis suggests diversifying across several L1s rather than concentrating in one, since predicting which chains will dominate remains difficult.

The price prediction projections below show how HBAR might perform under different market cap scenarios. While Hedera may have strong fundamentals, prudent portfolio construction balances L1 exposure across Ethereum, competing smart contract platforms, and Bitcoin to capture the sector without overexposure to any single chain's fate.


Disclosure

Educational purposes only, not financial advice. Crypto is volatile, do your own research and manage risk.

How to read this price prediction:

Each band blends cycle analogues and market-cap share math with TA guardrails. Base assumes steady adoption and neutral or positive macro. Moon layers in a liquidity boom. Bear assumes muted flows and tighter liquidity.

TM Agent baseline:

Token Metrics lead metric for Hedera price prediction, cashtag $HBAR, is a TM Grade of 61.8%, which maps to Hold, and the trading signal is bearish, indicating short-term downward momentum. This means Token Metrics views $HBAR as having reasonably solid fundamentals but limited conviction for strong outperformance in the near term.

A concise long-term numeric price prediction view for a 12-month horizon: Token Metrics scenarios center around a range of about $0.06 to $0.18, with a base case price target near $0.10, reflecting steady ecosystem growth, moderate adoption of Hedera services, and continued enterprise partnerships. Implication: if Bitcoin and broader crypto risk appetite improve, $HBAR could revisit the higher end of the price prediction range, while a risk-off market or slower-than-expected developer traction would keep it toward the lower bound.

Token Details

Key Takeaways

  • Scenario driven, outcomes hinge on total crypto market cap, higher liquidity and adoption lift the bands.
  • Single-asset concentration amplifies both upside and downside versus diversified approaches.
  • Fundamentals: Fundamental Grade 81.08% (Community 74%, Tokenomics 100%, Exchange 100%, VC 59%, DeFi Scanner 85%).
  • Technology: Technology Grade 62.39% (Activity 58%, Repository 68%, Collaboration 74%, Security 56%, DeFi Scanner 85%).
  • TM Agent gist: bearish short term, range view with upside if crypto risk appetite improves.
  • Education only, not financial advice.

Hedera Price Prediction: Scenario Analysis

Token Metrics price prediction scenarios span four market cap tiers, each representing different levels of crypto market maturity and liquidity:

8T Market Cap Price Prediction:

At an 8 trillion dollar total crypto market cap, HBAR price prediction projects to $0.27 in bear conditions, $0.32 in the base case, and $0.37 in bullish scenarios.

16T Market Cap Price Prediction:

Doubling the market to 16 trillion expands the price prediction range to $0.42 (bear), $0.57 (base), and $0.72 (moon).

23T Market Cap Price Prediction:

At 23 trillion, the price forecast scenarios show $0.56, $0.82, and $1.07 respectively.

31T Market Cap Price Prediction:

In the maximum liquidity scenario of 31 trillion, HBAR price prediction could reach $0.71 (bear), $1.07 (base), or $1.42 (moon).

These price prediction ranges illustrate potential outcomes for concentrated HBAR positions, but investors should weigh whether single-asset exposure matches their risk tolerance or whether diversified strategies better suit their objectives.

The Case for Diversified Index Exposure

Professional investors across asset classes prefer diversified exposure over concentrated bets for good reason. Hedera faces numerous risks - technical vulnerabilities, competitive pressure, regulatory targeting, team execution failure - any of which could derail HBAR performance independent of broader market conditions. Token Metrics Indices spread this risk across one hundred tokens, ensuring no single failure destroys your crypto portfolio.

Diversification becomes especially critical in crypto given the sector's nascency and rapid evolution. Technologies and narratives that dominate today may be obsolete within years as the space matures. By holding HBAR exclusively, you're betting not only on crypto succeeding but on Hedera specifically remaining relevant. Index approaches hedge against picking the wrong horse while maintaining full crypto exposure.

Tax efficiency and rebalancing challenges also favor indices over managing concentrated positions. Token Metrics Indices handle portfolio construction, rebalancing, and position sizing systematically, eliminating the emotional and logistical burden of doing this manually with multiple tokens.

Early access to Token Metrics Indices 

What Is Hedera?

Hedera is a high-performance public ledger that emphasizes speed, low fees, and energy efficiency, positioning itself for enterprise and decentralized applications. It uses a unique Hashgraph consensus that enables fast finality and high throughput, paired with a council-governed model that targets real-world use cases like payments, tokenization, and decentralized identity.

HBAR is the native token used for fees, staking, and network security, and it supports smart contracts and decentralized file storage. Adoption draws from partnerships and integrations, though decentralization levels and reliance on institutional demand are often discussed in the community.

Token Metrics AI Analysis for Price Prediction

Token Metrics AI provides comprehensive context on Hedera's positioning and challenges that inform our price prediction models.

  • Vision: Hedera's vision is to provide a secure, fair, and scalable distributed ledger technology platform that supports decentralized applications and enterprise use cases globally. It emphasizes governed decentralization, aiming to combine the benefits of distributed systems with responsible oversight through its council-based governance model.
  • Problem: Many blockchain networks face trade-offs between scalability, security, and decentralization, often resulting in high transaction fees, slow processing times, or environmental concerns. Hedera aims to address these limitations by offering a system that supports high throughput and fast finality without sacrificing security or incurring significant energy costs, making it suitable for both enterprise and decentralized applications.
  • Solution: Hedera uses the Hashgraph consensus algorithm, a directed acyclic graph (DAG)-based approach that achieves asynchronous Byzantine fault tolerance, enabling fast, secure, and fair transaction processing. The network supports smart contracts, tokenization, and decentralized file storage, with HBAR serving as the native token for fees, staking, and network security. Its council-governed model aims to ensure stability and trust, particularly for institutional and enterprise users.
  • Market Analysis: Hedera operates in the Layer 1 blockchain space, competing with high-throughput platforms like Solana, Avalanche, and Algorand, while differentiating through its Hashgraph consensus and governed governance model. It targets enterprise adoption, focusing on use cases in supply chain, payments, and asset tokenization, which sets it apart from more community-driven or DeFi-centric networks. Adoption is influenced by strategic partnerships, developer engagement, and real-world integrations rather than speculative activity. Key risks include competition from established and emerging blockchains, regulatory scrutiny around governance tokens, and challenges in achieving broad decentralization.

Fundamental and Technology Snapshot from Token Metrics

Fundamental Grade: 81.08% (Community 74%, Tokenomics 100%, Exchange 100%, VC 59%, DeFi Scanner 85%).


Technology Grade: 62.39% (Activity 58%, Repository 68%, Collaboration 74%, Security 56%, DeFi Scanner 85%).


Catalysts That Skew Bullish for Price Prediction

  • Institutional and retail access expands with ETFs, listings, and integrations
  • Macro tailwinds from lower real rates and improving liquidity
  • Product or roadmap milestones such as upgrades, scaling, or partnerships
  • These factors could push HBAR toward higher price prediction targets

Risks That Skew Bearish for Price Prediction

  • Macro risk-off from tightening or liquidity shocks
  • Regulatory actions or infrastructure outages
  • Concentration in validator economics and competitive displacement
  • Protocol-specific execution risk and competitive pressure from alternatives
  • These factors could push HBAR toward lower price prediction scenarios

FAQs: Hedera Price Prediction

Can HBAR reach $1.00 according to price predictions?

Yes. Based on the price prediction scenarios, HBAR could reach $1.00 or above in the higher tiers. The 23T tier projects $1.07 in the moon case price forecast and the 31T tier projects $1.42 in the moon case. Achieving this price prediction requires broad market cap expansion and Hedera maintaining competitive position. Not financial advice.

What price could HBAR reach in the moon case price prediction?

Moon case price predictions range from $0.37 at 8T to $1.42 at 31T total crypto market cap. These price prediction scenarios assume maximum liquidity expansion and strong Hedera adoption. Diversified strategies aim to capture upside across multiple tokens rather than betting exclusively on any single moon scenario. Not financial advice.

What's the risk/reward profile for HBAR price prediction?

Risk and reward in our price prediction model span from $0.27 in the lowest bear case to $1.42 in the highest moon case. Downside risks include regulatory or infrastructure setbacks and competitive pressure, while upside drivers include improved liquidity and enterprise adoption. Concentrated positions amplify both tails, while diversified strategies smooth outcomes.

What is the 2027 Hedera price prediction?

Based on Token Metrics analysis, the 2027 price prediction for Hedera centers around $0.10 in the base case under current market conditions, with a range between $0.06 and $0.18 depending on market scenarios. Bullish price predictions range from $0.32 to $1.42 across different total crypto market cap environments.

What drives HBAR price predictions?

HBAR price predictions are driven by enterprise adoption of Hashgraph technology, institutional partnerships (Google Cloud, IBM, Boeing), council governance decisions, and competition from other Layer 1 platforms. The strong fundamentals (81.08% grade) support long-term price potential, though short-term bearish signals suggest caution. Enterprise use case development remains the primary driver for reaching upper price prediction targets.

Can HBAR reach $0.50 by 2027?

According to our price prediction models, HBAR could reach $0.50+ in multiple scenarios: the 16T base case ($0.57), 16T moon case ($0.72), and all higher market cap tiers. This price prediction outcome requires steady crypto market growth (16T+ total market cap) and Hedera maintaining strong enterprise partnerships. Not financial advice.


Next Steps

Disclosure

Educational purposes only, not financial advice. Crypto is volatile, concentration amplifies risk, and diversification is a fundamental principle of prudent portfolio construction. Do your own research and manage risk appropriately.

Research

LEO Token Price Prediction: Comprehensive Market Cap Scenario Analysis

Token Metrics Team
5 min read

LEO Token Price Prediction Framework: Market Cap Scenarios

Exchange tokens derive value from trading volume and platform revenue, creating linkage between crypto market activity and LEO price action. LEO Token delivers utility through reduced trading fees and enhanced platform services on Bitfinex and iFinex across Ethereum and EOS. Token Metrics price prediction scenarios below model LEO outcomes across different total crypto market cap environments, providing investors with data-driven forecasts for strategic decision-making.


Disclosure

Educational purposes only, not financial advice. Crypto is volatile, do your own research and manage risk.

How to Read This LEO Price Prediction

Each band blends cycle analogues and market-cap share math with TA guardrails. Base assumes steady adoption and neutral or positive macro. Moon layers in a liquidity boom. Bear assumes muted flows and tighter liquidity.

TM Agent baseline: Token Metrics price prediction probabilities favor a modest range between about $5 and $15, with a base case around current levels near $9, conditional on exchange token utility remaining steady, and downside risk if centralized exchange macro pressure increases.

Live details: Token Details 

Key Takeaways

  • Scenario driven, outcomes hinge on total crypto market cap, higher liquidity and adoption lift the bands.
  • TM Agent gist: 12-month horizon favors $5 to $15 range with base case near $9, contingent on stable exchange utility.
  • Education only, not financial advice.

LEO Token Price Prediction Scenario Analysis

Token Metrics price prediction scenarios span four market cap tiers reflecting different crypto market maturity levels:

8T Market Cap - LEO Price Prediction:

At 8 trillion total crypto market cap, LEO price prediction projects to $11.35 in bear conditions, $12.92 in the base case, and $14.48 in bullish scenarios.

16T Market Cap - LEO Price Prediction:

At 16 trillion total crypto market cap, LEO price prediction projects to $14.82 in bear conditions, $19.51 in the base case, and $24.20 in bullish scenarios.

23T Market Cap - LEO Price Prediction:

At 23 trillion total crypto market cap, LEO price prediction projects to $18.28 in bear conditions, $26.10 in the base case, and $33.92 in bullish scenarios.

31T Market Cap - LEO Price Prediction:

At 31 trillion total crypto market cap, LEO price prediction projects to $21.74 in bear conditions, $32.69 in the base case, and $43.63 in bullish scenarios.

Each tier in our price prediction framework assumes progressively stronger market conditions, with base scenarios reflecting steady exchange growth and moon cases requiring sustained bull market dynamics.

What Is LEO Token?

LEO Token is the native utility token of the Bitfinex and iFinex ecosystem, designed to provide benefits like reduced trading fees, enhanced lending and borrowing terms, and access to exclusive features on the platform. It operates on both Ethereum (ERC-20) and EOS blockchains, offering flexibility for users.

The primary role of LEO is to serve as a utility token within the exchange ecosystem, enabling fee discounts, participation in token sales, and other platform-specific advantages. Common usage patterns include holding LEO to reduce trading costs and utilizing it for enhanced platform services, positioning it primarily within the exchange token sector.

Catalysts That Skew LEO Price Predictions Bullish

  • Institutional and retail access expands with ETFs, listings, and integrations
  • Macro tailwinds from lower real rates and improving liquidity
  • Product or roadmap milestones such as upgrades, scaling, or partnerships
  • Increased Bitfinex trading volume and platform adoption
  • Strategic token burns and buyback programs

Risks That Skew LEO Price Predictions Bearish

  • Macro risk-off from tightening or liquidity shocks
  • Regulatory actions targeting centralized exchanges or infrastructure outages
  • Concentration risk or competitive displacement from rival exchange tokens
  • Declining exchange market share or trading volume
  • Negative sentiment around centralized exchange tokens

LEO Token Price Prediction FAQs

What gives LEO value?

LEO accrues value through reduced trading fees and enhanced platform services within the Bitfinex and iFinex ecosystem. Demand drivers include exchange usage and access to platform features, while supply dynamics follow the token's exchange utility design. Value realization depends on platform activity and user adoption—key factors in our price prediction methodology.

What price could LEO reach in the moon case?

Our moon case price predictions range from $14.48 at 8T to $43.63 at 31T total crypto market cap. These scenarios require maximum market cap expansion and strong exchange activity. Not financial advice.

What is the LEO Token price prediction for 2025-2027?

Our comprehensive price prediction framework suggests LEO could trade between $5 and $43.63 depending on market conditions and total crypto market capitalization. The base case price prediction scenario clusters around $9 to $32.69 across different market cap environments over the next 12-24 months. Not financial advice.

Can LEO Token reach $20?

Yes. Based on our price prediction scenarios, LEO could reach $19.51 in the 16T base case and surpass $20 in higher market cap scenarios (23T and 31T tiers). The 23T base case projects $26.10, making $20 an achievable target under favorable market conditions. Not financial advice.

Can LEO Token reach $50?

LEO reaching $50 would exceed our current price prediction models' highest scenario of $43.63 (31T moon case). This would require extraordinary market conditions beyond the 31T total crypto market cap tier and exceptional Bitfinex platform growth. Not financial advice.

Is LEO Token a good investment based on price predictions?

LEO's price prediction is tied to Bitfinex exchange performance and utility value. The token offers fee discounts and platform benefits, with moderate growth potential in our base scenarios. However, exchange token valuations carry platform-specific risks. Always conduct your own research and consult financial advisors. Not financial advice.

How accurate are LEO Token price predictions?

Our LEO price predictions use scenario-based modeling across multiple market cap tiers, combining cycle analogues, market-cap share math, and technical analysis guardrails. While this methodology provides structured forecasts, cryptocurrency markets remain highly volatile and unpredictable. Use these price predictions as educational frameworks, not guarantees. Not financial advice.


Next Steps

Curious how these forecasts are made? Token Metrics delivers LEO on-chain grades, forecasts, and deep research on 6,000+ tokens. Instantly compare fundamentals, on-chain scores, and AI-powered predictions.

Disclosure

Educational purposes only, not financial advice. Crypto is volatile, do your own research and manage risk.

Why Use Token Metrics for LEO Price Predictions?

  • Data-driven forecasts: Scenario-based price prediction models across multiple market cap tiers
  • Comprehensive analysis: On-chain metrics, fundamental grades, and technical guardrails
  • AI-powered insights: Advanced algorithms analyze 6,000+ tokens for comparative analysis
  • Regular updates: Real-time price predictions and signals based on market conditions
  • Risk management: Multiple scenarios (bear, base, moon) for informed decision-making
Research

SUI Price Prediction 2027: Layer-1 Portfolio Diversification Analysis

Token Metrics Team
8 min read

Portfolio Context for Sui Price Prediction: Diversification in the 2027 Landscape

Layer 1 tokens like Sui represent bets on specific blockchain architectures winning developer and user mindshare. SUI carries both systematic crypto risk and unsystematic risk from Sui's technical roadmap execution and ecosystem growth. Multi-chain thesis suggests diversifying across several L1s rather than concentrating in one, since predicting which chains will dominate remains difficult.

The SUI price prediction projections below show how SUI might perform under different market cap scenarios. While Sui may have strong fundamentals, prudent portfolio construction balances L1 exposure across Ethereum, competing smart contract platforms, and Bitcoin to capture the sector without overexposure to any single chain's fate.


Disclosure

Educational purposes only, not financial advice. Crypto is volatile, do your own research and manage risk.

How to Read This SUI Price Prediction Framework

Each band blends cycle analogues and market-cap share math with TA guardrails. Base assumes steady adoption and neutral or positive macro. Moon layers in a liquidity boom. Bear assumes muted flows and tighter liquidity.

TM Agent baseline: Token Metrics lead metric for Sui, cashtag $SUI, is a TM Grade of 67.4%, which maps to a Hold, and the trading signal is bearish, indicating short-term downward momentum. This suggests Token Metrics sees $SUI as having reasonable fundamentals but not yet strong conviction for substantial outperformance in our price prediction models, while near-term momentum is negative and could limit rallies. Market context, brief: Bitcoin's price direction is currently the primary market driver, and a risk-off Bitcoin environment increases downside pressure on layer-1 tokens like $SUI.

Token Details 

The Case for Diversified Index Exposure

Professional investors across asset classes prefer diversified exposure over concentrated bets for good reason. Sui faces numerous risks—technical vulnerabilities, competitive pressure, regulatory targeting, team execution failure—any of which could derail SUI price prediction performance independent of broader market conditions. Token Metrics Indices spread this risk across one hundred tokens, ensuring no single failure destroys your crypto portfolio.

Diversification becomes especially critical in crypto given the sector's nascency and rapid evolution. Technologies and narratives that dominate today may be obsolete within years as the space matures. By holding SUI exclusively, you're betting not only on crypto succeeding but on Sui specifically remaining relevant. Index approaches hedge against picking the wrong horse while maintaining full crypto exposure.

Early access to Token Metrics Indices

Key Takeaways: SUI Price Prediction Summary

  • Scenario driven: Price prediction outcomes hinge on total crypto market cap; higher liquidity and adoption lift the bands
  • Single-asset concentration: Amplifies both upside and downside versus diversified approaches
  • Fundamentals: Fundamental Grade 77.60% (Community 80%, Tokenomics 60%, Exchange 100%, VC 76%, DeFi Scanner 75%)
  • Technology: Technology Grade 79.06% (Activity 77%, Repository 72%, Collaboration 89%, Security N/A, DeFi Scanner 75%)
  • TM Agent gist: Hold grade, bearish trading signal, near-term negative momentum in price prediction models
  • Education only, not financial advice

SUI Price Prediction Scenario Analysis

Token Metrics price prediction scenarios span four market cap tiers, each representing different levels of crypto market maturity and liquidity:

8T Market Cap - SUI Price Prediction:

At an 8 trillion total crypto market cap, SUI price prediction projects to $4.64 in bear conditions, $6.29 in the base case, and $7.94 in bullish scenarios.

16T Market Cap - SUI Price Prediction:

At a 16 trillion total crypto market cap, SUI price prediction projects to $8.93 in bear conditions, $13.88 in the base case, and $18.83 in bullish scenarios.

23T Market Cap - SUI Price Prediction:

At a 23 trillion total crypto market cap, SUI price prediction projects to $13.22 in bear conditions, $21.47 in the base case, and $29.72 in bullish scenarios.

31T Market Cap - SUI Price Prediction:

At a 31 trillion total crypto market cap, SUI price prediction projects to $17.50 in bear conditions, $29.05 in the base case, and $40.61 in bullish scenarios.

These price prediction ranges illustrate potential outcomes for concentrated SUI positions, but investors should weigh whether single-asset exposure matches their risk tolerance or whether diversified strategies better suit their objectives.

What Is Sui?

Sui is a layer-1 blockchain network designed for general-purpose smart contracts and scalable user experiences. It targets high throughput and fast settlement, aiming to support applications that need low-latency interactions and horizontal scaling.

SUI is the native token used for transaction fees and staking, aligning validator incentives and securing the network. It underpins activity across common crypto sectors such as NFTs and DeFi while the ecosystem builds developer tooling and integrations.

Token Metrics AI Analysis

Token Metrics AI provides comprehensive context informing our SUI price prediction models:

Vision: Sui aims to create a highly scalable and low-latency blockchain platform that enables seamless user experiences for decentralized applications. Its vision centers on making blockchain technology accessible and efficient for mainstream applications by removing traditional bottlenecks in transaction speed and cost.

Problem: Many existing blockchains face trade-offs between scalability, security, and decentralization, often resulting in high fees and slow transaction finality during peak usage. This limits their effectiveness for applications requiring instant settlement, frequent interactions, or large user bases, such as games or social platforms. Sui addresses the need for a network that can scale horizontally without sacrificing speed or cost-efficiency.

Solution: Sui uses a unique object-centric blockchain model and the Move programming language to enable parallel transaction processing, allowing high throughput and instant finality for many operations. Its consensus mechanism, Narwhal and Tusk, is optimized for speed and scalability by decoupling transaction dissemination from ordering. The network supports smart contracts, NFTs, and decentralized applications, with an emphasis on developer ease and user experience. Staking is available for network security, aligning with common proof-of-stake utility patterns.

Market Analysis: Sui competes in the layer-1 blockchain space with platforms like Solana, Avalanche, and Aptos, all targeting high-performance decentralized applications. It differentiates itself through its object-based data model and parallel execution, aiming for superior scalability in specific workloads. Adoption drivers include developer tooling, ecosystem incentives, and integration with wallets and decentralized exchanges. The broader market for high-throughput blockchains is driven by demand for scalable Web3 applications, though it faces risks from technical complexity, regulatory uncertainty, and intense competition—all critical factors in our price prediction analysis.

Fundamental and Technology Snapshot from Token Metrics

Fundamental Grade: 77.60% (Community 80%, Tokenomics 60%, Exchange 100%, VC 76%, DeFi Scanner 75%).


Technology Grade: 79.06% (Activity 77%, Repository 72%, Collaboration 89%, Security N/A, DeFi Scanner 75%).


Catalysts That Skew SUI Price Predictions Bullish

  • Institutional and retail access expands with ETFs, listings, and integrations
  • Macro tailwinds from lower real rates and improving liquidity
  • Product or roadmap milestones such as upgrades, scaling, or partnerships
  • Growing developer ecosystem and dApp adoption
  • Strategic partnerships with major Web3 platforms

Risks That Skew SUI Price Predictions Bearish

  • Macro risk-off from tightening or liquidity shocks
  • Regulatory actions or infrastructure outages
  • Concentration or validator economics and competitive displacement
  • Protocol-specific execution risk and competitive pressure from alternatives
  • Technical vulnerabilities or smart contract exploits

How Token Metrics Can Help

Token Metrics empowers you to analyze Sui and hundreds of digital assets with AI-driven ratings, on-chain and fundamental data, and index solutions to manage portfolio risk smartly in a rapidly evolving crypto market. Our price prediction frameworks provide scenario-based analysis to inform your investment decisions.

SUI Price Prediction FAQs

What price could SUI reach in the moon case?

Our moon case price predictions range from $7.94 at 8T to $40.61 at 31T total crypto market cap. These scenarios assume maximum liquidity expansion and strong Sui adoption. Diversified strategies aim to capture upside across multiple tokens rather than betting exclusively on any single moon scenario. Not financial advice.

What is the SUI price prediction for 2025-2027?

Our comprehensive SUI price prediction framework suggests SUI could trade between $4.64 and $40.61 depending on market conditions and total crypto market capitalization. The base case price prediction scenario clusters around $6.29 to $29.05 across different market cap environments. Current TM Grade of 67.4% indicates a Hold rating with bearish near-term momentum. Not financial advice.

Can SUI reach $20?

Yes. Based on our price prediction scenarios, SUI could reach $21.47 in the 23T base case and $18.83 in the 16T moon case. The price target of $20 becomes achievable in moderate to high market cap environments with steady ecosystem growth. Not financial advice.

Can SUI reach $50?

SUI reaching $50 would exceed our current price prediction models' highest scenario of $40.61 (31T moon case). This would require extraordinary market conditions beyond the 31T total crypto market cap tier, exceptional ecosystem adoption, and SUI capturing significant market share from competing L1s. Not financial advice.

What's the risk/reward profile for SUI?

Our SUI price prediction risk/reward spans from $4.64 to $40.61 across all scenarios. Downside risks include regulatory pressure and competitive displacement, while upside drivers include ecosystem growth and favorable liquidity. Concentrated positions amplify both tails, while diversified strategies smooth outcomes and reduce single-asset risk.

What are the biggest risks to SUI price predictions?

Key risks that could impact SUI price predictions include regulatory actions, technical issues, competitive pressure from other L1s (Solana, Avalanche, Aptos), adverse market liquidity, validator centralization concerns, and execution challenges. Concentrated SUI positions magnify exposure to these risks. Diversified strategies spread risk across tokens with different profiles, reducing portfolio vulnerability to any single failure point.

Is SUI a good investment based on price predictions?

SUI shows solid fundamentals (77.60% grade) and technology scores (79.06% grade), but currently has a Hold rating (67.4% TM Grade) with bearish near-term trading signals. While our price prediction models show potential upside in favorable market conditions, the bearish momentum and L1 competition suggest a cautious approach. Consider diversified exposure rather than concentrated positions. Not financial advice.

How does SUI compare to other L1 price predictions?

SUI competes with Solana, Avalanche, and Aptos in the high-performance L1 space. Our price prediction framework suggests SUI's performance will correlate with broader L1 adoption trends while facing differentiation challenges. Diversified L1 exposure through indices may offer better risk-adjusted returns than concentrated SUI positions, as predicting which specific L1 will dominate remains uncertain.


Next Steps

Disclosure
Educational purposes only, not financial advice. Crypto is volatile, concentration amplifies risk, and diversification is a fundamental principle of prudent portfolio construction. Do your own research and manage risk appropriately.

Why Use Token Metrics for SUI Price Predictions?

  • Scenario-based modeling: Multiple market cap tiers for comprehensive price prediction analysis
  • AI-driven analysis: Fundamental (77.60%) and technology (79.06%) grades for informed decisions
  • Risk management tools: Index solutions to diversify L1 exposure beyond single-asset concentration
  • Real-time signals: Trading signals and TM Grades updated regularly
  • Comparative analysis: Analyze SUI against 6,000+ tokens for portfolio optimization
Choose from Platinum, Gold, and Silver packages
Reach with 25–30% open rates and 0.5–1% CTR
Craft your own custom ad—from banners to tailored copy
Perfect for Crypto Exchanges, SaaS Tools, DeFi, and AI Products