Back to blog
Research

Top Data Availability Layers (2025)

Compare the top 10 data availability layers for rollups and appchains in 2025. See who leads on DA security, costs, and modular integrations. Includes use case decision guide and common pitfalls.
Token Metrics Team
11 min read
Want Smarter Crypto Picks—Free?
See unbiased Token Metrics Ratings for BTC, ETH, and top alts.
Thank you! Your submission has been received!
Oops! Something went wrong while submitting the form.
 No credit card | 1-click unsubscribe

Who this guide is for. Teams launching rollups or appchains that need reliable, verifiable data availability layers to minimize costs while preserving security.

Top three picks.

  • Celestia — lowest-friction modular DA with broad tooling and clear blob fee model.
  • EigenDA — high-throughput, Ethereum-aligned DA with reserved/on-demand bandwidth tiers.
  • Avail — production DA with developer-friendly docs and transparent fee formula.

Caveat. Fees vary by data size, congestion, and commitment type (on-chain blobs vs. off-chain DA/DAC). Always confirm region eligibility and SLAs in provider docs.


Introduction: Why Data Availability Layers Matter in November 2025

Data availability layers let rollups publish transaction data so anyone can reconstruct state and verify proofs. In 2025, modular stacks (OP Stack, Polygon CDK, ZK Stack) routinely separate execution from DA to optimize costs and performance. Your DA choice affects security (trust assumptions), fees (blob gas vs. DA network fees), and UX (latency, bandwidth caps).
Search intent here is commercial-investigational: teams comparing providers by cost, security model, and integration options. We’ll keep things concrete, link only official sources, and show exactly who each option fits.

How We Picked (Methodology & Scoring)

  • Liquidity/Scale — 30%: adoption, throughput, sustained bandwidth.
  • Security — 25%: trust assumptions (L1 blobs vs. DAC), transparency, docs.
  • Coverage — 15%: SDKs, stacks supported (OP Stack, Polygon CDK, ZK Stack), bridges.
  • Costs — 15%: posted pricing/fee mechanics.
  • UX — 10%: setup, tooling, observability.
  • Support — 5%: docs, guides, contact points.
    Data from official docs/pricing/status pages; third-party datasets used only for cross-checks. Last updated November 2025.
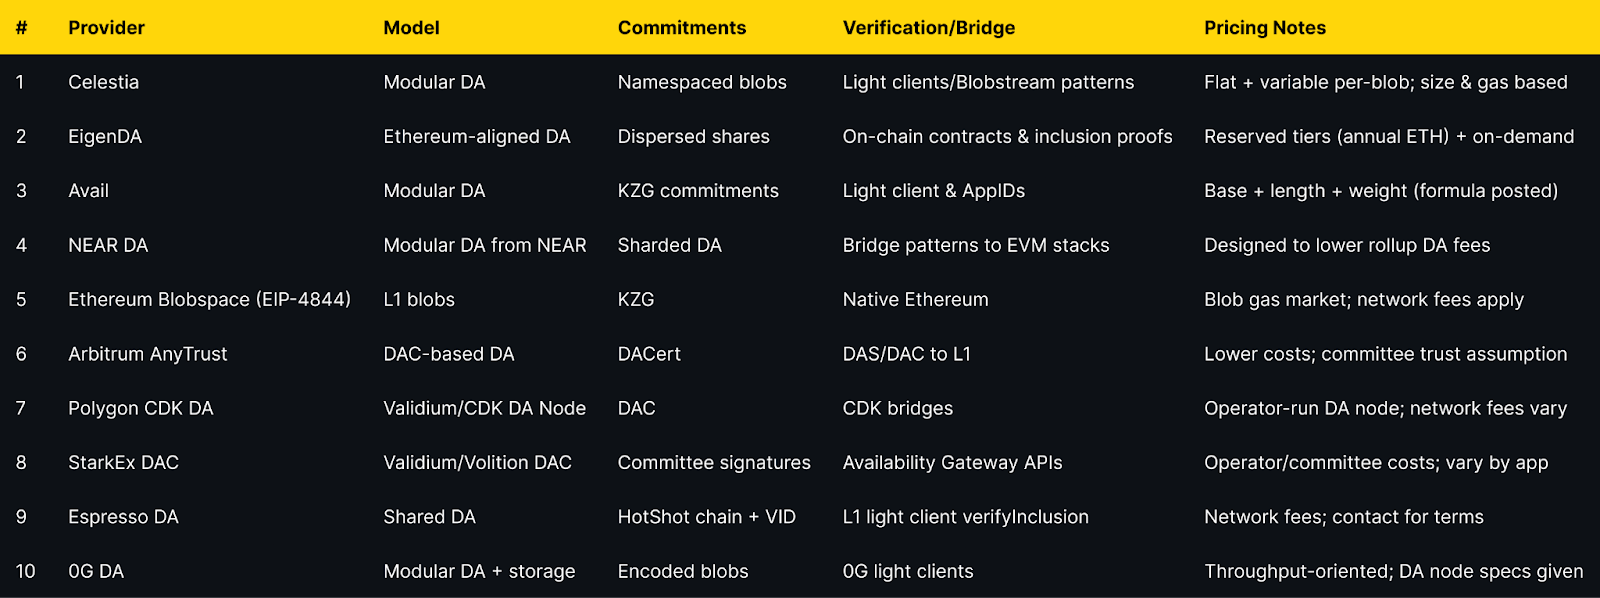


Top 10 Data Availability Layers in November 2025

1. Celestia — Best for modular DA at predictable blob economics

Why Use It. Celestia specializes in DA with namespaced blobs and data availability sampling. Fees are a flat transaction fee plus a variable component based on blob size, so costs scale with data posted rather than execution. Clear “PayForBlobs” guidance and explorers make planning straightforward. (blog.bcas.io)
Best For. OP Stack/sovereign rollups; teams optimizing DA cost; multi-chain deployments.
Notable Features. Namespaced blobs; fee market tied to blob size; tooling for PFB; docs on submitting and estimating fees. (Celestia Docs)
Fees Notes. Flat + variable per-blob; gas-price prioritized. (Celestia Docs)
Regions. Global (check validator/geography exposure in explorers).
Consider If. You want modular DA with transparent per-blob costs.
Alternatives. EigenDA, Avail.  

2. EigenDA — Best for high throughput with reserved bandwidth tiers

Why Use It. EigenDA is built on EigenLayer and offers mainnet DA with published reserved bandwidth tiers (annual ETH) and on-demand options. Strong alignment with Ethereum restaking and high advertised throughput. (docs.eigencloud.xyz)
Best For. High-throughput L2s; OP Stack/Orbit/CDK chains seeking cloud-grade throughput.
Notable Features. Reserved tiers (e.g., 512–2048 KiB/s and up), on-demand pricing updates, EigenLayer operator set. (eigenda.xyz)
Fees Notes. Reserved pricing in ETH per year; on-demand available. (eigenda.xyz)
Regions. Global.
Consider If. You want capacity commitments and Ethereum-aligned security.
Alternatives. Celestia, Avail.  

3. Avail — Best for dev-friendly docs and transparent fee formula

Why Use It. Avail provides DA with clear developer pathways (AppIDs, deploy rollups) and posts a fee formula: base + length + weight + optional tip. Guides include OP Stack and ZK Stack integrations. (docs.availproject.org)
Best For. Teams needing step-by-step deployment templates and cost modeling.
Notable Features. AppID model; OP Stack/Validium guides; fee components documented. (docs.availproject.org)
Fees Notes. Base + length + weight + optional tip; congestion multiplier. (docs.availproject.org)
Regions. Global.
Consider If. You want docs-first integration and a transparent pricing formula.
Alternatives. Celestia, EigenDA.  


4. NEAR Data Availability (NEAR DA) — Best for cost-reduction via NEAR’s sharded DA

Why Use It. NEAR modularizes its DA layer for external rollups, aiming to lower DA fees while leveraging its sharded architecture. Official materials target Ethereum rollups explicitly. (docs.near.org)
Best For. Rollups prioritizing low DA cost and sharded throughput.
Notable Features. Sharded DA; chain-abstraction docs; community implementations (e.g., Nuffle). (docs.near.org)
Fees Notes. Designed to reduce rollup DA cost; confirm network fees in docs. (NEAR)
Regions. Global.
Consider If. You want a low-cost DA path and EVM interoperability.
Alternatives. Avail, Celestia.


5. Ethereum Blobspace (EIP-4844) — Best for maximum L1 neutrality with ephemeral blobs

Why Use It. Post data to Ethereum blobs for protocol-level guarantees during the blob retention window (~18 days). Ideal for projects that want L1 alignment and can operate within ephemeral storage constraints and blob gas markets. (Ethereum Improvement Proposals)
Best For. Security-first teams preferring L1 attestation and ecosystem neutrality.
Notable Features. KZG commitments; ephemeral blob storage; native verification. (ethereum.org)
Fees Notes. Blob gas; variable by demand; L1 network fees apply. (ethereum.org)
Regions. Global.
Consider If. You accept blob retention limits and variable blob pricing.
Alternatives. Celestia, EigenDA.


6. Arbitrum AnyTrust (DAC) — Best for cost-optimized OP-style chains using a DAC

Why Use It. AnyTrust lowers costs by storing data with a Data Availability Committee and posting certificates on L1. Detailed runbooks exist for configuring DACs for Orbit chains. (docs.arbitrum.io)
Best For. Orbit chains and apps with mild trust assumptions for lower fees.
Notable Features. DACert flow; DAS; step-by-step DAC deployment docs. (docs.arbitrum.io)
Fees Notes. Lower posting costs; committee/infra costs vary. (docs.arbitrum.io)
Regions. Global (committee member distribution varies).
Consider If. You want cheaper DA and can trust a DAC quorum.
Alternatives. Polygon CDK DA, StarkEx DAC.


7. Polygon CDK Data Availability — Best for CDK chains wanting Validium-style DA

Why Use It. CDK chains can use a DA node and DAC approach for Validium-style costs, with official repos describing the CDK DA component. Best fit if you’re already on CDK and want DA flexibility. (polygon.technology)
Best For. Polygon CDK deployers; validium-first apps.
Notable Features. CDK DA node repo; DAC configuration; CDK ecosystem tooling. (GitHub)
Fees Notes. Operator/committee costs; network fees vary by setup. (polygon.technology)
Regions. Global.
Consider If. You need CDK-native DA with Validium trade-offs.
Alternatives. Arbitrum AnyTrust, EigenDA.


8. StarkEx Data Availability Committee — Best for Validium/Volition deployments needing DAC maturity

Why Use It. StarkEx supports Validium and Volition modes via a DAC with APIs (Availability Gateway) and reference implementations for committee nodes. Production-hardened across top apps. (docs.starkware.co)
Best For. High-volume ZK apps on StarkEx preferring low DA costs.
Notable Features. DAC reference code; Volition support; batch data APIs. (GitHub)
Fees Notes. Committee/infra costs; app-specific. (docs.starkware.co)
Regions. Global (committee selection per app).
Consider If. You accept DAC trust assumptions for cost savings.
Alternatives. Arbitrum AnyTrust, Polygon CDK DA.


9. Espresso DA — Best for shared DA paired with neutral sequencing

Why Use It. Espresso offers a shared DA with HotShot consensus and a light-client verifyInclusion function for on-chain verification, designed to interoperate with other DA choices if desired. (docs.espressosys.com)
Best For. Rollups adopting shared sequencing and wanting cheap DA.
Notable Features. HotShot consensus; three-layer DA architecture; flexible with other DAs. (L2BEAT)
Fees Notes. Network fees; contact providers/infrastructure partners for terms. (blockdaemon.com)
Regions. Global.
Consider If. You want shared sequencing + DA as a package.
Alternatives. EigenDA, Celestia.


10. 0G DA — Best for high-throughput apps (AI/gaming) needing DA + storage

Why Use It. 0G pairs a DA layer with a general-purpose storage system and provides DA node specs and runbooks. Positioned for high-volume data workloads and fast retrieval. (docs.0g.ai)
Best For. Data-heavy chains (AI, gaming) needing scalable DA and storage.
Notable Features. Encoded blob data; DA node specs; whitepaper architecture (DA atop storage). (GitHub)
Fees Notes. Throughput-oriented network; confirm current pricing with 0G. (0g.ai)
Regions. Global.
Consider If. You’re optimizing for data-heavy throughput and retrieval.
Alternatives. Celestia, Avail.


Decision Guide: Best By Use Case


How to Choose the Right Data Availability Layer (Checklist)

  • ☐ Region eligibility and any operator restrictions documented
  • ☐ Security model fits app (L1 blobs vs. modular DA vs. DAC)
  • ☐ Fee mechanics are explicit (blob gas, per-blob size, or formula)
  • ☐ Tooling and SDKs for your stack (OP Stack, CDK, ZK Stack)
  • ☐ Throughput/bandwidth and quotas published or contractually reserved
  • ☐ Observability: explorers, status pages, inclusion proofs/light clients
  • ☐ Clear guides for deployment and migration paths
  • ☐ Support channels and escalation (SLA/contacts)
  • Red flags: no official fee notes, opaque committees, or missing verification docs.

Use Token Metrics With Any Data Availability Layer

  • AI Ratings to screen assets by quality and momentum.
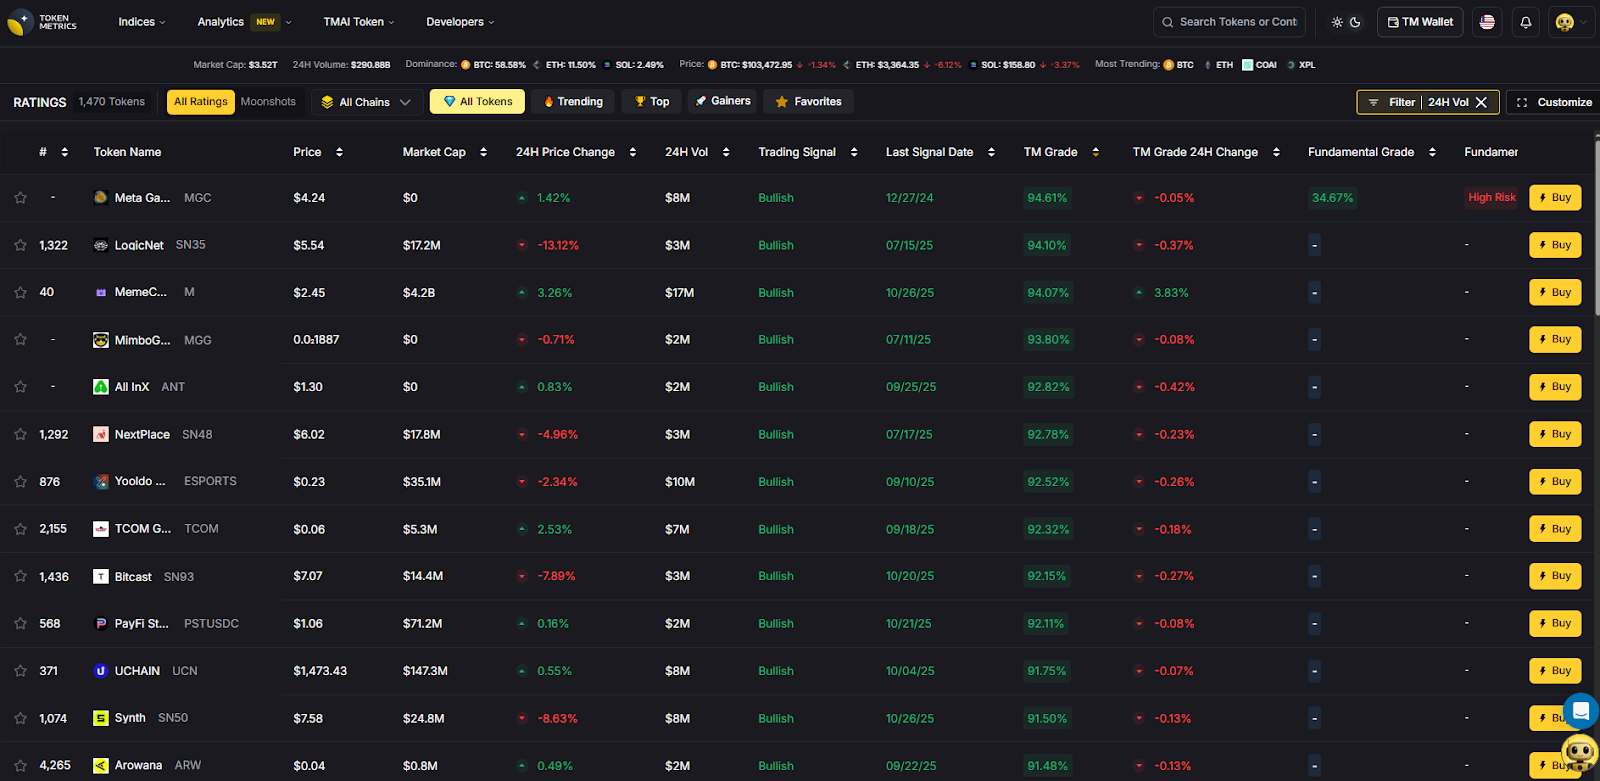
  

  • Narrative Detection to spot early theme shifts.
  • Portfolio Optimization to balance risk across chains.
  • Alerts & Signals to time entries/exits.
    Workflow: Research → Select DA → Launch rollup/appchain → Monitor with alerts.

Start free trial to screen assets and time entries with AI.  

Security & Compliance Tips

  • Run independent verification (light clients/inclusion proofs) where available.
  • For DACs, diversify committee members and publish membership changes.
  • Monitor quotas/latency; set fallbacks (e.g., switch DA mode where stack supports Alt-DA). (docs.optimism.io)
  • Validate official endpoints; beware of phishing and copycat docs.
  • Track fee spikes (blob gas, congestion multipliers) and set budget alarms. (ethereum.org)
  • Document upgrade paths and retention windows (e.g., blob expiry). (ethereum.org)

This article is for research/education, not financial advice.


Beginner Mistakes to Avoid

  • Treating DA choice as “set-and-forget” without monitoring fees and bandwidth.
  • Ignoring blob retention on Ethereum and assuming permanence. (ethereum.org)
  • Using a DAC without clear membership and recovery processes. (docs.arbitrum.io)
  • Skipping test deployments to measure real blob sizes and costs.
  • Overlooking verification UX (light clients/proofs) for end users.
  • Assuming all stacks support seamless DA switching without work. (docs.optimism.io)

How We Picked (Methodology & Scoring)

Scoring Weights (sum = 100): Liquidity/Scale 30, Security 25, Coverage 15, Costs 15, UX 10, Support 5.
We examined official docs for pricing/fees, security/verification, and deployment guides. We favored providers with explicit fee notes (formulas or tiers), clear verification models, and active ecosystem integrations. Last updated November 2025.


FAQs

What are data availability layers?
 They’re systems that publish rollup data so anyone can reconstruct state and verify proofs. They range from L1 blobs (Ethereum EIP-4844) to modular DA networks (Celestia, Avail) and DACs. (ethereum.org)

Are blobs on Ethereum permanent?
 No. Blob data is retained for a limited window (~18 days). If you need permanent access, you must snapshot or use a DA with different retention. (ethereum.org)

How do DA fees work?
 Fees vary: Celestia ties fees to blob size and gas; Avail publishes a base/length/weight formula; Ethereum blobs use a blob-gas market; EigenDA offers reserved bandwidth tiers. (Celestia Docs)

What’s a DAC and when should I use one?
 A Data Availability Committee stores data off-chain and posts certificates or signatures to L1. It’s cheaper but introduces committee trust assumptions. Used by Arbitrum AnyTrust, StarkEx/Volition, and CDK Validium. (docs.arbitrum.io)

Can OP Stack chains plug into alternative DA?
 Yes. OP Stack supports Alt-DA mode to integrate various DA layers. Validate trade-offs and tooling before switching. (docs.optimism.io)


Conclusion + Related Reads

If you want transparent per-blob costs and strong tooling, pick Celestia. For capacity commitments and Ethereum alignment, choose EigenDA. If you want a formula-based fee model with practical guides, Avail is compelling. DAC-based routes (AnyTrust, StarkEx, CDK) suit cost-sensitive apps comfortable with committee trust assumptions.

Related Reads (Token Metrics)

Build Smarter Crypto Apps &
AI Agents in Minutes, Not Months
Real-time prices, trading signals, and on-chain insights all from one powerful API.
Grab a Free API Key
About Token Metrics
Token Metrics: AI-powered crypto research and ratings platform. We help investors make smarter decisions with unbiased Token Metrics Ratings, on-chain analytics, and editor-curated “Top 10” guides. Our platform distills thousands of data points into clear scores, trends, and alerts you can act on.
30 Employees
analysts, data scientists, and crypto engineers
Daily Briefings
concise market insights and “Top Picks”
Transparent & Compliant
Sponsored ≠ Ratings; research remains independent
Want Smarter Crypto Picks—Free?
See unbiased Token Metrics Ratings for BTC, ETH, and top alts.
Thank you! Your submission has been received!
Oops! Something went wrong while submitting the form.
 No credit card | 1-click unsubscribe
Token Metrics Team
Token Metrics Team

Recent Posts

Research

Quantmetrics API: Measure Risk & Reward in One Call

Token Metrics Team
5

Most traders see price—quants see probabilities. The Quantmetrics API turns raw performance into risk-adjusted stats like Sharpe, Sortino, volatility, drawdown, and CAGR so you can compare tokens objectively and build smarter bots and dashboards. In minutes, you’ll query /v2/quantmetrics, render a clear performance snapshot, and ship a feature that customers trust. Start by grabbing your key at Get API Key, Run Hello-TM to verify your first call, then Clone a Template to go live fast.

What You’ll Build in 2 Minutes

  • A minimal script that fetches Quantmetrics for a token via /v2/quantmetrics (e.g., BTC, ETH, SOL).
  • A smoke-test curl you can paste into your terminal.
  • A UI pattern that displays Sharpe, Sortino, volatility, max drawdown, CAGR, and lookback window.

Next Endpoints to Add

  • /v2/tm-grade (one-score signal)
  • /v2/trading-signals
  • /v2/hourly-trading-signals (timing)
  • /v2/resistance-support (risk placement)
  • /v2/price-prediction (scenario planning)

Why This Matters

Risk-adjusted truth beats hype. Price alone hides tail risk and whipsaws. Quantmetrics compresses edge, risk, and consistency into metrics that travel across assets and timeframes—so you can rank universes, size positions, and communicate performance like a professional.

Built for dev speed

A clean REST schema, predictable latency, and easy auth mean you can plug Sharpe/Sortino into bots, dashboards, and screeners without maintaining your own analytics pipeline. Pair with caching and batching to serve fast pages at scale.

Where to Find

The Quant Metrics cURL request is located in the top right of the API Reference, allowing you to easily integrate it with your application.

Build Smarter Crypto Apps & AI Agents with Token Metrics

Token Metrics provides real-time prices, trading signals, and on-chain insights all from one powerful API. Grab a Free API Key

How It Works (Under the Hood)

Quantmetrics computes risk-adjusted performance over a chosen lookback (e.g., 30d, 90d, 1y). You’ll receive a JSON snapshot with core statistics:

  • Sharpe ratio: excess return per unit of total volatility.
  • Sortino ratio: penalizes downside volatility more than upside.
  • Volatility: standard deviation of returns over the window.
  • Max drawdown: worst peak-to-trough decline.
  • CAGR / performance snapshot: geometric growth rate and best/worst periods.

Call /v2/quantmetrics?symbol=<ASSET>&window=<LOOKBACK> to fetch the current snapshot. For dashboards spanning many tokens, batch symbols and apply short-TTL caching. If you generate alerts (e.g., “Sharpe crossed 1.5”), run a scheduled job and queue notifications to avoid bursty polling.

Production Checklist

  • Rate limits: Understand your tier caps; add client-side throttling and queues.
  • Retries & backoff: Exponential backoff with jitter; treat 429/5xx as transient.
  • Idempotency: Prevent duplicate downstream actions on retried jobs.
  • Caching: Memory/Redis/KV with short TTLs; pre-warm popular symbols and windows.
  • Batching: Fetch multiple symbols per cycle; parallelize carefully within limits.
  • Error catalog: Map 4xx/5xx to clear remediation; log request IDs for tracing.
  • Observability: Track p95/p99 latency and error rates; alert on drift.
  • Security: Store API keys in secrets managers; rotate regularly.

Use Cases & Patterns

  • Bot Builder (Headless): Gate entries by Sharpe ≥ threshold and drawdown ≤ limit, then trigger with /v2/trading-signals; size by inverse volatility.
  • Dashboard Builder (Product): Add a Quantmetrics panel to token pages; allow switching lookbacks (30d/90d/1y) and export CSV.
  • Screener Maker (Lightweight Tools): Top-N by Sortino with filters for volatility and sector; add alert toggles when thresholds cross.
  • Allocator/PM Tools: Blend CAGR, Sharpe, drawdown into a composite score to rank reallocations; show methodology for trust.
  • Research/Reporting: Weekly digest of tokens with Sharpe ↑, drawdown ↓, and volatility ↓.

Next Steps

  • Get API Key — start free and generate a key in seconds.
  • Run Hello-TM — verify your first successful call.
  • Clone a Template — deploy a screener or dashboard today.
  • Watch the demo: VIDEO_URL_HERE
  • Compare plans: Scale with API plans.

FAQs

1) What does the Quantmetrics API return?

A JSON snapshot of risk-adjusted metrics (e.g., Sharpe, Sortino, volatility, max drawdown, CAGR) for a symbol and lookback window—ideal for ranking, sizing, and dashboards.

2) How fresh are the stats? What about latency/SLOs?

Responses are engineered for predictable latency. For heavy UI usage, add short-TTL caching and batch requests; for alerts, use scheduled jobs or webhooks where available.

3) Can I use Quantmetrics to size positions in a live bot?

Yes—many quants size inversely to volatility or require Sharpe ≥ X to trade. Always backtest and paper-trade before going live; past results are illustrative, not guarantees.

4) Which lookback window should I choose?

Short windows (30–90d) adapt faster but are noisier; longer windows (6–12m) are steadier but slower to react. Offer users a toggle and cache each window.

5) Do you provide SDKs or examples?

REST is straightforward (JS/Python above). Docs include quickstarts, Postman collections, and templates—start with Run Hello-TM.

6) Polling vs webhooks for quant alerts?

Dashboards usually use cached polling. For threshold alerts (e.g., Sharpe crosses 1.0), run scheduled jobs and queue notifications to keep usage smooth and idempotent.

7) Pricing, limits, and enterprise SLAs?

Begin free and scale up. See API plans for rate limits and enterprise SLA options.

Disclaimer

All information provided in this blog is for educational purposes only. It is not intended as financial advice. Users should perform their own research and consult with licensed professionals before making any investment or trading decisions.

Research

Crypto Trading Signals API: Put Bullish/Bearish Calls Right in Your App

Token Metrics Team
4

Timing makes or breaks every trade. The crypto trading signals API from Token Metrics lets you surface bullish and bearish calls directly in your product—no spreadsheet wrangling, no chart gymnastics. In this guide, you’ll hit the /v2/trading-signals endpoint, display actionable signals on a token (e.g., SOL, BTC, ETH), and ship a conversion-ready feature for bots, dashboards, or Discord. Start by creating a key on Get API Key, then Run Hello-TM and Clone a Template to go live fast.

What You’ll Build in 2 Minutes

  • A minimal script that fetches Trading Signals via /v2/trading-signals for one symbol (e.g., SOL).
  • A copy-paste curl to smoke-test your key.
  • A UI pattern to render signal, confidence/score, and timestamp in your dashboard or bot.

Endpoints to add next

  • /v2/hourly-trading-signals (intraday updates)
  • /v2/resistance-support (risk placement)
  • /v2/tm-grade (one-score view)
  • /v2/quantmetrics (risk/return context)

Why This Matters

Action over analysis paralysis. Traders don’t need more lines on a chart—they need an opinionated call they can automate. The trading signals API compresses technical momentum and regime reads into Bullish/Bearish events you can rank, alert on, and route into strategies.

Built for dev speed and reliability. A clean schema, predictable performance, and straightforward auth make it easy to wire signals into bots, dashboards, and community tools. Pair with short-TTL caching or webhooks to minimize polling and keep latency low.

Where to Find

You can find the cURL request for Crypto Trading Signals in the top right corner of the API Reference. Use it to access the latest signals!

Live Demo & Templates

  • Trading Bot Starter: Use Bullish/Bearish calls to trigger paper trades; add take-profit/stop rules with Support/Resistance.
  • Dashboard Signal Panel: Show the latest call, confidence, and last-updated time; add a history table for context.
  • Discord/Telegram Alerts: Post signal changes to a channel with a link back to your app.

How It Works (Under the Hood)

Trading Signals distill model evidence (e.g., momentum regimes and pattern detections) into Bullish or Bearish calls with metadata such as confidence/score and timestamp. You request /v2/trading-signals?symbol=<ASSET> and render the most recent event, or a small history, in your UI.

For intraday workflows, use /v2/hourly-trading-signals to update positions or alerts more frequently. Dashboards typically use short-TTL caching or batched fetches; headless bots lean on webhooks, queues, or short polling with backoff to avoid spiky API usage.

Production Checklist

  • Rate limits: Know your tier caps; add client-side throttling and queues.
  • Retries/backoff: Exponential backoff with jitter; treat 429/5xx as transient.
  • Idempotency: Guard downstream actions (don’t double-trade on retries).
  • Caching: Memory/Redis/KV with short TTLs for reads; pre-warm popular symbols.
  • Webhooks & jobs: Prefer webhooks or scheduled workers for signal change alerts.
  • Pagination/Bulk: Batch symbols; parallelize with care; respect limits.
  • Error catalog: Map common 4xx/5xx to clear fixes; log request IDs.
  • Observability: Track p95/p99 latency, error rate, and alert delivery success.
  • Security: Keep keys in a secrets manager; rotate regularly.

Use Cases & Patterns

  • Bot Builder (Headless): Route Bullish into candidate entries; confirm with /v2/resistance-support for risk and TM Grade for quality.
  • Dashboard Builder (Product): Add a “Signals” module per token; color-code state and show history for credibility.
  • Screener Maker (Lightweight Tools): Filter lists by Bullish state; sort by confidence/score; add alert toggles.
  • Community/Discord: Post signal changes with links to token pages; throttle to avoid noise.
  • Allocator/PM Tools: Track signal hit rates by sector/timeframe to inform position sizing (paper-trade first).

Next Steps

  1. Get API Key — create a key and start free.
  2. Run Hello-TM — confirm your first successful call.
  3. Clone a Template — deploy a bot, dashboard, or alerting tool today.

FAQs

1) What does the Trading Signals API return?

A JSON payload with the latest Bullish/Bearish call for a symbol, typically including a confidence/score and generated_at timestamp. You can render the latest call or a recent history for context.

2) Is it real-time? What about latency/SLOs?

Signals are designed for timely, programmatic use with predictable latency. For faster cycles, use /v2/hourly-trading-signals. Add caching and queues/webhooks to reduce round-trips.

3) Can I use the signals in a live trading bot?

Yes—many developers do. A common pattern is: Signals → candidate entry, Support/Resistance → stop/targets, Quantmetrics → risk sizing. Always backtest and paper-trade before going live.

4) How accurate are the signals?

Backtests are illustrative, not guarantees. Treat signals as one input in a broader framework with risk controls. Evaluate hit rates and drawdowns on your universe/timeframe.

5) Do you provide SDKs and examples?

You can integrate via REST using JavaScript and Python snippets above. The docs include quickstarts, Postman collections, and templates—start with Run Hello-TM.

6) Polling vs webhooks for alerts?

Dashboards often use cached polling. For bots/alerts, prefer webhooks or scheduled jobs and keep retries idempotent to avoid duplicate trades or messages.

7) Pricing, limits, and enterprise SLAs?

Begin free and scale as you grow. See API plans for allowances; enterprise SLAs and support are available.

Research

Fundamental Grade Crypto API: Real Crypto Fundamentals in One Score

Token Metrics Team
3

Most traders chase price action; Fundamental Grade Crypto API helps you see the business behind the token—community traction, tokenomics design, exchange presence, VC signals, and DeFi health—consolidated into one score you can query in code. In a few minutes, you’ll fetch Fundamental Grade, render it in your product, and ship a due-diligence UX that drives trust. Start by grabbing your key at the Get API Key page, Run Hello-TM to verify your first call, then Clone a Template to go live fast.

What You’ll Build in 2 Minutes

A minimal script to fetch Fundamental Grade from /v2/fundamental-grade for any symbol (e.g., BTC).

  • Optional curl to smoke-test your key in seconds.
  • A drop-in pattern to display the grade + key drivers in dashboards, screeners, and research tools.

Endpoints to consider next

  • /v2/tm-grade (technical/sentiment/momentum)
  • /v2/price-prediction (scenario planning)
  • /v2/resistance-support (risk levels)
  • /v2/quantmetrics (risk/return stats)

Why This Matters

Beyond price, toward quality. Markets are noisy—hype rises and fades. Fundamental Grade consolidates hard-to-track signals (community growth, token distribution, liquidity venues, investor quality, DeFi integrations) into a clear, comparable score. You get a fast “is this worth time and capital?” answer for screening, allocation, and monitoring.

Build trust into your product. Whether you run an investor terminal, exchange research tab, or a portfolio tool, Token Metrics discovery helps users justify positions. Pair it with TM Grade or Quantmetrics for a balanced picture: what to buy (fundamentals) and when to act (signals/levels).

Where to Find

The Fundamental Grade is easily accessible in the top right of the API Reference. Grab the cURL request for seamless access!

Ready to build?

  • Get API Key — generate a key and start free.
  • Run Hello-TM — verify your first successful call.
  • Clone a Template — deploy a screener or token page today.

Watch the demo: VIDEO_URL_HERE. Compare plans: Scale confidently with API plans.

FAQs

1) What does the Fundamental Grade API return?

A JSON payload with the overall score/grade plus component scores (e.g., community, tokenomics, exchange presence, VC backing, DeFi health) and timestamps. Use the overall grade for ranking and component scores for explanations.

2) How fast is the endpoint? Do you publish SLOs?

The API is engineered for predictable latency. For high-traffic dashboards, add short-TTL caching and batch requests; for alerts, use jobs/webhooks to minimize round-trips.

3) Can I combine Fundamental Grade with TM Grade or signals?

Yes. A common pattern is Fundamental Grade for quality filter + TM Grade for technical/sentiment context + Trading Signals for timing and Support/Resistance for risk placement.

4) How “accurate” is the grade?

It’s an opinionated synthesis of multiple inputs—not financial advice. Historical studies can inform usage, but past performance doesn’t guarantee future results. Always layer risk management and testing.

5) Do you offer SDKs and examples?

You can use REST directly (see JS/Python above). The docs include quickstarts, Postman, and ready-to-clone templates—start with Run Hello-TM.

6) Polling vs webhooks for fundamentals updates?

For UI pages, cached polling works well. For event-style notifications (upgrades/downgrades), prefer webhooks or scheduled jobs to avoid spiky traffic.

7) What about pricing, limits, and enterprise SLAs?

Begin free and scale as you grow. See API plans for allowances; enterprise SLAs and support are available—contact us.

Choose from Platinum, Gold, and Silver packages
Reach with 25–30% open rates and 0.5–1% CTR
Craft your own custom ad—from banners to tailored copy
Perfect for Crypto Exchanges, SaaS Tools, DeFi, and AI Products