Back to blog
Research

Top On and Off-Ramp Providers (Fiat to Crypto) 2025

Compare the best crypto on/off-ramp providers for 2025—coverage, costs, and compliance. Pick the right ramp for your region and rails.
Sam Monac
5 min
Want Smarter Crypto Picks—Free?
See unbiased Token Metrics Ratings for BTC, ETH, and top alts.
Thank you! Your submission has been received!
Oops! Something went wrong while submitting the form.
 No credit card | 1-click unsubscribe

Why Fiat ↔ Crypto On/Off-Ramps Matter in September 2025

Getting money into and out of crypto should be fast, safe, and compliant. In 2025, wallets, dapps, exchanges, and fintechs increasingly rely on crypto on/off-ramp providers to convert fiat to tokens and cash back out to bank rails—all without forcing users to bounce between apps. Definition: an on-ramp lets users buy crypto with fiat; an off-ramp lets them sell crypto back to fiat and withdraw to bank accounts or cards. This guide is for product leaders, devs, and advanced users comparing coverage, fees, and risk controls across global options. We score providers on liquidity, security, asset/market coverage, costs, UX, and support, then recommend the best fits by use case. Secondary angles we considered: fiat to crypto onramp, crypto off-ramp, and common flows like “buy crypto with bank transfer.”

How We Picked (Methodology & Scoring)

  • Liquidity (30%) – depth, uptime, and quote quality across assets/fiat rails.

  • Security (25%) – audits, certifications, KYC/AML controls, trust center disclosures.

  • Coverage (15%) – supported countries, payment methods, off-ramp payout rails.

  • Costs (15%) – transparent fees/spreads; promos (e.g., USDC zero-fee tiers).

  • UX (10%) – speed (KYC/settlement), embeddable widgets, developer docs.

  • Support (5%) – docs, SLAs, live support, incident comms.

Data sources: official product/docs and security pages; licensing and disclosures; limited cross-checks with widely cited market datasets. We only link to official provider sites in this article. Last updated September 2025.

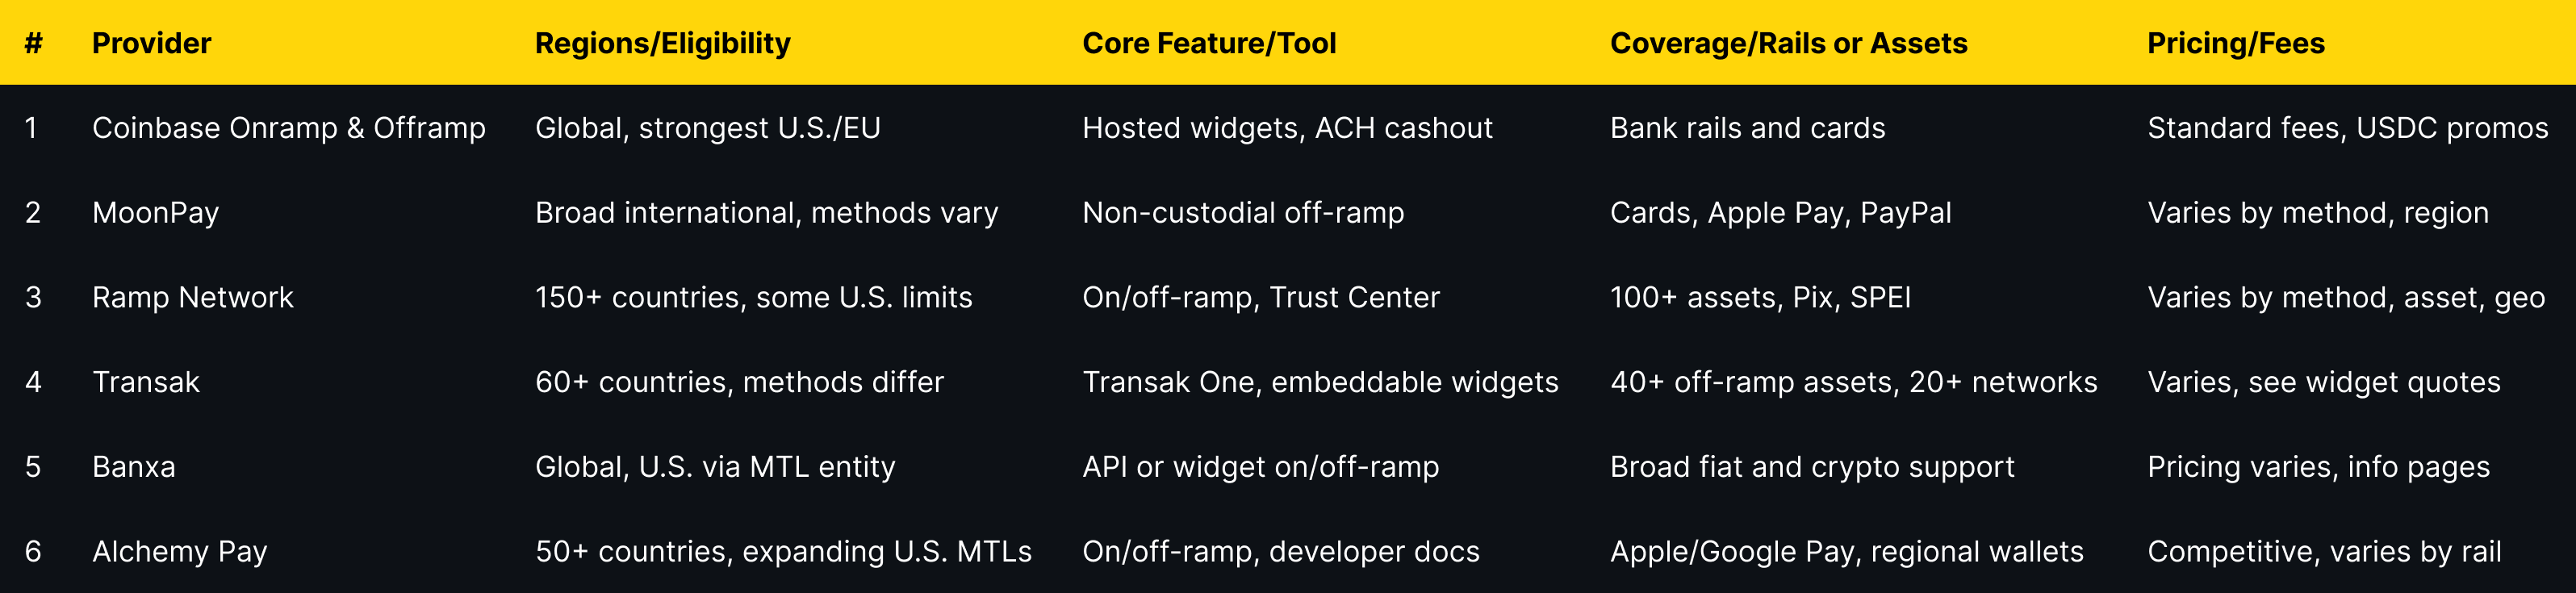
Top 10 Fiat ↔ Crypto On/Off-Ramp Providers in September 2025

1. Coinbase Onramp & Offramp — Best for USDC flows & regulated U.S./EU coverage

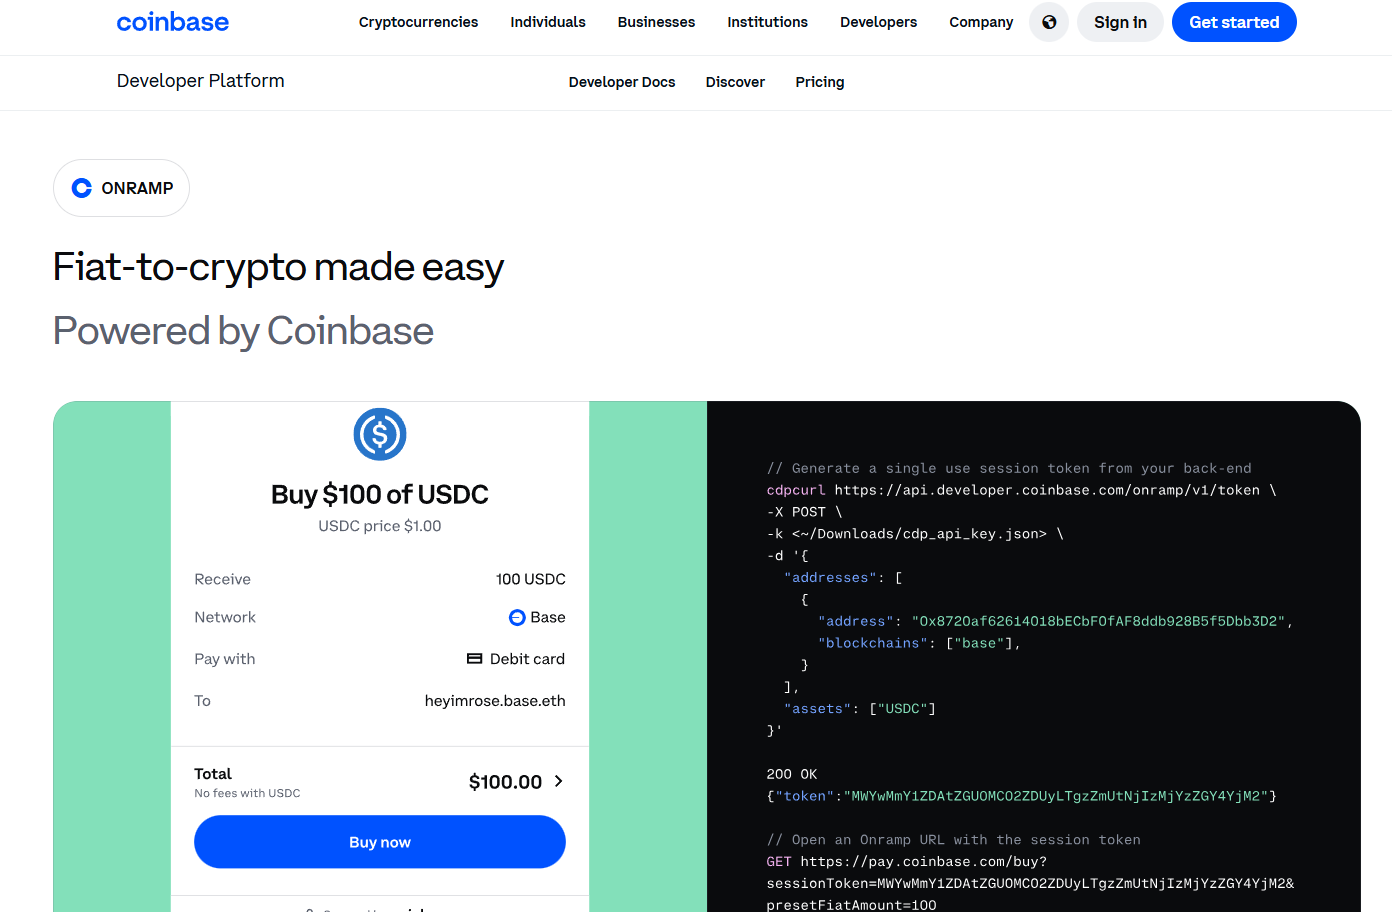
  • Why Use It: Coinbase’s hosted Onramp and Offramp APIs let you embed buy/sell with bank rails and cards, including ACH cashouts, inside your app. Select apps can access zero-fee USDC onramp/offramp promotions and free USDC on Base. Coinbase+2Coinbase+2

  • Best For: U.S./EU wallets & dapps, consumer fintechs, apps prioritizing compliance.

  • Notable Features: hosted widgets; guest checkout for US (no account up to limits); ACH cashout; strong docs & SDKs. Coinbase Developer Docs

  • Fees Notes: Standard fees vary by method; USDC promos may apply. Coinbase

  • Regions: Global reach with strongest support in U.S./EU; method availability varies. Coinbase Developer Docs

  • Consider If: You need a turnkey, regulated option with ACH off-ramp.

  • Alternatives: MoonPay, Ramp Network.

2. MoonPay — Best for non-custodial UX & card coverage

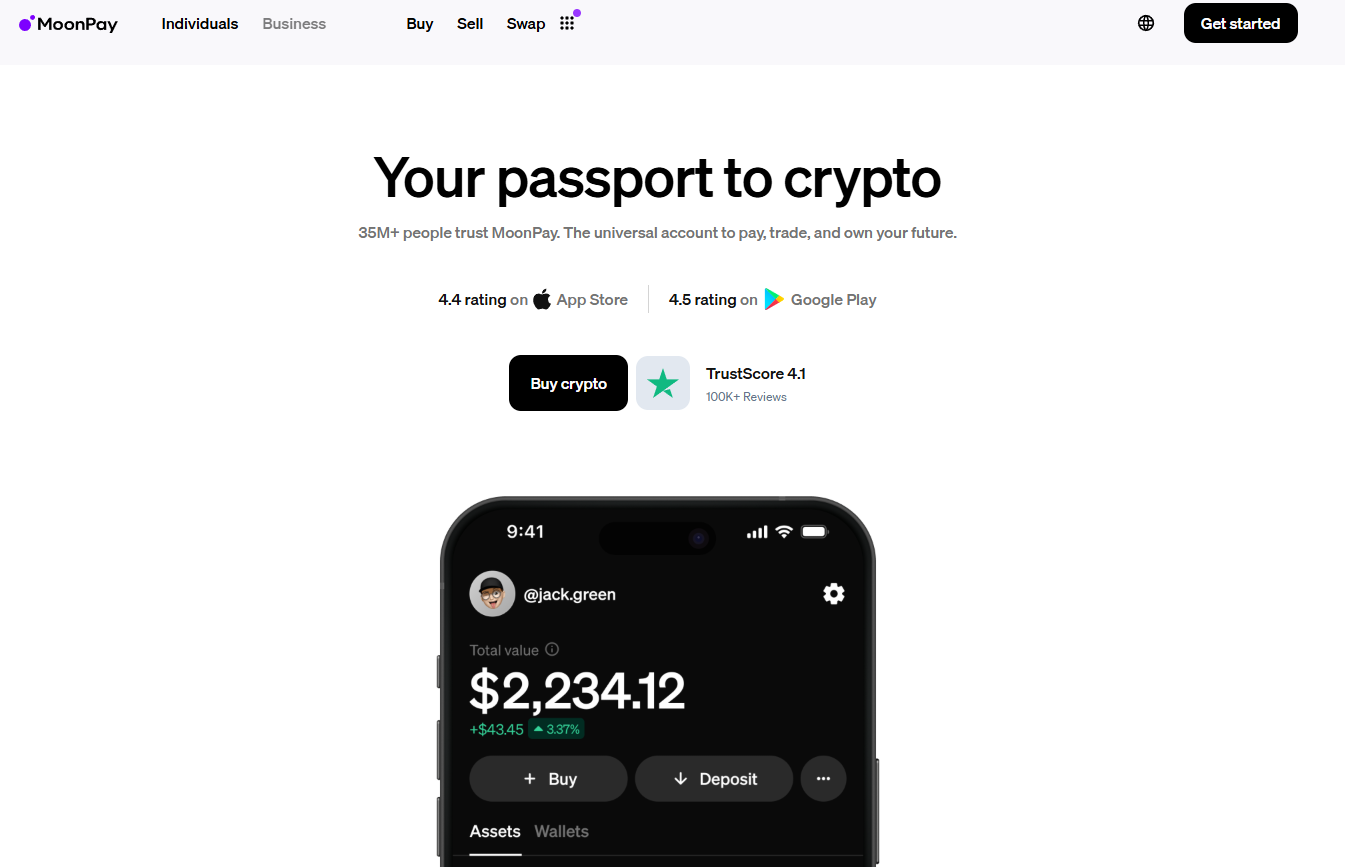
  • Why Use It: MoonPay offers fast card/Apple Pay/PayPal buys and a non-custodial off-ramp, letting users sell crypto while keeping control of keys. Good fit for wallets and NFT apps that want an embedded flow. MoonPay+1

  • Best For: Self-custody wallets, NFT marketplaces, global card-first audiences.

  • Notable Features: Onramp + off-ramp; non-custodial design; quick card settlement. MoonPay+1

  • Fees Notes: Varies by payment method and region.

  • Regions: Broad international availability; local method support varies.

  • Consider If: You want non-custodial off-ramp with strong card acceptance.

  • Alternatives: Transak, Banxa.

3. Ramp Network — Best for global coverage + fast KYC

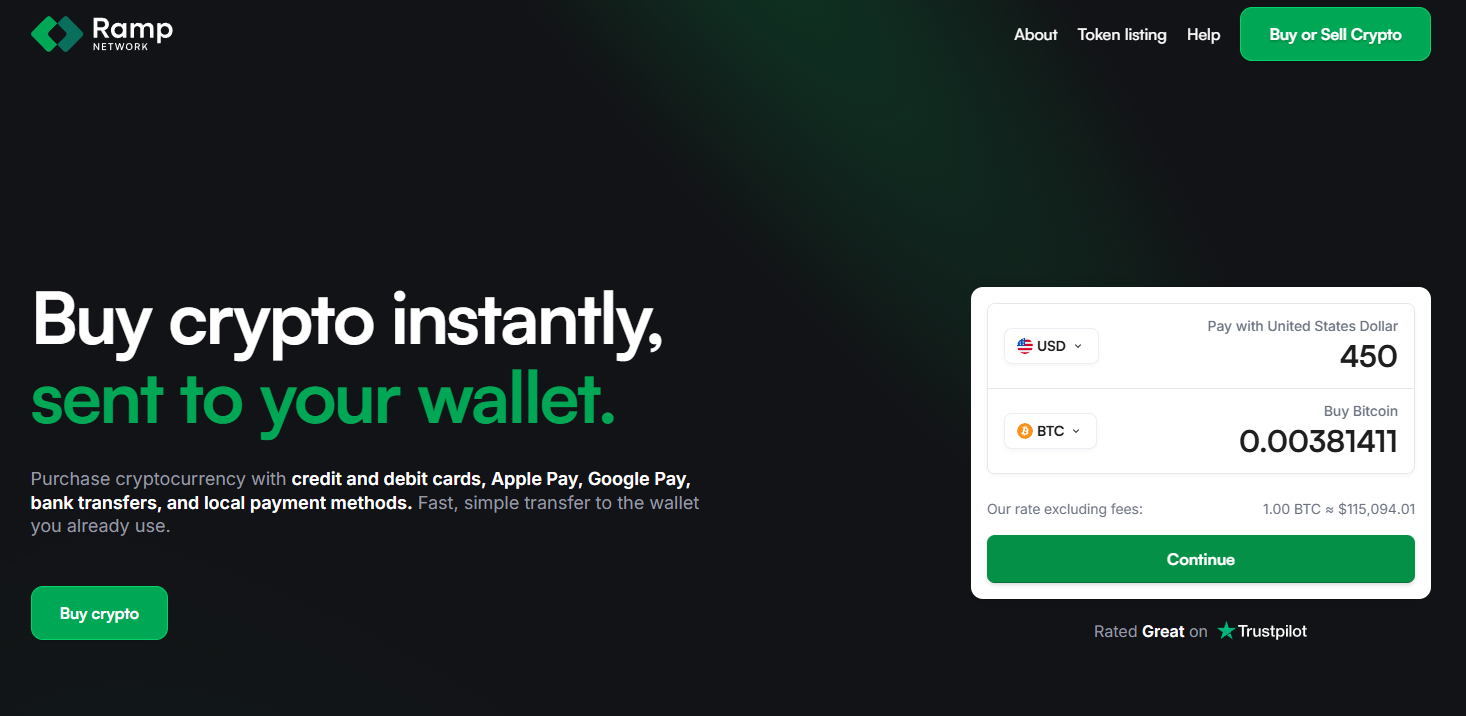
  • Why Use It: Ramp supports 100+ assets and multiple local rails (cards, bank transfers, Pix, SPEI) with fast, document-free KYC in eligible markets and SOC/ISO certifications published via its Trust Center. rampnetwork.com+2ramp.network+2

  • Best For: Wallets/dapps needing wide country coverage and quick onboarding.

  • Notable Features: On & off-ramp; 100+ assets; local rails incl. Pix & SPEI payouts; strong security disclosures. ramp.network+1

  • Fees Notes: Vary by method, asset, and geography.

  • Regions: 150+ countries; some U.S. states support on-ramp only (no off-ramp). support.rampnetwork.com

  • Consider If: You want breadth plus local rails in LATAM/EU.

  • Alternatives: Transak, Alchemy Pay.

4. Transak — Best for developer tooling & hybrid use cases

  • Why Use It: Transak offers on/off-ramp coverage (40+ off-ramp assets across 20+ networks) with over 64+ supported countries and Transak One to let users fund complex actions (e.g., stake/bridge) from fiat in one flow. Transak Docs+2Transak+2

  • Best For: Developers needing a broad, configurable integration; DeFi apps.

  • Notable Features: Off-ramp to bank; multi-network coverage; business (corporate) on/off-ramp; embeddable widgets. Transak+1

  • Fees Notes: Vary by method; see widget quotes.

  • Regions: 60+ countries; payment methods differ by market. Transak

  • Consider If: You need both retail and corporate on/off-ramp options.

  • Alternatives: Ramp Network, Banxa.

5. Banxa — Best for compliance-heavy enterprise & deep licensing

  • Why Use It: Banxa emphasizes regulated operations with published USA MTL and global license lists, plus enterprise-grade AML/CTF and security disclosures. Strong for partners who need extensive compliance artifacts. Banxa+2Banxa+2

  • Best For: Enterprises, wallets, and exchanges with strict compliance needs.

  • Notable Features: On/off-ramp via API/widget; broad fiat/crypto support; license/AML pages; developer SDKs. Banxa+1

  • Fees Notes: Pricing varies; transparent info pages provided. Banxa

  • Regions: Global (entity-specific); U.S. coverage via MTL entity; details in license PDFs. Banxa

  • Consider If: Your risk/compliance teams require detailed attestations.

  • Alternatives: Zero Hash, Transak.

6. Alchemy Pay — Best for emerging markets & alternative wallets

  • Why Use It: Alchemy Pay bridges fiat and crypto with on/off-ramp across 50+ countries (and expanding), focusing on emerging markets and a wide range of local wallets/payments. It’s actively growing U.S. coverage via new MTLs (e.g., Arizona, South Carolina). docs+2alchemypay.org+2

  • Best For: Dapps targeting emerging markets; global apps needing local wallets.

  • Notable Features: On/off-ramp; Apple/Google Pay & regional wallets; developer docs; business flows. alchemypay.org

  • Fees Notes: Competitive, vary by payment rail.

  • Regions: Global (check country list); growing U.S. state coverage via MTLs. alchemypay.org

  • Consider If: You prioritize local payment methods in APAC/LATAM.

  • Alternatives: Transak, Ramp Network.

7. Kraken — Best regulated exchange on/off-ramp (U.S./EU)

  • Why Use It: Kraken provides fiat funding and withdrawals in USD/EUR/CAD with ACH, SEPA, and card rails, offering a straightforward path to buy/sell and cash out to bank. Useful if you want exchange liquidity plus strong support docs. Kraken+1

  • Best For: Traders and users who prefer exchange-native fiat rails.

  • Notable Features: ACH deposits (no fee for many U.S. clients), cash withdrawals, app guides. Kraken+2Kraken Support+2

  • Fees Notes: Funding/withdrawal fees and holds depend on method (e.g., ACH hold windows). Kraken Support

  • Regions: U.S./EU/Canada; ACH account linking not available in NY, WA, TX. Kraken

  • Consider If: You want deep orderbook liquidity alongside fiat rails.

  • Alternatives: Bitstamp, Coinbase.

8. Bitstamp — Best for EU banking rails & stable UX

  • Why Use It: One of the longest-running exchanges, Bitstamp supports bank deposits (SEPA/International, ACH) and card purchases, plus fiat withdrawals to bank accounts. Simple, well-documented flows are ideal for EU and U.S. users wanting a clean on/off-ramp. Bitstamp+2Bitstamp+2

  • Best For: EU users; U.S. users comfortable with exchange-based cashouts.

  • Notable Features: ACH deposits/withdrawals, SEPA (incl. Instant SEPA), card & Apple/Google Pay availability. Bitstamp+2Bitstamp+2

  • Fees Notes: See Bitstamp fee schedule; varies by method. Bitstamp

  • Regions: EU/UK/US (availability by method).

  • Consider If: You want familiar exchange UX with established bank rails.

  • Alternatives: Kraken, Coinbase.

9. Stripe Crypto Onramp — Best embeddable onramp for U.S./EU apps

  • Why Use It: Stripe’s fiat-to-crypto onramp is a customizable widget/hosted flow you can embed in wallets, NFT apps, and dapps—Stripe handles KYC, fraud, and payments. Ideal for teams already on Stripe. Note: onramp availability is U.S. (excl. Hawaii) + EU. Stripe Docs+2Stripe Docs+2

  • Best For: U.S./EU dapps and platforms standardizing on Stripe.

  • Notable Features: Embedded or hosted onramp; identity & fraud tooling; stablecoin payout stack. Stripe Docs

  • Fees Notes: Stripe pricing applies; quotes shown in onramp UI.

  • Regions: U.S. (minus HI) and EU currently. Stripe Docs

  • Consider If: You need a polished onramp (no off-ramp) with Stripe stack.

  • Alternatives: Coinbase Onramp, MoonPay.

10. Zero Hash — Best turnkey B2B infrastructure (regulated build-out)

  • Why Use It: Zero Hash powers on/off-ramp for enterprises, abstracting licensing and regulatory complexity. B2B partners can convert between fiat and 60+ crypto assets, with quote controls and payout rails. zerohash.com+1

  • Best For: Fintechs, banks, and platforms embedding compliant crypto.

  • Notable Features: API-first; short path to market; configurable quotes; bank payouts. docs.zerohash.com

  • Fees Notes: Enterprise pricing; volume-based.

  • Regions: Coverage varies by solution and jurisdiction.

  • Consider If: You need compliance + infra rather than a retail widget.

  • Alternatives: Banxa, Coinbase (developer).

Decision Guide: Best By Use Case

How to Choose the Right Fiat ↔ Crypto On/Off-Ramp (Checklist)

  • Confirm region & method eligibility (ACH/SEPA/cards; off-ramp availability by country/state).

  • Check asset/fiat coverage for your top flows (BTC, ETH, stablecoins, local fiat).

  • Review security posture (SOC/ISO, trust center, KYC/AML, sanctions screening). Ramp

  • Compare fees & spreads (and promos like zero-fee USDC) and settlement speeds. Coinbase

  • Validate developer experience (docs, hosted vs. embedded, SDKs). Coinbase

  • Ensure support & SLAs meet your needs (status pages, incident comms).

  • Red flags: unclear licensing, no security disclosures, or “global” claims without a country/method matrix.

Use Token Metrics With Any On/Off-Ramp

  • AI Ratings: Screen top assets before you convert.
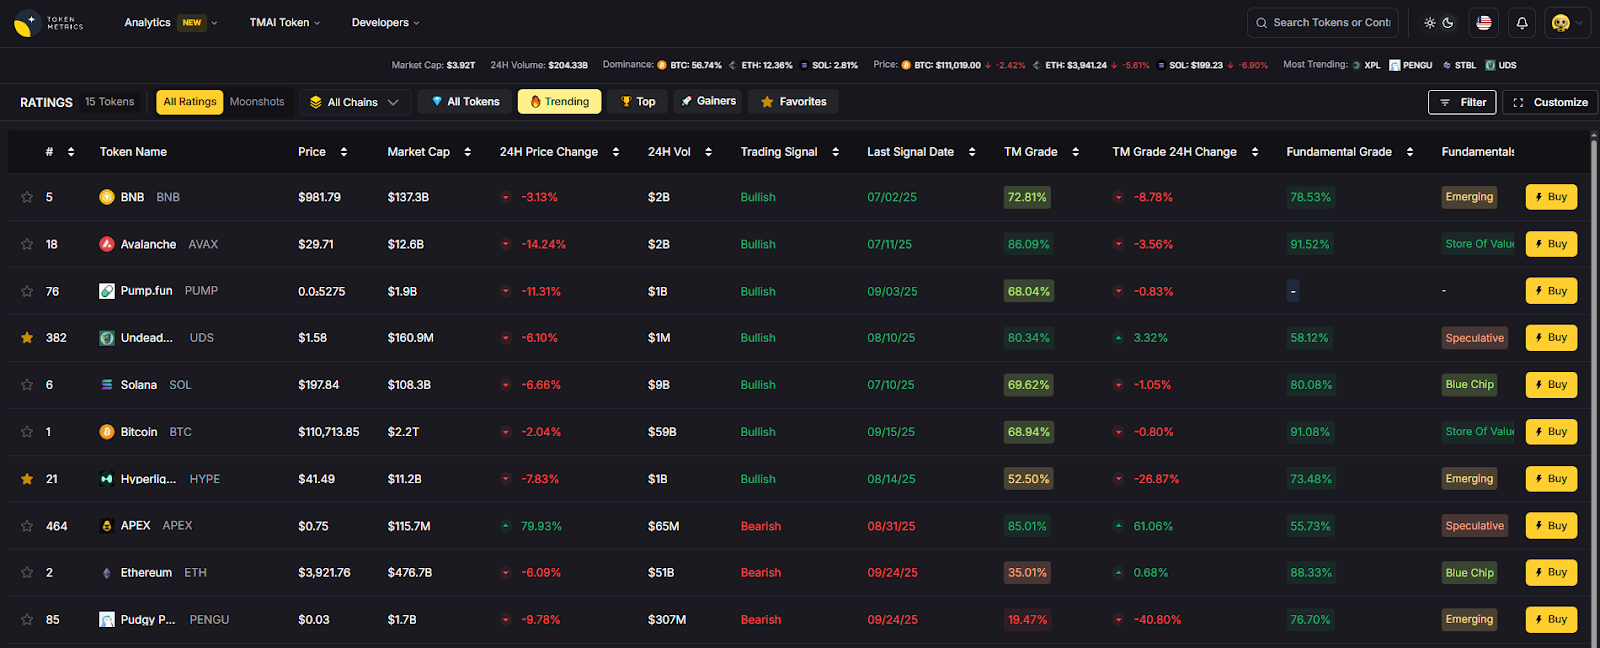
  • Narrative Detection: Spot sector momentum early.

  • Portfolio Optimization: Size positions to risk.

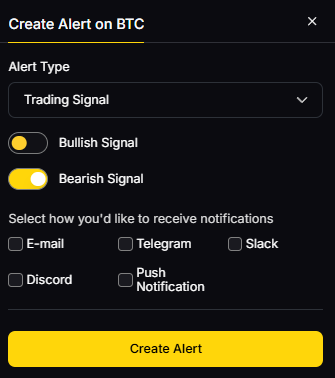
  • Alerts/Signals: Get entries/exits without screen-watching.
    Workflow: Research → Select ramp → Execute buy/sell → Monitor with alerts.


Primary CTA: Start free trial 

Security & Compliance Tips

  • Enable 2FA and use strong unique passwords.

  • Separate custody (self-custody vs. exchange) from ramp accounts as needed.

  • Follow KYC/AML requirements; prepare source-of-funds docs for higher limits.

  • For OTC/RFQ flows, lock quotes and confirm fees before sending. docs.zerohash.com

  • Maintain wallet hygiene: test transfers, verify addresses, track gas/fees.

This article is for research/education, not financial advice.

Beginner Mistakes to Avoid

  • Assuming a provider supports both on- and off-ramp in your country (often not true). support.rampnetwork.com

  • Ignoring ACH hold windows or payout timings when planning cashouts. Kraken Support

  • Overlooking fees/spreads vs. headline “no fee” promos. Coinbase

  • Embedding an onramp without sandbox/testing error states.

  • Not checking licensing & security disclosures before integration. Banxa+1

FAQs

What is a crypto on-ramp vs. off-ramp?
An on-ramp lets users buy crypto with fiat (e.g., card, bank transfer). An off-ramp lets users sell crypto for fiat and withdraw to bank rails or cards. Coinbase

Which providers are best for U.S. ACH cashouts?
Coinbase Offramp and Kraken both support ACH, with method availability depending on state and account status. Coinbase Developer Docs+1

Does Stripe support off-ramp?
Stripe currently offers a fiat-to-crypto onramp (no off-ramp). It’s available in the U.S. (excluding Hawaii) and EU. Stripe Docs

Which options are strongest outside the U.S.?
For broad coverage and local rails, consider Ramp Network (Pix/SPEI), Transak (multi-network off-ramp), and Alchemy Pay (regional wallets). ramp.network+2Transak Docs+2

What about enterprise-grade compliance?
Banxa and Zero Hash publish license/compliance docs and are built for B2B integrations with higher assurance requirements. Banxa+1

Conclusion + Related Reads

The best choice depends on your region, payout rails, and risk posture. If you want a regulated U.S. ACH flow with strong docs, start with Coinbase. Need global coverage and local methods? Ramp, Transak, and Alchemy Pay shine. For enterprise and bank-grade requirements, Banxa and Zero Hash are strong bets. Exchange-based ramps via Kraken or Bitstamp work well if you also need deep liquidity.

Related Reads:

  • Best Cryptocurrency Exchanges 2025

  • Top Derivatives Platforms 2025

  • Top Institutional Custody Providers 2025

Build Smarter Crypto Apps &
AI Agents in Minutes, Not Months
Real-time prices, trading signals, and on-chain insights all from one powerful API.
Grab a Free API Key
About Token Metrics
Token Metrics: AI-powered crypto research and ratings platform. We help investors make smarter decisions with unbiased Token Metrics Ratings, on-chain analytics, and editor-curated “Top 10” guides. Our platform distills thousands of data points into clear scores, trends, and alerts you can act on.
30 Employees
analysts, data scientists, and crypto engineers
Daily Briefings
concise market insights and “Top Picks”
Transparent & Compliant
Sponsored ≠ Ratings; research remains independent
Want Smarter Crypto Picks—Free?
See unbiased Token Metrics Ratings for BTC, ETH, and top alts.
Thank you! Your submission has been received!
Oops! Something went wrong while submitting the form.
 No credit card | 1-click unsubscribe
Token Metrics Team
Token Metrics Team

Recent Posts

Research

Bittensor Price Prediction 2025-2027 | TAO Forecast & Analysis

Token Metrics Team
7 min read

Understanding Bittensor's Speculative Nature

Bittensor operates as a community-driven token where price action stems primarily from social sentiment, attention cycles, and speculative trading rather than fundamental value drivers. TAO exhibits extreme volatility with no defensive characteristics or revenue-generating mechanisms typical of utility tokens. Token Metrics price prediction scenarios below provide technical forecasts across different market cap environments, though meme and speculative tokens correlate more strongly with viral trends and community engagement than systematic market cap models. Positions in TAO should be sized as high-risk speculative bets with potential for total loss.


Disclosure
Educational purposes only, not financial advice. Crypto is volatile, do your own research and manage risk.

How to read our price prediction methodology: Each band blends cycle analogues and market-cap share math with TA guardrails. Base assumes steady adoption and neutral or positive macro. Moon layers in a liquidity boom. Bear assumes muted flows and tighter liquidity. For speculative tokens, actual price prediction outcomes depend heavily on social trends and community momentum beyond what market cap models capture.

Bittensor (TAO) Price Prediction: TM Agent Baseline

Token Metrics long term price prediction view for Bittensor, cashtag $TAO. Lead metric first, Token Metrics TM Grade is 62%, Hold, and the trading signal is bullish, indicating modest project fundamentals and short-term upward momentum. Market context, Bitcoin direction and appetite for AI and research-oriented crypto projects determine capital flows into niche tokens like $TAO, so broader risk-on conditions would help sustained gains.

Concise 12-month price prediction numeric view: Token Metrics scenarios cluster roughly between $0.45 and $2.20, with a base case near $1.05, reflecting current network usage, developer activity, and token supply dynamics. Implication, if AI crypto interest and on-chain usage grow materially $TAO could approach the upper bound, while in a risk-off market or if network adoption stalls it would likely move toward the lower bound.

  • 16T: At 16 trillion, the range is $5,539.08, $6,710.41, and $7,881.74.

Token Details 

Key Takeaways

  • Highly speculative asset driven by sentiment and attention rather than fundamentals.
  • Scenario driven price predictions, outcomes hinge on total crypto market cap and viral momentum.
  • Extreme volatility characteristic - TAO can experience double-digit percentage moves daily.
  • TM Agent gist: conditions and usage growth could expand the upper range, risk-off or weak adoption could compress outcomes.
  • Entertainment risk only, not financial advice.

Bittensor Price Prediction: Scenario Analysis

Token Metrics price prediction scenarios provide technical price bands across market cap tiers:

  • 8T Price Prediction: At 8 trillion total crypto market cap, TAO projects to $2,129.86 (bear), $2,520.30 (base), and $2,910.75 (moon).
  • 16T Price Prediction: At 16 trillion, the range is $5,539.08, $6,710.41, and $7,881.74.
  • 23T Price Prediction: At 23 trillion, scenarios show $8,948.30, $10,900.52, and $12,852.74.
  • 31T Price Prediction: At 31 trillion, projections reach $12,357.53, $15,090.63, or $17,823.73.

These technical price prediction ranges assume speculative tokens maintain market cap share proportional to overall crypto growth. Actual outcomes for speculative tokens typically exhibit higher variance and stronger correlation to social trends than these models predict.

What Is Bittensor?

Bittensor is a decentralized network focused on machine learning markets, where participants contribute and consume AI services. Unlike utility tokens with broad real-world use cases, TAO operates in a niche AI context and often trades as a speculative community symbol.

TAO is the network token used for incentives and participation. Market performance depends heavily on broader interest in AI‑related crypto themes and community engagement around the project.

Risks That Skew Bearish on TAO Price Predictions

  • Extreme volatility from pure sentiment-driven price action with no fundamental support.
  • Attention cycles shift rapidly, leaving early viral tokens abandoned as new memes emerge.
  • Liquidity can evaporate quickly during downturns, creating severe slippage and exit difficulty.
  • Regulatory scrutiny may target speculative tokens as securities or gambling instruments.
  • Macro risk-off environments hit speculative assets hardest, with meme coins showing largest drawdowns.
  • Community fragmentation or developer abandonment can eliminate remaining narrative support.

FAQs About Bittensor Price Prediction

Will TAO 10x from here?

Yes, at a current price of $427.67, a 10x reaches $4,276.70. This level appears in the 16T bear and above price prediction scenarios. Meme and speculative tokens can 10x rapidly during viral moments but can also lose 90%+ just as quickly. Position sizing for potential total loss is critical. Not financial advice.

What are the biggest risks to TAO price predictions?

Primary risks include attention shifting to newer narratives, community fragmentation, developer abandonment, regulatory crackdowns, and liquidity collapse during downturns. Unlike utility tokens with defensive characteristics, TAO has no fundamental floor. Price can approach zero if community interest disappears. Total loss is a realistic outcome.


Next Steps

Disclosure

Educational purposes only, not financial advice. TAO is a highly speculative asset with extreme volatility and high risk of total loss. Speculative tokens operate as entertainment and gambling instruments rather than investments. Only allocate capital you can afford to lose entirely. Do your own research and manage risk appropriately.

About Token Metrics

Token Metrics is a cutting-edge crypto analytics and research platform that offers ratings, price predictions, and unique AI-driven insights for investors.

Research

Polkadot Price Prediction 2027 | DOT Forecast & Scenarios

Token Metrics Team
7 min read

Understanding Polkadot's 2027 Potential

The Layer 1 competitive landscape is consolidating as markets reward specialization over undifferentiated "Ethereum killers". Polkadot positions itself in a multi-chain world through shared security and parachain interoperability. Infrastructure maturity around custody and bridges makes alternate L1s more accessible into 2026.

The price prediction scenario projections below map different market share outcomes for DOT across varying total crypto market sizes. Base cases assume Polkadot maintains current ecosystem momentum, while moon scenarios factor in accelerated adoption, and bear cases reflect increased competitive pressure.


Disclosure
Educational purposes only, not financial advice. Crypto is volatile, do your own research and manage risk.

How to read our price prediction methodology:
Each band blends cycle analogues and market-cap share math with TA guardrails. Base assumes steady adoption and neutral or positive macro. Moon layers in a liquidity boom. Bear assumes muted flows and tighter liquidity.

Polkadot (DOT) Price Prediction: TM Agent Baseline

Token Metrics long term price prediction view for Polkadot, cashtag $DOT. Lead metric first, Token Metrics TM Grade is 71%, Buy, and the trading signal is bullish, which indicates above-average project quality, and positive short-term momentum. Market context, Bitcoin's trend and institutional flows into layer-1 ecosystems remain the dominant macro drivers, so $DOT's performance will track risk-on cycles and parachain adoption.

Concise 12-month price prediction numeric view: Token Metrics scenarios cluster roughly between $4.50 and $22, with a base case near $11, reflecting continued parachain activity, cross-chain integrations, and ecosystem growth. Implication, if the broader market enters a sustained bull phase and Polkadot adoption accelerates, $DOT could test the upper bound. In a prolonged risk-off environment or slower parachain uptake, it would likely drift toward the lower bound.

Polkadot Token Details 

Buy DOT on Gemini

Affiliate Disclosure: We may earn a commission from qualifying purchases made via this link, at no extra cost to you.

Key Takeaways

  • Scenario driven price predictions, outcomes hinge on total crypto market cap, higher liquidity and adoption lift the bands.
  • TM Agent gist: range $4.50 to $22 with a base near $11, upside requires adoption and liquidity, downside ties to risk-off.
  • Education only, not financial advice.

Polkadot Price Prediction: Scenario Analysis

Token Metrics price prediction scenarios span four market cap tiers, each representing different levels of crypto market maturity and liquidity:

  • 8T Price Prediction: At an eight trillion dollar total crypto market cap, DOT projects to $4.31 in bear conditions, $4.85 in the base case, and $5.39 in bullish scenarios.
  • 16T Price Prediction: Doubling the market to sixteen trillion expands the range to $6.82 (bear), $8.44 (base), and $10.07 (moon).
  • 23T Price Prediction: At twenty-three trillion, the scenarios show $9.33, $12.04, and $14.75 respectively.
  • 31T Price Prediction: In the maximum liquidity scenario of thirty-one trillion, DOT could reach $11.84 (bear), $15.63 (base), or $19.43 (moon).

Each tier assumes progressively stronger market conditions, with the base case reflecting steady growth and the moon case requiring sustained bull market dynamics.

Why Consider the Indices with Top-100 Exposure

Polkadot represents one opportunity among hundreds in crypto markets. Token Metrics Indices bundle DOT with top one hundred assets for systematic exposure to the strongest projects. Single tokens face idiosyncratic risks that diversified baskets mitigate.

Historical index performance demonstrates the value of systematic diversification versus concentrated positions. Join the early access list

Join the early access list

What Is Polkadot?

Polkadot is a network designed to connect specialized blockchains, called parachains, to a central Relay Chain for shared security and interoperability. Its architecture aims to enable cross-chain messaging and upgrades without hard forks.

DOT is the native token, used for staking to secure the network, on-chain governance, and bonding to add new parachains. Developers and users interact across parachains for use cases spanning DeFi, infrastructure, and cross-chain applications.

Token Metrics AI Analysis

Token Metrics AI provides comprehensive context on Polkadot's positioning and challenges.

Vision: Polkadot's vision is to create a decentralized web where independent blockchains can operate securely while communicating and sharing data across networks. It aims to enable a fully interoperable and scalable ecosystem that supports innovation in decentralized technologies.

Problem: The blockchain space faces fragmentation, with networks operating in isolation, limiting data and value transfer. This siloed structure hampers scalability, security, and user experience. Polkadot addresses the need for cross-chain communication and shared security, allowing blockchains to benefit from collective strength without sacrificing autonomy.

Solution: Polkadot uses a relay chain to coordinate a network of parachains, each with specialized functionality. It employs a nominated proof-of-stake (NPoS) consensus mechanism to secure the network and enable governance. Parachains lease slots via auctions, allowing projects to build custom blockchains with shared security and interoperability. The system supports cross-chain message passing, enabling data and asset transfers between different blockchains.

Market Analysis: Polkadot operates in the layer-0 and interoperability segment, competing with platforms like Cosmos and emerging multi-chain ecosystems. It differentiates itself through shared security, on-chain governance, and a robust parachain model. Adoption is driven by developer interest, parachain diversity, and integration with DeFi, NFTs, and enterprise solutions. Market conditions for Polkadot are influenced by broader crypto trends, regulatory developments, and execution of its technological roadmap. While it ranks among major smart contract platforms, it faces strong competition from Ethereum and high-throughput chains like Solana. Price and adoption depend on network usage, ecosystem growth, and macroeconomic factors in the crypto market.

Catalysts That Skew Bullish for DOT Price Predictions

  • Institutional and retail access expands with ETFs, listings, and integrations.
  • Macro tailwinds from lower real rates and improving liquidity.
  • Product or roadmap milestones such as upgrades, scaling, or partnerships.

Risks That Skew Bearish on DOT Price Predictions

  • Macro risk-off from tightening or liquidity shocks.
  • Regulatory actions or infrastructure outages.
  • Concentration or validator economics and competitive displacement.

FAQs About Polkadot Price Prediction

Will DOT hit $15 by 2027?

The 31T base case price prediction shows DOT at $15.63, which exceeds $15. The 23T moon case at $14.75 does not reach $15. Outcome depends on total crypto market cap growth and Polkadot maintaining market share. Not financial advice.

Can DOT 10x from current levels?

At current price of $3.10, a 10x would reach $31.0. None of the price prediction scenarios, with a high of $19.43 in the 31T moon case, reaches that level by 2027. 10x returns would require substantially greater market cap expansion. Not financial advice.

What price could DOT reach in the moon case?

Moon case price predictions range from $5.39 at 8T to $19.43 at 31T. These scenarios assume maximum liquidity expansion and strong Polkadot adoption. Not financial advice.

Next Steps

Disclosure

Educational purposes only, not financial advice. Crypto is volatile, do your own research and manage risk.

Why Use Token Metrics for Polkadot Price Prediction Investing?

Actionable AI-driven Ratings: Access live Token Metrics grades and signals for Polkadot and hundreds of crypto assets.

Scenario Forecasting: Visualize DOT upside and downside with rigorous price prediction scenario math, not unsubstantiated hype.

Portfolio Diversification: Token Metrics Indices let you systematically diversify among top projects, mitigating single-token risk.

Start your Polkadot price prediction research with institutional-grade tools from Token Metrics.

Research

Mantle (MNT) Price Prediction 2027 | Token Metrics Analysis

Token Metrics Team
7 min read

Mantle (MNT) Price Prediction: Portfolio Context for MNT - Diversification in the 2027 Landscape

Layer 2 tokens like Mantle offer exposure to Ethereum's scaling roadmap, but with concentration risk around one specific L2's adoption trajectory. MNT performance depends heavily on Mantle winning rollup market share against competing L2s. Diversified L2 exposure or broader L1 and L2 baskets reduce the risk of backing the wrong scaling solution.

Token Metrics price prediction scenarios below project MNT ranges across market environments. These outcomes assume Mantle maintains relevance as Ethereum scales, but portfolio theory suggests hedging this bet by holding multiple L2s or allocating to Ethereum itself, which benefits from L2 success regardless of which specific rollup dominates.

Disclosure

Educational purposes only, not financial advice. Crypto is volatile, do your own research and manage risk.

How to read it: Each band blends cycle analogues and market-cap share math with TA guardrails. Base assumes steady adoption and neutral or positive macro. Moon layers in a liquidity boom. Bear assumes muted flows and tighter liquidity.

TM Agent baseline: Token Metrics long term view for Mantle, cashtag $MNT. Lead metric first, Token Metrics TM Grade is 68%, Buy, and the trading signal is bullish, indicating positive short-term momentum and above-average project quality. Concise 12-month numeric view, price prediction scenarios cluster roughly between $0.70 and $3.40, with a base case near $1.60.

Token Details 

Key Takeaways

  • Scenario driven, outcomes hinge on total crypto market cap, higher liquidity and adoption lift the bands.
  • Single-asset concentration amplifies both upside and downside versus diversified approaches.
  • Fundamentals: Fundamental Grade 81.62% (Community 72%, Tokenomics 100%, Exchange 100%, VC —, DeFi Scanner 100%).
  • Technology: Technology Grade 78.22% (Activity 64%, Repository 70%, Collaboration 71%, Security —, DeFi Scanner 100%).
  • TM Agent gist: bullish signal, 12‑month range roughly $0.70 to $3.40 with base near $1.60.
  • Education only, not financial advice.

Scenario Analysis - MNT Price Prediction Models

Token Metrics price prediction scenarios span four market cap tiers, each representing different levels of crypto market maturity and liquidity:

  • 8T: At an 8 trillion dollar total crypto market cap, MNT projects to $3.16 in bear conditions, $3.73 in the base case, and $4.30 in bullish scenarios.
  • 16T: Doubling the market to 16 trillion expands the price prediction range to $6.27 (bear), $7.99 (base), and $9.71 (moon).
  • 23T: At 23 trillion, the price prediction scenarios show $9.38, $12.25, and $15.12 respectively.
  • 31T: In the maximum liquidity scenario of 31 trillion, MNT price prediction could reach $12.49 (bear), $16.51 (base), or $20.52 (moon).

These ranges illustrate potential outcomes for concentrated MNT positions, but investors should weigh whether single-asset exposure matches their risk tolerance or whether diversified strategies better suit their objectives.

The Case for Diversified Index Exposure

Portfolio theory teaches that diversification is the only free lunch in investing. MNT concentration violates this principle by tying your crypto returns to one protocol's fate. Token Metrics Indices blend Mantle with the top one hundred tokens, providing broad exposure to crypto's growth while smoothing volatility through cross-asset diversification. This approach captures market-wide tailwinds without overweighting any single point of failure.

Systematic rebalancing within index strategies creates an additional return source that concentrated positions lack. As some tokens outperform and others lag, regular rebalancing mechanically sells winners and buys laggards, exploiting mean reversion and volatility. Single-token holders miss this rebalancing alpha and often watch concentrated gains evaporate during corrections while index strategies preserve more gains through automated profit-taking.

Beyond returns, diversified indices improve the investor experience by reducing emotional decision-making. Concentrated MNT positions subject you to severe drawdowns that trigger panic selling at bottoms. Indices smooth the ride through natural diversification, making it easier to maintain exposure through full market cycles.

Get early access

What Is Mantle?

Mantle is a blockchain project focused on scaling Ethereum via layer 2 rollup technology. The goal is to enable faster and cheaper transactions while inheriting Ethereum security. It targets scalable and efficient infrastructure for decentralized applications and financial services.

The MNT token powers network economics such as fees, incentives, or governance depending on implementation. Users interact with dApps and bridges within the ecosystem, and Mantle competes among leading Ethereum scaling solutions.

Token Metrics AI Analysis

  • Vision: Mantle aims to build a scalable, secure, and self-sustaining blockchain ecosystem that leverages decentralized governance and treasury-backed financial innovation. Its vision emphasizes capital efficiency, leveraging restaking for security, and fostering long-term sustainability through community-driven development and treasury utilization.
  • Problem: Many blockchain platforms face trade-offs between scalability, security, and capital efficiency. High transaction costs and network congestion on Ethereum, combined with fragmented liquidity and underutilized treasury assets in DAOs, create friction for developers and users. Mantle addresses the challenge of efficiently deploying capital while maintaining robust security and enabling rapid, low-cost transactions for decentralized applications.
  • Solution: Mantle implements an Ethereum Layer 2 network using optimistic rollup technology to reduce fees and increase throughput. It integrates EigenLayer for security via restaking, allowing its treasury to earn yield and contribute to network validation. The ecosystem supports native governance through its token and funds development via a large DAO-managed treasury, aiming to create a self-sustaining cycle of innovation and user incentives.
  • Market Analysis: Mantle operates in the competitive Layer 2 and modular blockchain space, competing with established networks like Arbitrum, Optimism, and emerging restaking platforms. Its differentiation lies in the integration of a large treasury with restaking, aiming to bootstrap security and ecosystem growth simultaneously. Adoption is driven by developer activity, yield opportunities, and strategic partnerships within the broader Ethereum ecosystem. Market risks include execution challenges in treasury management, regulatory scrutiny on DAO structures, and strong competition from other scaling solutions. While not a market leader like Ethereum or Bitcoin, Mantle participates in the broader narrative of modular, restaked, and treasury-driven blockchains, which have gained traction in 2024-2025.

Fundamental and Technology Snapshot from Token Metrics

  • Fundamental Grade: 81.62% (Community 72%, Tokenomics 100%, Exchange 100%, VC —, DeFi Scanner 100%).
  • Technology Grade: 78.22% (Activity 64%, Repository 70%, Collaboration 71%, Security —, DeFi Scanner 100%).

Catalysts That Skew Bullish

  • Institutional and retail access expands with ETFs, listings, and integrations.
  • Macro tailwinds from lower real rates and improving liquidity.
  • Product or roadmap milestones such as upgrades, scaling, or partnerships.

Risks That Skew Bearish

  • Macro risk-off from tightening or liquidity shocks.
  • Regulatory actions or infrastructure outages.
  • Concentration or validator economics and competitive displacement.
  • Protocol-specific execution risk and competitive pressure from alternatives.

FAQs

Can MNT reach $10?

Based on the price prediction scenarios, MNT could reach $10 in the higher tiers. The 23T tier projects $12.25 in the base case, and the 31T tier shows $12.49 (bear), $16.51 (base), and $20.52 (moon). Achieving this requires both broad market cap expansion and Mantle maintaining competitive position. Not financial advice.

What's the risk/reward profile for MNT?

Risk and reward spans from $3.16 at 8T bear to $20.52 at 31T moon. Downside risks include competitive pressure among L2s and execution challenges, while upside drivers include adoption growth and liquidity expansion. Concentrated positions amplify both tails, while diversified strategies smooth outcomes.

What gives MNT value?

MNT accrues value through network usage, fees, incentives, and governance tied to Mantle's L2 ecosystem. Demand drivers include dApp activity, bridging, and security via restaking integrations. While these fundamentals matter, diversified portfolios capture value accrual across multiple tokens rather than betting on one protocol's success.

Where can I find Mantle price predictions?

Token Metrics provides comprehensive Mantle (MNT) price predictions through scenario-based analysis spanning multiple market cap tiers. Our data-driven price prediction models incorporate fundamental grades, technology scores, and market conditions to project potential MNT price targets across bear, base, and moon scenarios.

Next Steps

Disclosure

Educational purposes only, not financial advice. Crypto is volatile, concentration amplifies risk, and diversification is a fundamental principle of prudent portfolio construction. Do your own research and manage risk appropriately.

Why Investors Choose Token Metrics

Token Metrics provides data-driven crypto ratings, on-chain grades, and scenario-based targets—empowering you to make informed investment decisions with confidence. Accelerate your research with unique AI-powered analysis and risk management tools.

Choose from Platinum, Gold, and Silver packages
Reach with 25–30% open rates and 0.5–1% CTR
Craft your own custom ad—from banners to tailored copy
Perfect for Crypto Exchanges, SaaS Tools, DeFi, and AI Products