Back to blog
Research

Top Regulatory Compliance/KYC/AML Providers (2025)

See the 10 best crypto KYC/AML providers for 2025—IDV, screening, blockchain analytics, and Travel Rule. Compare picks and choose the right stack.
Sam Monac
5 min
Want Smarter Crypto Picks—Free?
See unbiased Token Metrics Ratings for BTC, ETH, and top alts.
Thank you! Your submission has been received!
Oops! Something went wrong while submitting the form.
 No credit card | 1-click unsubscribe

Why crypto compliance, KYC/AML & blockchain analytics vendors Matters in September 2025

If you operate an exchange, wallet, OTC desk, or DeFi on-ramp, choosing the right KYC/AML providers can be the difference between smooth growth and painful remediation. In 2025, regulators continue to tighten enforcement (Travel Rule, sanctions screening, transaction monitoring), while criminals get more sophisticated across bridges, mixers, and multi-chain hops. This guide shortlists ten credible vendors that help crypto businesses verify users, monitor wallets and transactions, and comply with global rules.
Definition (snippet): KYC/AML providers are companies that deliver identity verification, sanctions/PEP screening, blockchain analytics, transaction monitoring, and Travel Rule tooling so crypto businesses can meet regulatory obligations and reduce financial crime risk.

SECONDARY_KEYWORDS woven below: crypto compliance, blockchain analytics, transaction monitoring, Travel Rule.

How We Picked (Methodology & Scoring)

  • What we scored (weights): Market adoption & scale (liquidity 30 as a proxy for coverage & volume handled), security posture 25 (audits, data protection, regulatory alignment), coverage 15 (chains, assets, jurisdictions), costs 15 (pricing transparency, efficiency), UX 10 (API, case mgmt., automation), support 5 (docs, SLAs).

  • Data sources: Only official product pages, security/trust centers, and documentation; widely cited market datasets used only to cross-check asset/chain coverage. “Last updated September 2025.” Chainalysis+2TRM Labs+2

Top 10 crypto compliance, KYC/AML & blockchain analytics vendors in September 2025

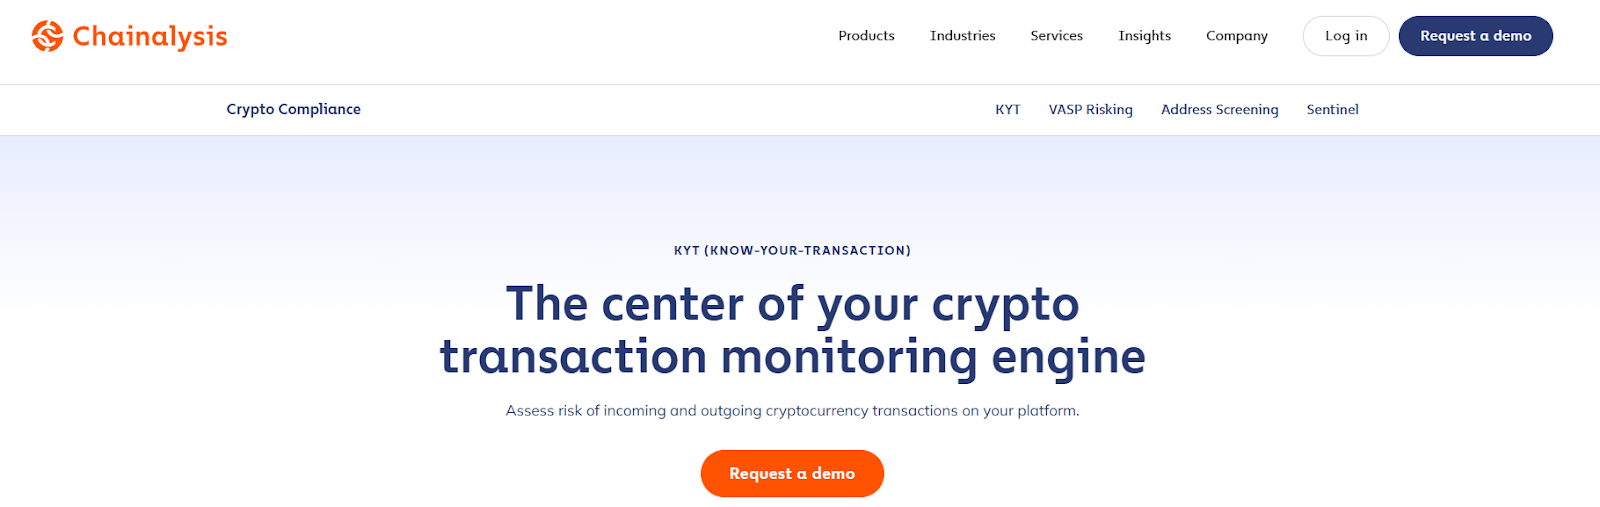
1. Chainalysis — Best for cross-chain transaction risk & investigations

Why Use It: Chainalysis KYT and Reactor pair broad chain/token coverage with real-time risk scoring and deep investigative tooling. If you need automated alerts on deposits/withdrawals and the ability to trace through bridges/mixers/DEXs, it’s a proven, regulator-recognized stack.
Best For: Centralized exchanges, custodians, banks with crypto exposure, law enforcement teams.
Notable Features: Real-time KYT alerts • Cross-chain tracing • Case management & APIs • Attribution datasets.
Consider If: You want an enterprise-grade standard and investigator workflows under one roof.
Alternatives: TRM Labs, Elliptic. Chainalysis+1
Regions: Global • Fees/Notes: Quote-based, volume/seat tiers.

2. TRM Labs — Best for fast-moving threat intel & sanctions coverage

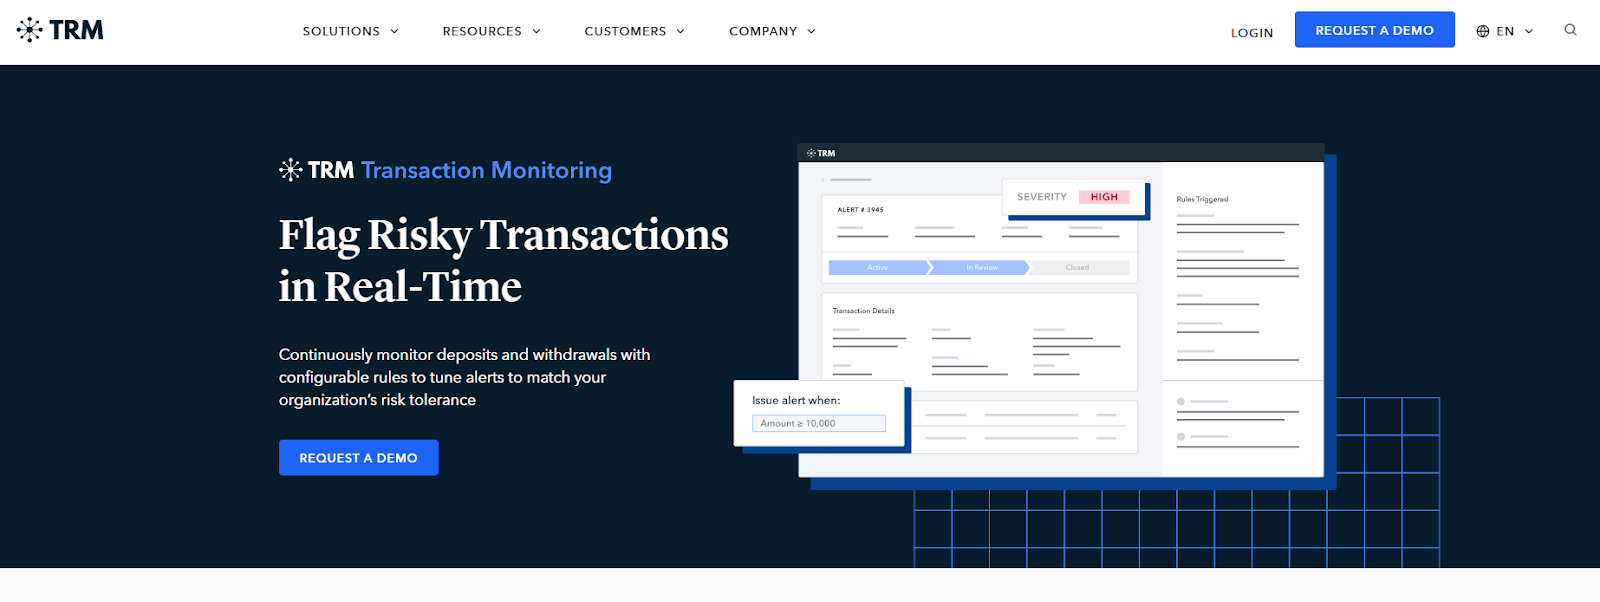
Why Use It: TRM’s transaction monitoring taps a large, fast-growing database of illicit activity and extends screening beyond official lists to include threat actor footprints on-chain. Strong coverage and practical APIs make it easy to plug into existing case systems.
Best For: Exchanges, payment processors, fintechs expanding into web3, risk teams that need flexible rules.
Notable Features: Real-time monitoring • Sanctions & threat actor intelligence • Case mgmt. integrations • Multi-chain coverage.
Consider If: You prioritize dynamic risk models and frequent list updates.
Alternatives: Chainalysis, Elliptic. TRM Labs+1
Regions: Global • Fees/Notes: Enterprise contracts; volume-based.

3. Elliptic — Best for scalable wallet screening at exchange scale

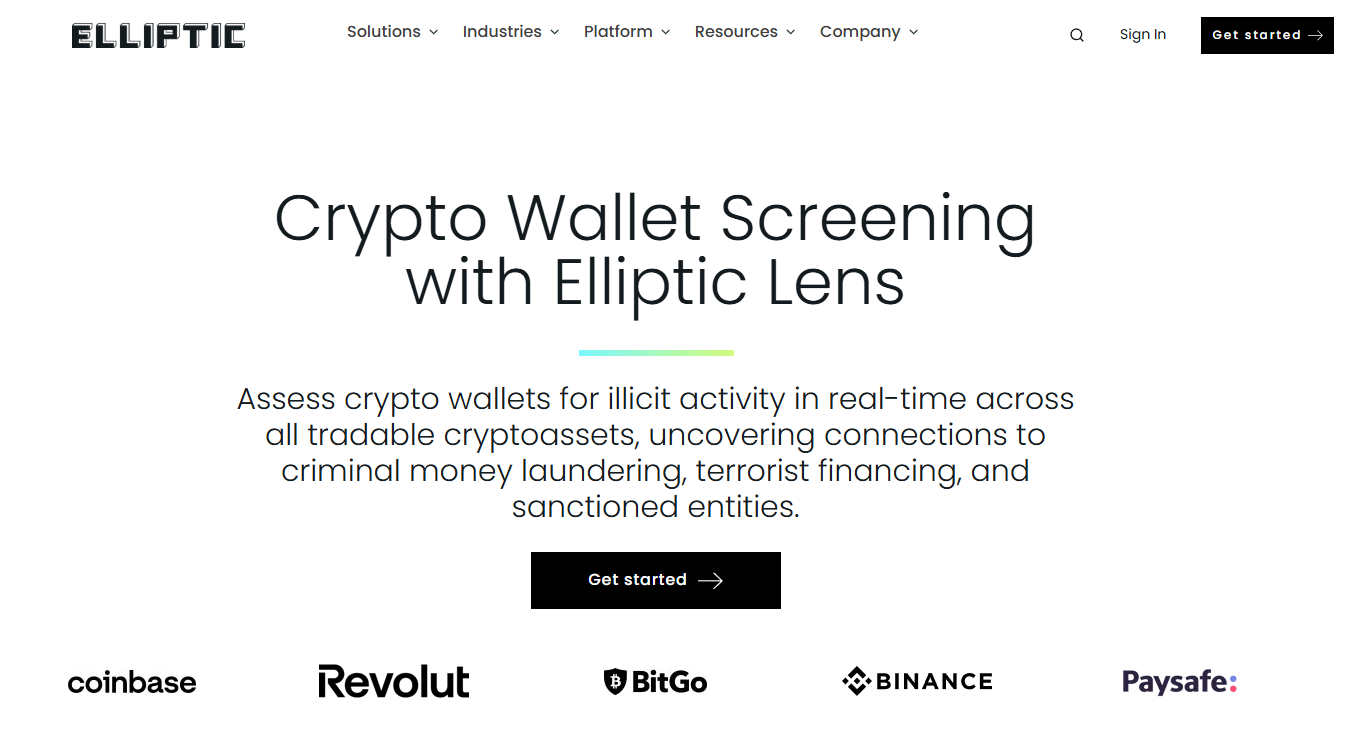
Why Use It: Elliptic’s Lens and Screening solutions streamline wallet/transaction checks with chain-agnostic coverage and audit-ready workflows. It’s built for high-volume screening with clean APIs and strong reporting for regulators and internal audit.
Best For: CEXs, payment companies, institutional custody, risk ops needing bulk screening.
Notable Features: Wallet & TX screening • Cross-chain risk detection • Audit trails • Customer analytics.
Consider If: You need mature address screening and large-scale throughput.
Alternatives: Chainalysis, TRM Labs. Elliptic+1
Regions: Global • Fees/Notes: Quote-based; discounts by volume.

4. ComplyAdvantage — Best for sanctions/PEP/adverse media screening in crypto

Why Use It: An AML data powerhouse for KYC and ongoing monitoring that many crypto companies use to meet screening obligations and reduce false positives. Strong watchlist coverage, adverse media, and continuous monitoring help you satisfy banking partners and auditors.
Best For: Exchanges and fintechs that want robust sanctions/PEP data plus transaction monitoring.
Notable Features: Real-time sanctions & watchlists • Ongoing monitoring • Payment screening • Graph analysis.
Consider If: You want a single vendor for screening + monitoring alongside your analytics stack.
Alternatives: Jumio (Screening), Sumsub. ComplyAdvantage+1
Regions: Global • Fees/Notes: Tiered enterprise pricing.

5. Sumsub — Best all-in-one KYC/KYB + crypto monitoring

Why Use It: Crypto-focused onboarding with liveness, documents, KYB, Travel Rule support, and transaction monitoring—plus in-house legal experts to interpret changing rules. Good for teams that need to orchestrate identity checks and AML controls in one flow.
Best For: Global exchanges, NFT/DeFi ramps, high-growth startups entering new markets.
Notable Features: KYC/KYB • Watchlists/PEPs • Device intelligence • Crypto TX monitoring • Case management.
Consider If: You want one vendor for identity + AML + Travel Rule workflow.
Alternatives: Jumio, ComplyAdvantage. Sumsub+1
Regions: Global • Fees/Notes: Per-verification & volume tiers.

6. Jumio — Best for enterprise-grade identity + AML screening

Why Use It: Jumio combines biometric KYC with automated AML screening (PEPs/sanctions) and ongoing monitoring. Its “KYX” approach provides identity insights across the customer lifecycle, helping reduce fraud while keeping onboarding friction reasonable.
Best For: Regulated exchanges, banks, brokerages with strict KYC/AML controls.
Notable Features: Biometric verification • PEPs/sanctions screening • Ongoing monitoring • Single-API platform.
Consider If: You need global coverage and battle-tested uptime/SLA.
Alternatives: Sumsub, Onfido (not listed). Jumio+1
Regions: Global • Fees/Notes: Custom enterprise pricing.

7. Notabene — Best end-to-end Travel Rule platform

Why Use It: Notabene focuses on pre-transaction decisioning, counterparty VASP due diligence, and sanctions screening across multiple Travel Rule protocols. It’s purpose-built for crypto compliance teams facing enforcement of FATF Recommendation 16.
Best For: Exchanges, custodians, and B2B payment platforms needing Travel Rule at scale.
Notable Features: Pre-TX checks • Counterparty VASP verification • Multi-protocol messaging • Jurisdictional rules engine.
Consider If: Your regulators or banking partners expect full Travel Rule compliance today.
Alternatives: Shyft Veriscope, 21 Analytics. Notabene+1
Regions: Global • Fees/Notes: Annual + usage components.

8. Shyft Network Veriscope — Best decentralized, interoperable Travel Rule messaging

Why Use It: Veriscope provides decentralized VASP discovery, secure VASP-to-VASP PII exchange, and “sunrise issue” lookback to help during uneven global rollouts. Pay-as-you-go pricing can be attractive for newer programs.
Best For: Global VASPs that want decentralized discovery and interoperability.
Notable Features: Auto VASP discovery • Secure PII transfer (no central PII storage) • Lookback support • Interoperability.
Consider If: You prefer decentralized architecture and usage-based pricing.
Alternatives: Notabene, 21 Analytics. shyft.network+1
Regions: Global • Fees/Notes: Pay-as-you-go; no setup fees. shyft.network

9. Merkle Science — Best for predictive blockchain risk analytics

Why Use It: Merkle Science’s platform emphasizes predictive risk modeling and DeFi/smart contract forensics, helping compliance teams see beyond static address tags. Good complement when you monitor emerging chains and token types.
Best For: Exchanges and protocols active in DeFi, new L1/L2 ecosystems, or smart-contract risk.
Notable Features: Predictive risk scores • DeFi & contract forensics • Case tooling • API integrations.
Consider If: You need analytics tuned for newer protocols and token standards.
Alternatives: Chainalysis, TRM Labs. merklescience.com+1
Regions: Global • Fees/Notes: Quote-based enterprise pricing.

10. Scorechain — Best EU-born analytics with audit-ready reporting

Why Use It: Based in Luxembourg, Scorechain offers risk scoring, transaction monitoring, and reporting designed to fit EU frameworks—useful for MiCA/TFR-aligned programs. Teams like the straightforward reporting exports for audits and regulators.
Best For: EU-focused exchanges, neobanks, and tokenization platforms.
Notable Features: Risk scoring • Transaction monitoring • Audit-ready reports • Tools for Travel Rule workflows.
Consider If: Your footprint is primarily EU and you want EU-centric vendor DNA.
Alternatives: Crystal (EU), Elliptic. Scorechain+1
Regions: EU/Global • Fees/Notes: Enterprise licenses; fixed and usage options.

Decision Guide: Best By Use Case

  • Regulated U.S. exchange: Chainalysis, TRM Labs

  • Global wallet screening at scale: Elliptic

  • Enterprise KYC + AML screening combo: Jumio, Sumsub

  • Travel Rule (end-to-end ops): Notabene

  • Travel Rule (decentralized, pay-as-you-go): Shyft Veriscope

  • DeFi/smart-contract forensics: Merkle Science

  • EU-centric programs / audit exports: Scorechain

  • Sanctions/PEP data depth: ComplyAdvantage

How to Choose the Right crypto compliance, KYC/AML & blockchain analytics vendors (Checklist)

  • Jurisdiction & licensing: Confirm the vendor supports your countries and regulator expectations (e.g., FATF R.16 Travel Rule).

  • Coverage: Chains/tokens you touch today and plan to touch in 12–18 months.

  • Identity depth: Liveness, device checks, KYB for entities, ongoing monitoring.

  • Analytics & monitoring: Risk models, false-positive rate, sanctions coverage cadence.

  • APIs & workflow: Case management, alert triage, audit trails, BI exports.

  • Costs: Pricing model (per-verification, per-alert, or pay-as-you-go).

  • Security: Data handling, PII minimization, breach history, regional data residency.

  • Red flags: “Black box” risk scores without documentation; no audit logs.

Use Token Metrics With Any crypto compliance, KYC/AML & blockchain analytics vendors

  • AI Ratings: Screen assets and spot structural risks before you list.
  • Narrative Detection: Track shifts that correlate with on-chain risk trends.

  • Portfolio Optimization: Balance exposure as assets pass compliance checks.

  • Alerts & Signals: Monitor entries/exits once assets are approved.
    Workflow: Research vendors → Select/implement → List/enable assets → Monitor with Token Metrics alerts.

 Primary CTA: Start a free trial of Token Metrics.

Security & Compliance Tips

  • Enforce 2FA and role-based access for compliance consoles.

  • Separate PII from blockchain telemetry; minimize retention.

  • Implement Travel Rule pre-transaction checks where required. FATF

  • Test sanctions list update cadences and backfill behavior.

  • Document SAR/STR processes and case handoffs.

This article is for research/education, not financial advice.

Beginner Mistakes to Avoid

  • Picking a vendor with great KYC but no Travel Rule path.

  • Ignoring chain/token roadmaps—coverage gaps appear later.

  • Under-investing in case management/audit trails.

  • Relying solely on address tags without behavior analytics.

  • Not budgeting for ongoing monitoring (alerts grow with volume).

FAQs

What’s the difference between KYC and KYT (Know Your Transaction)?
KYC verifies an individual or entity at onboarding and during refresh cycles. KYT/transaction monitoring analyzes wallets and transfers in real time (or post-event) to identify suspicious activity, sanctions exposure, and patterns of illicit finance. TRM Labs

Do I need a Travel Rule solution if I only serve retail in one country?
Possibly. Many jurisdictions apply the Travel Rule above certain thresholds and when sending to other VASPs, even domestically. If you interoperate with global exchanges or custodians, you’ll likely need it. Notabene

How do vendors differ on sanctions coverage?
Screening providers update against official lists and, in some cases, extend coverage using intelligence on known threat actors’ wallets. Look for rapid refresh cycles and retroactive screening. TRM Labs

Can I mix-and-match KYC and blockchain analytics vendors?
Yes. Many teams use a KYC/AML screening vendor plus a blockchain analytics platform; some suites offer both, but best-of-breed mixes are common.

What’s a good starting stack for a new exchange?
A KYC/KYB vendor (Jumio or Sumsub), a sanctions/PEP screening engine (ComplyAdvantage or your KYC vendor’s module), a blockchain analytics platform (Chainalysis/TRM/Elliptic), and a Travel Rule tool (Notabene or Veriscope).

Conclusion + Related Reads

Compliance isn’t one tool; it’s a stack. If you’re U.S.-regulated and high-volume, start with Chainalysis or TRM plus Jumio or Sumsub. If you’re EU-led, Scorechain can simplify audits. For Travel Rule, choose Notabene (end-to-end) or Veriscope (decentralized/pay-as-you-go). Pair your chosen stack with Token Metrics to research, monitor, and act with confidence.

Related Reads:

  • Best Cryptocurrency Exchanges 2025

  • Top Derivatives Platforms 2025

  • Top Institutional Custody Providers 2025

Sources & Update Notes

We independently reviewed official product pages, docs, and security/trust materials for each provider (no third-party links in body). Shortlist refreshed September 2025; we’ll revisit as regulations, features, and availability change.

Scorechain — Product pages & glossary resources. Scorechain+1

Build Smarter Crypto Apps &
AI Agents in Minutes, Not Months
Real-time prices, trading signals, and on-chain insights all from one powerful API.
Grab a Free API Key
About Token Metrics
Token Metrics: AI-powered crypto research and ratings platform. We help investors make smarter decisions with unbiased Token Metrics Ratings, on-chain analytics, and editor-curated “Top 10” guides. Our platform distills thousands of data points into clear scores, trends, and alerts you can act on.
30 Employees
analysts, data scientists, and crypto engineers
Daily Briefings
concise market insights and “Top Picks”
Transparent & Compliant
Sponsored ≠ Ratings; research remains independent
Want Smarter Crypto Picks—Free?
See unbiased Token Metrics Ratings for BTC, ETH, and top alts.
Thank you! Your submission has been received!
Oops! Something went wrong while submitting the form.
 No credit card | 1-click unsubscribe
Token Metrics Team
Token Metrics Team

Recent Posts

Research

Polkadot Price Prediction 2027 | DOT Forecast & Scenarios

Token Metrics Team
7 min read

Understanding Polkadot's 2027 Potential

The Layer 1 competitive landscape is consolidating as markets reward specialization over undifferentiated "Ethereum killers". Polkadot positions itself in a multi-chain world through shared security and parachain interoperability. Infrastructure maturity around custody and bridges makes alternate L1s more accessible into 2026.

The price prediction scenario projections below map different market share outcomes for DOT across varying total crypto market sizes. Base cases assume Polkadot maintains current ecosystem momentum, while moon scenarios factor in accelerated adoption, and bear cases reflect increased competitive pressure.


Disclosure
Educational purposes only, not financial advice. Crypto is volatile, do your own research and manage risk.

How to read our price prediction methodology:
Each band blends cycle analogues and market-cap share math with TA guardrails. Base assumes steady adoption and neutral or positive macro. Moon layers in a liquidity boom. Bear assumes muted flows and tighter liquidity.

Polkadot (DOT) Price Prediction: TM Agent Baseline

Token Metrics long term price prediction view for Polkadot, cashtag $DOT. Lead metric first, Token Metrics TM Grade is 71%, Buy, and the trading signal is bullish, which indicates above-average project quality, and positive short-term momentum. Market context, Bitcoin's trend and institutional flows into layer-1 ecosystems remain the dominant macro drivers, so $DOT's performance will track risk-on cycles and parachain adoption.

Concise 12-month price prediction numeric view: Token Metrics scenarios cluster roughly between $4.50 and $22, with a base case near $11, reflecting continued parachain activity, cross-chain integrations, and ecosystem growth. Implication, if the broader market enters a sustained bull phase and Polkadot adoption accelerates, $DOT could test the upper bound. In a prolonged risk-off environment or slower parachain uptake, it would likely drift toward the lower bound.

Polkadot Token Details 

Buy DOT on Gemini

Affiliate Disclosure: We may earn a commission from qualifying purchases made via this link, at no extra cost to you.

Key Takeaways

  • Scenario driven price predictions, outcomes hinge on total crypto market cap, higher liquidity and adoption lift the bands.
  • TM Agent gist: range $4.50 to $22 with a base near $11, upside requires adoption and liquidity, downside ties to risk-off.
  • Education only, not financial advice.

Polkadot Price Prediction: Scenario Analysis

Token Metrics price prediction scenarios span four market cap tiers, each representing different levels of crypto market maturity and liquidity:

  • 8T Price Prediction: At an eight trillion dollar total crypto market cap, DOT projects to $4.31 in bear conditions, $4.85 in the base case, and $5.39 in bullish scenarios.
  • 16T Price Prediction: Doubling the market to sixteen trillion expands the range to $6.82 (bear), $8.44 (base), and $10.07 (moon).
  • 23T Price Prediction: At twenty-three trillion, the scenarios show $9.33, $12.04, and $14.75 respectively.
  • 31T Price Prediction: In the maximum liquidity scenario of thirty-one trillion, DOT could reach $11.84 (bear), $15.63 (base), or $19.43 (moon).

Each tier assumes progressively stronger market conditions, with the base case reflecting steady growth and the moon case requiring sustained bull market dynamics.

Why Consider the Indices with Top-100 Exposure

Polkadot represents one opportunity among hundreds in crypto markets. Token Metrics Indices bundle DOT with top one hundred assets for systematic exposure to the strongest projects. Single tokens face idiosyncratic risks that diversified baskets mitigate.

Historical index performance demonstrates the value of systematic diversification versus concentrated positions. Join the early access list

Join the early access list

What Is Polkadot?

Polkadot is a network designed to connect specialized blockchains, called parachains, to a central Relay Chain for shared security and interoperability. Its architecture aims to enable cross-chain messaging and upgrades without hard forks.

DOT is the native token, used for staking to secure the network, on-chain governance, and bonding to add new parachains. Developers and users interact across parachains for use cases spanning DeFi, infrastructure, and cross-chain applications.

Token Metrics AI Analysis

Token Metrics AI provides comprehensive context on Polkadot's positioning and challenges.

Vision: Polkadot's vision is to create a decentralized web where independent blockchains can operate securely while communicating and sharing data across networks. It aims to enable a fully interoperable and scalable ecosystem that supports innovation in decentralized technologies.

Problem: The blockchain space faces fragmentation, with networks operating in isolation, limiting data and value transfer. This siloed structure hampers scalability, security, and user experience. Polkadot addresses the need for cross-chain communication and shared security, allowing blockchains to benefit from collective strength without sacrificing autonomy.

Solution: Polkadot uses a relay chain to coordinate a network of parachains, each with specialized functionality. It employs a nominated proof-of-stake (NPoS) consensus mechanism to secure the network and enable governance. Parachains lease slots via auctions, allowing projects to build custom blockchains with shared security and interoperability. The system supports cross-chain message passing, enabling data and asset transfers between different blockchains.

Market Analysis: Polkadot operates in the layer-0 and interoperability segment, competing with platforms like Cosmos and emerging multi-chain ecosystems. It differentiates itself through shared security, on-chain governance, and a robust parachain model. Adoption is driven by developer interest, parachain diversity, and integration with DeFi, NFTs, and enterprise solutions. Market conditions for Polkadot are influenced by broader crypto trends, regulatory developments, and execution of its technological roadmap. While it ranks among major smart contract platforms, it faces strong competition from Ethereum and high-throughput chains like Solana. Price and adoption depend on network usage, ecosystem growth, and macroeconomic factors in the crypto market.

Catalysts That Skew Bullish for DOT Price Predictions

  • Institutional and retail access expands with ETFs, listings, and integrations.
  • Macro tailwinds from lower real rates and improving liquidity.
  • Product or roadmap milestones such as upgrades, scaling, or partnerships.

Risks That Skew Bearish on DOT Price Predictions

  • Macro risk-off from tightening or liquidity shocks.
  • Regulatory actions or infrastructure outages.
  • Concentration or validator economics and competitive displacement.

FAQs About Polkadot Price Prediction

Will DOT hit $15 by 2027?

The 31T base case price prediction shows DOT at $15.63, which exceeds $15. The 23T moon case at $14.75 does not reach $15. Outcome depends on total crypto market cap growth and Polkadot maintaining market share. Not financial advice.

Can DOT 10x from current levels?

At current price of $3.10, a 10x would reach $31.0. None of the price prediction scenarios, with a high of $19.43 in the 31T moon case, reaches that level by 2027. 10x returns would require substantially greater market cap expansion. Not financial advice.

What price could DOT reach in the moon case?

Moon case price predictions range from $5.39 at 8T to $19.43 at 31T. These scenarios assume maximum liquidity expansion and strong Polkadot adoption. Not financial advice.

Next Steps

Disclosure

Educational purposes only, not financial advice. Crypto is volatile, do your own research and manage risk.

Why Use Token Metrics for Polkadot Price Prediction Investing?

Actionable AI-driven Ratings: Access live Token Metrics grades and signals for Polkadot and hundreds of crypto assets.

Scenario Forecasting: Visualize DOT upside and downside with rigorous price prediction scenario math, not unsubstantiated hype.

Portfolio Diversification: Token Metrics Indices let you systematically diversify among top projects, mitigating single-token risk.

Start your Polkadot price prediction research with institutional-grade tools from Token Metrics.

Research

Mantle (MNT) Price Prediction 2027 | Token Metrics Analysis

Token Metrics Team
7 min read

Mantle (MNT) Price Prediction: Portfolio Context for MNT - Diversification in the 2027 Landscape

Layer 2 tokens like Mantle offer exposure to Ethereum's scaling roadmap, but with concentration risk around one specific L2's adoption trajectory. MNT performance depends heavily on Mantle winning rollup market share against competing L2s. Diversified L2 exposure or broader L1 and L2 baskets reduce the risk of backing the wrong scaling solution.

Token Metrics price prediction scenarios below project MNT ranges across market environments. These outcomes assume Mantle maintains relevance as Ethereum scales, but portfolio theory suggests hedging this bet by holding multiple L2s or allocating to Ethereum itself, which benefits from L2 success regardless of which specific rollup dominates.

Disclosure

Educational purposes only, not financial advice. Crypto is volatile, do your own research and manage risk.

How to read it: Each band blends cycle analogues and market-cap share math with TA guardrails. Base assumes steady adoption and neutral or positive macro. Moon layers in a liquidity boom. Bear assumes muted flows and tighter liquidity.

TM Agent baseline: Token Metrics long term view for Mantle, cashtag $MNT. Lead metric first, Token Metrics TM Grade is 68%, Buy, and the trading signal is bullish, indicating positive short-term momentum and above-average project quality. Concise 12-month numeric view, price prediction scenarios cluster roughly between $0.70 and $3.40, with a base case near $1.60.

Token Details 

Key Takeaways

  • Scenario driven, outcomes hinge on total crypto market cap, higher liquidity and adoption lift the bands.
  • Single-asset concentration amplifies both upside and downside versus diversified approaches.
  • Fundamentals: Fundamental Grade 81.62% (Community 72%, Tokenomics 100%, Exchange 100%, VC —, DeFi Scanner 100%).
  • Technology: Technology Grade 78.22% (Activity 64%, Repository 70%, Collaboration 71%, Security —, DeFi Scanner 100%).
  • TM Agent gist: bullish signal, 12‑month range roughly $0.70 to $3.40 with base near $1.60.
  • Education only, not financial advice.

Scenario Analysis - MNT Price Prediction Models

Token Metrics price prediction scenarios span four market cap tiers, each representing different levels of crypto market maturity and liquidity:

  • 8T: At an 8 trillion dollar total crypto market cap, MNT projects to $3.16 in bear conditions, $3.73 in the base case, and $4.30 in bullish scenarios.
  • 16T: Doubling the market to 16 trillion expands the price prediction range to $6.27 (bear), $7.99 (base), and $9.71 (moon).
  • 23T: At 23 trillion, the price prediction scenarios show $9.38, $12.25, and $15.12 respectively.
  • 31T: In the maximum liquidity scenario of 31 trillion, MNT price prediction could reach $12.49 (bear), $16.51 (base), or $20.52 (moon).

These ranges illustrate potential outcomes for concentrated MNT positions, but investors should weigh whether single-asset exposure matches their risk tolerance or whether diversified strategies better suit their objectives.

The Case for Diversified Index Exposure

Portfolio theory teaches that diversification is the only free lunch in investing. MNT concentration violates this principle by tying your crypto returns to one protocol's fate. Token Metrics Indices blend Mantle with the top one hundred tokens, providing broad exposure to crypto's growth while smoothing volatility through cross-asset diversification. This approach captures market-wide tailwinds without overweighting any single point of failure.

Systematic rebalancing within index strategies creates an additional return source that concentrated positions lack. As some tokens outperform and others lag, regular rebalancing mechanically sells winners and buys laggards, exploiting mean reversion and volatility. Single-token holders miss this rebalancing alpha and often watch concentrated gains evaporate during corrections while index strategies preserve more gains through automated profit-taking.

Beyond returns, diversified indices improve the investor experience by reducing emotional decision-making. Concentrated MNT positions subject you to severe drawdowns that trigger panic selling at bottoms. Indices smooth the ride through natural diversification, making it easier to maintain exposure through full market cycles.

Get early access

What Is Mantle?

Mantle is a blockchain project focused on scaling Ethereum via layer 2 rollup technology. The goal is to enable faster and cheaper transactions while inheriting Ethereum security. It targets scalable and efficient infrastructure for decentralized applications and financial services.

The MNT token powers network economics such as fees, incentives, or governance depending on implementation. Users interact with dApps and bridges within the ecosystem, and Mantle competes among leading Ethereum scaling solutions.

Token Metrics AI Analysis

  • Vision: Mantle aims to build a scalable, secure, and self-sustaining blockchain ecosystem that leverages decentralized governance and treasury-backed financial innovation. Its vision emphasizes capital efficiency, leveraging restaking for security, and fostering long-term sustainability through community-driven development and treasury utilization.
  • Problem: Many blockchain platforms face trade-offs between scalability, security, and capital efficiency. High transaction costs and network congestion on Ethereum, combined with fragmented liquidity and underutilized treasury assets in DAOs, create friction for developers and users. Mantle addresses the challenge of efficiently deploying capital while maintaining robust security and enabling rapid, low-cost transactions for decentralized applications.
  • Solution: Mantle implements an Ethereum Layer 2 network using optimistic rollup technology to reduce fees and increase throughput. It integrates EigenLayer for security via restaking, allowing its treasury to earn yield and contribute to network validation. The ecosystem supports native governance through its token and funds development via a large DAO-managed treasury, aiming to create a self-sustaining cycle of innovation and user incentives.
  • Market Analysis: Mantle operates in the competitive Layer 2 and modular blockchain space, competing with established networks like Arbitrum, Optimism, and emerging restaking platforms. Its differentiation lies in the integration of a large treasury with restaking, aiming to bootstrap security and ecosystem growth simultaneously. Adoption is driven by developer activity, yield opportunities, and strategic partnerships within the broader Ethereum ecosystem. Market risks include execution challenges in treasury management, regulatory scrutiny on DAO structures, and strong competition from other scaling solutions. While not a market leader like Ethereum or Bitcoin, Mantle participates in the broader narrative of modular, restaked, and treasury-driven blockchains, which have gained traction in 2024-2025.

Fundamental and Technology Snapshot from Token Metrics

  • Fundamental Grade: 81.62% (Community 72%, Tokenomics 100%, Exchange 100%, VC —, DeFi Scanner 100%).
  • Technology Grade: 78.22% (Activity 64%, Repository 70%, Collaboration 71%, Security —, DeFi Scanner 100%).

Catalysts That Skew Bullish

  • Institutional and retail access expands with ETFs, listings, and integrations.
  • Macro tailwinds from lower real rates and improving liquidity.
  • Product or roadmap milestones such as upgrades, scaling, or partnerships.

Risks That Skew Bearish

  • Macro risk-off from tightening or liquidity shocks.
  • Regulatory actions or infrastructure outages.
  • Concentration or validator economics and competitive displacement.
  • Protocol-specific execution risk and competitive pressure from alternatives.

FAQs

Can MNT reach $10?

Based on the price prediction scenarios, MNT could reach $10 in the higher tiers. The 23T tier projects $12.25 in the base case, and the 31T tier shows $12.49 (bear), $16.51 (base), and $20.52 (moon). Achieving this requires both broad market cap expansion and Mantle maintaining competitive position. Not financial advice.

What's the risk/reward profile for MNT?

Risk and reward spans from $3.16 at 8T bear to $20.52 at 31T moon. Downside risks include competitive pressure among L2s and execution challenges, while upside drivers include adoption growth and liquidity expansion. Concentrated positions amplify both tails, while diversified strategies smooth outcomes.

What gives MNT value?

MNT accrues value through network usage, fees, incentives, and governance tied to Mantle's L2 ecosystem. Demand drivers include dApp activity, bridging, and security via restaking integrations. While these fundamentals matter, diversified portfolios capture value accrual across multiple tokens rather than betting on one protocol's success.

Where can I find Mantle price predictions?

Token Metrics provides comprehensive Mantle (MNT) price predictions through scenario-based analysis spanning multiple market cap tiers. Our data-driven price prediction models incorporate fundamental grades, technology scores, and market conditions to project potential MNT price targets across bear, base, and moon scenarios.

Next Steps

Disclosure

Educational purposes only, not financial advice. Crypto is volatile, concentration amplifies risk, and diversification is a fundamental principle of prudent portfolio construction. Do your own research and manage risk appropriately.

Why Investors Choose Token Metrics

Token Metrics provides data-driven crypto ratings, on-chain grades, and scenario-based targets—empowering you to make informed investment decisions with confidence. Accelerate your research with unique AI-powered analysis and risk management tools.

Research

Toncoin Price Prediction 2027: $5-$43 Target Analysis | TON

Token Metrics Team
7 min read

Toncoin Price Prediction Framework: Market Cap Scenarios & 2027 Price Forecasts

Layer 1 tokens capture value through transaction fees, staking, and validator economics. TON uses proof-of-stake and a multi-blockchain architecture integrated with Telegram services. This Token Metrics price prediction model analyzes TON price forecasts across different total crypto market sizes, reflecting adoption and transaction demand by 2027.

Disclosure

Educational purposes only, not financial advice. This price prediction analysis is for informational purposes. Crypto is volatile, do your own research and manage risk.

How to read this price prediction:

Each band blends cycle analogues and market-cap share math with TA guardrails. Base assumes steady adoption and neutral or positive macro. Moon layers in a liquidity boom. Bear assumes muted flows and tighter liquidity. These price prediction scenarios provide a range of potential outcomes based on market conditions.

TM Agent baseline:

Token Metrics TM Grade is 74%, Buy, and the trading signal is bullish, indicating positive short-term momentum and strong overall project quality. Concise 12-month numeric price prediction view: scenarios cluster roughly between $5 and $14, with a base case price target near $9.

Live details: Token Details

Key Takeaways for TON Price Prediction

  • Scenario driven: price prediction outcomes hinge on total crypto market cap; higher liquidity and adoption lift the price targets
  • Fundamentals: Fundamental Grade 80.88% (Community 83%, Tokenomics N/A, Exchange 100%, VC 84%, DeFi Scanner 85%)
  • Technology: Technology Grade 77.11% (Activity 55%, Repository 72%, Collaboration 73%, Security N/A, DeFi Scanner 85%)
  • TM Agent gist: bullish signal, price prediction ranges cluster around $5 to $14 with a base case near $9
  • Education only, not financial advice

Toncoin Price Prediction: Scenario Analysis

8T Market Cap Price Prediction:

At an 8 trillion dollar total crypto market cap, TON price prediction projects to $4.36 in bear conditions, $6.28 in the base case, and $8.20 in bullish scenarios.

16T Market Cap Price Prediction:

At 16 trillion, the price prediction range expands to $8.54 (bear), $14.30 (base), and $20.07 (moon).

23T Market Cap Price Prediction:

The 23 trillion tier price forecast shows $12.72, $22.33, and $31.94 respectively.

31T Market Cap Price Prediction:

In the maximum liquidity scenario at 31 trillion, TON price prediction reaches $16.89 (bear), $30.35 (base), or $43.80 (moon).

What Is Toncoin?

The Open Network is a blockchain designed to support fast, low-cost transactions and a scalable ecosystem of decentralized applications. It integrates with digital services and messaging platforms to reach a broad user base, emphasizing high throughput and accessibility.

TON uses a proof-of-stake consensus mechanism with a multi-blockchain architecture. The TON token powers network activity, facilitating transactions, staking, and governance, and is integrated into Telegram-based services for user-friendly in-app payments and wallets.

Token Metrics AI Analysis for Price Prediction

Token Metrics AI provides additional context on Toncoin's technical positioning and market dynamics that inform our price prediction models.

Vision: The vision for Toncoin and The Open Network is to create a fast, secure, and scalable blockchain that enables seamless digital transactions and decentralized services, accessible to millions through integration with everyday communication tools like Telegram.

Problem: Many blockchain networks face limitations in speed, cost, and user accessibility, hindering mainstream adoption. Toncoin aims to address the friction of slow transaction times and high fees seen on older networks, while also lowering the barrier to entry for non-technical users who want to engage with decentralized applications and digital assets.

Solution: TON uses a proof-of-stake consensus mechanism with a multi-blockchain architecture to achieve high scalability and fast finality. The network supports smart contracts, decentralized storage, and domain naming, enabling a wide range of applications. Toncoin facilitates transactions, staking, and network governance, and is integrated into Telegram-based services, allowing for in-app payments and wallet functionality through user-friendly interfaces.

Market Analysis: Toncoin operates in the competitive layer-1 blockchain space, often compared to high-performance networks like Solana and Avalanche, though it differentiates itself through deep integration with Telegram's ecosystem. Its potential for mass adoption stems from access to hundreds of millions of Telegram users, which could drive network effects and utility usage. Unlike meme tokens, Toncoin's value is tied to infrastructure and real-world application rather than speculation or community hype. However, its growth depends on sustained development, regulatory clarity, and actual user engagement within Telegram. Competition from established blockchains and shifting market narratives around scalability and decentralization remain key risks. As a top-tier blockchain by ecosystem potential, Toncoin's market position is influenced more by integration milestones and user adoption than direct price dynamics.

Fundamental and Technology Snapshot from Token Metrics

  • Fundamental Grade: 80.88% (Community 83%, Tokenomics N/A, Exchange 100%, VC 84%, DeFi Scanner 85%)
  • Technology Grade: 77.11% (Activity 55%, Repository 72%, Collaboration 73%, Security N/A, DeFi Scanner 85%)

Catalysts That Skew Bullish for Price Prediction

  • Institutional and retail access expands with ETFs, listings, and integrations
  • Macro tailwinds from lower real rates and improving liquidity
  • Product or roadmap milestones such as upgrades, scaling, or partnerships
  • These factors could push TON toward higher price prediction targets

Risks That Skew Bearish for Price Prediction

  • Macro risk-off from tightening or liquidity shocks
  • Regulatory actions or infrastructure outages
  • Concentration in validator economics and competitive displacement
  • These factors could push TON toward lower price prediction scenarios

FAQs: Toncoin Price Prediction

How does TON accrue value?Value accrual mechanisms include transaction fees, validator staking rewards, and governance alignment described for TON in the documentation. As Toncoin usage grows through transactions and user activity, TON can capture network fees and staking yields while coordinating governance. Effectiveness depends on sustained adoption and network throughput, which directly impacts long-term price prediction models.

What price could TON reach in the moon case price prediction?Moon case price predictions range from $8.20 at 8T to $43.80 at 31T total crypto market cap. These price prediction scenarios require maximum market cap expansion and strong network adoption with robust liquidity conditions. Not financial advice.

What is the 2027 Toncoin price prediction?Based on Token Metrics analysis, the 2027 price prediction for Toncoin clusters between $5 and $14 in the base case, with potential for higher targets ($20-$43) in bullish scenarios if the total crypto market expands significantly.


Next Steps

Track live grades and signals: Token Details

Secure your TON with Ledger

Disclosure

Educational purposes only, not financial advice. Crypto is volatile, do your own research and manage risk.

How Token Metrics Can Help

Token Metrics combines fundamental, technical, and on-chain AI-powered analysis for actionable ratings, signals, and research. Use our data platform for scenario-based investing, backtested grades, and bespoke insights for digital asset markets.

Choose from Platinum, Gold, and Silver packages
Reach with 25–30% open rates and 0.5–1% CTR
Craft your own custom ad—from banners to tailored copy
Perfect for Crypto Exchanges, SaaS Tools, DeFi, and AI Products