Back to blog
Crypto Basics

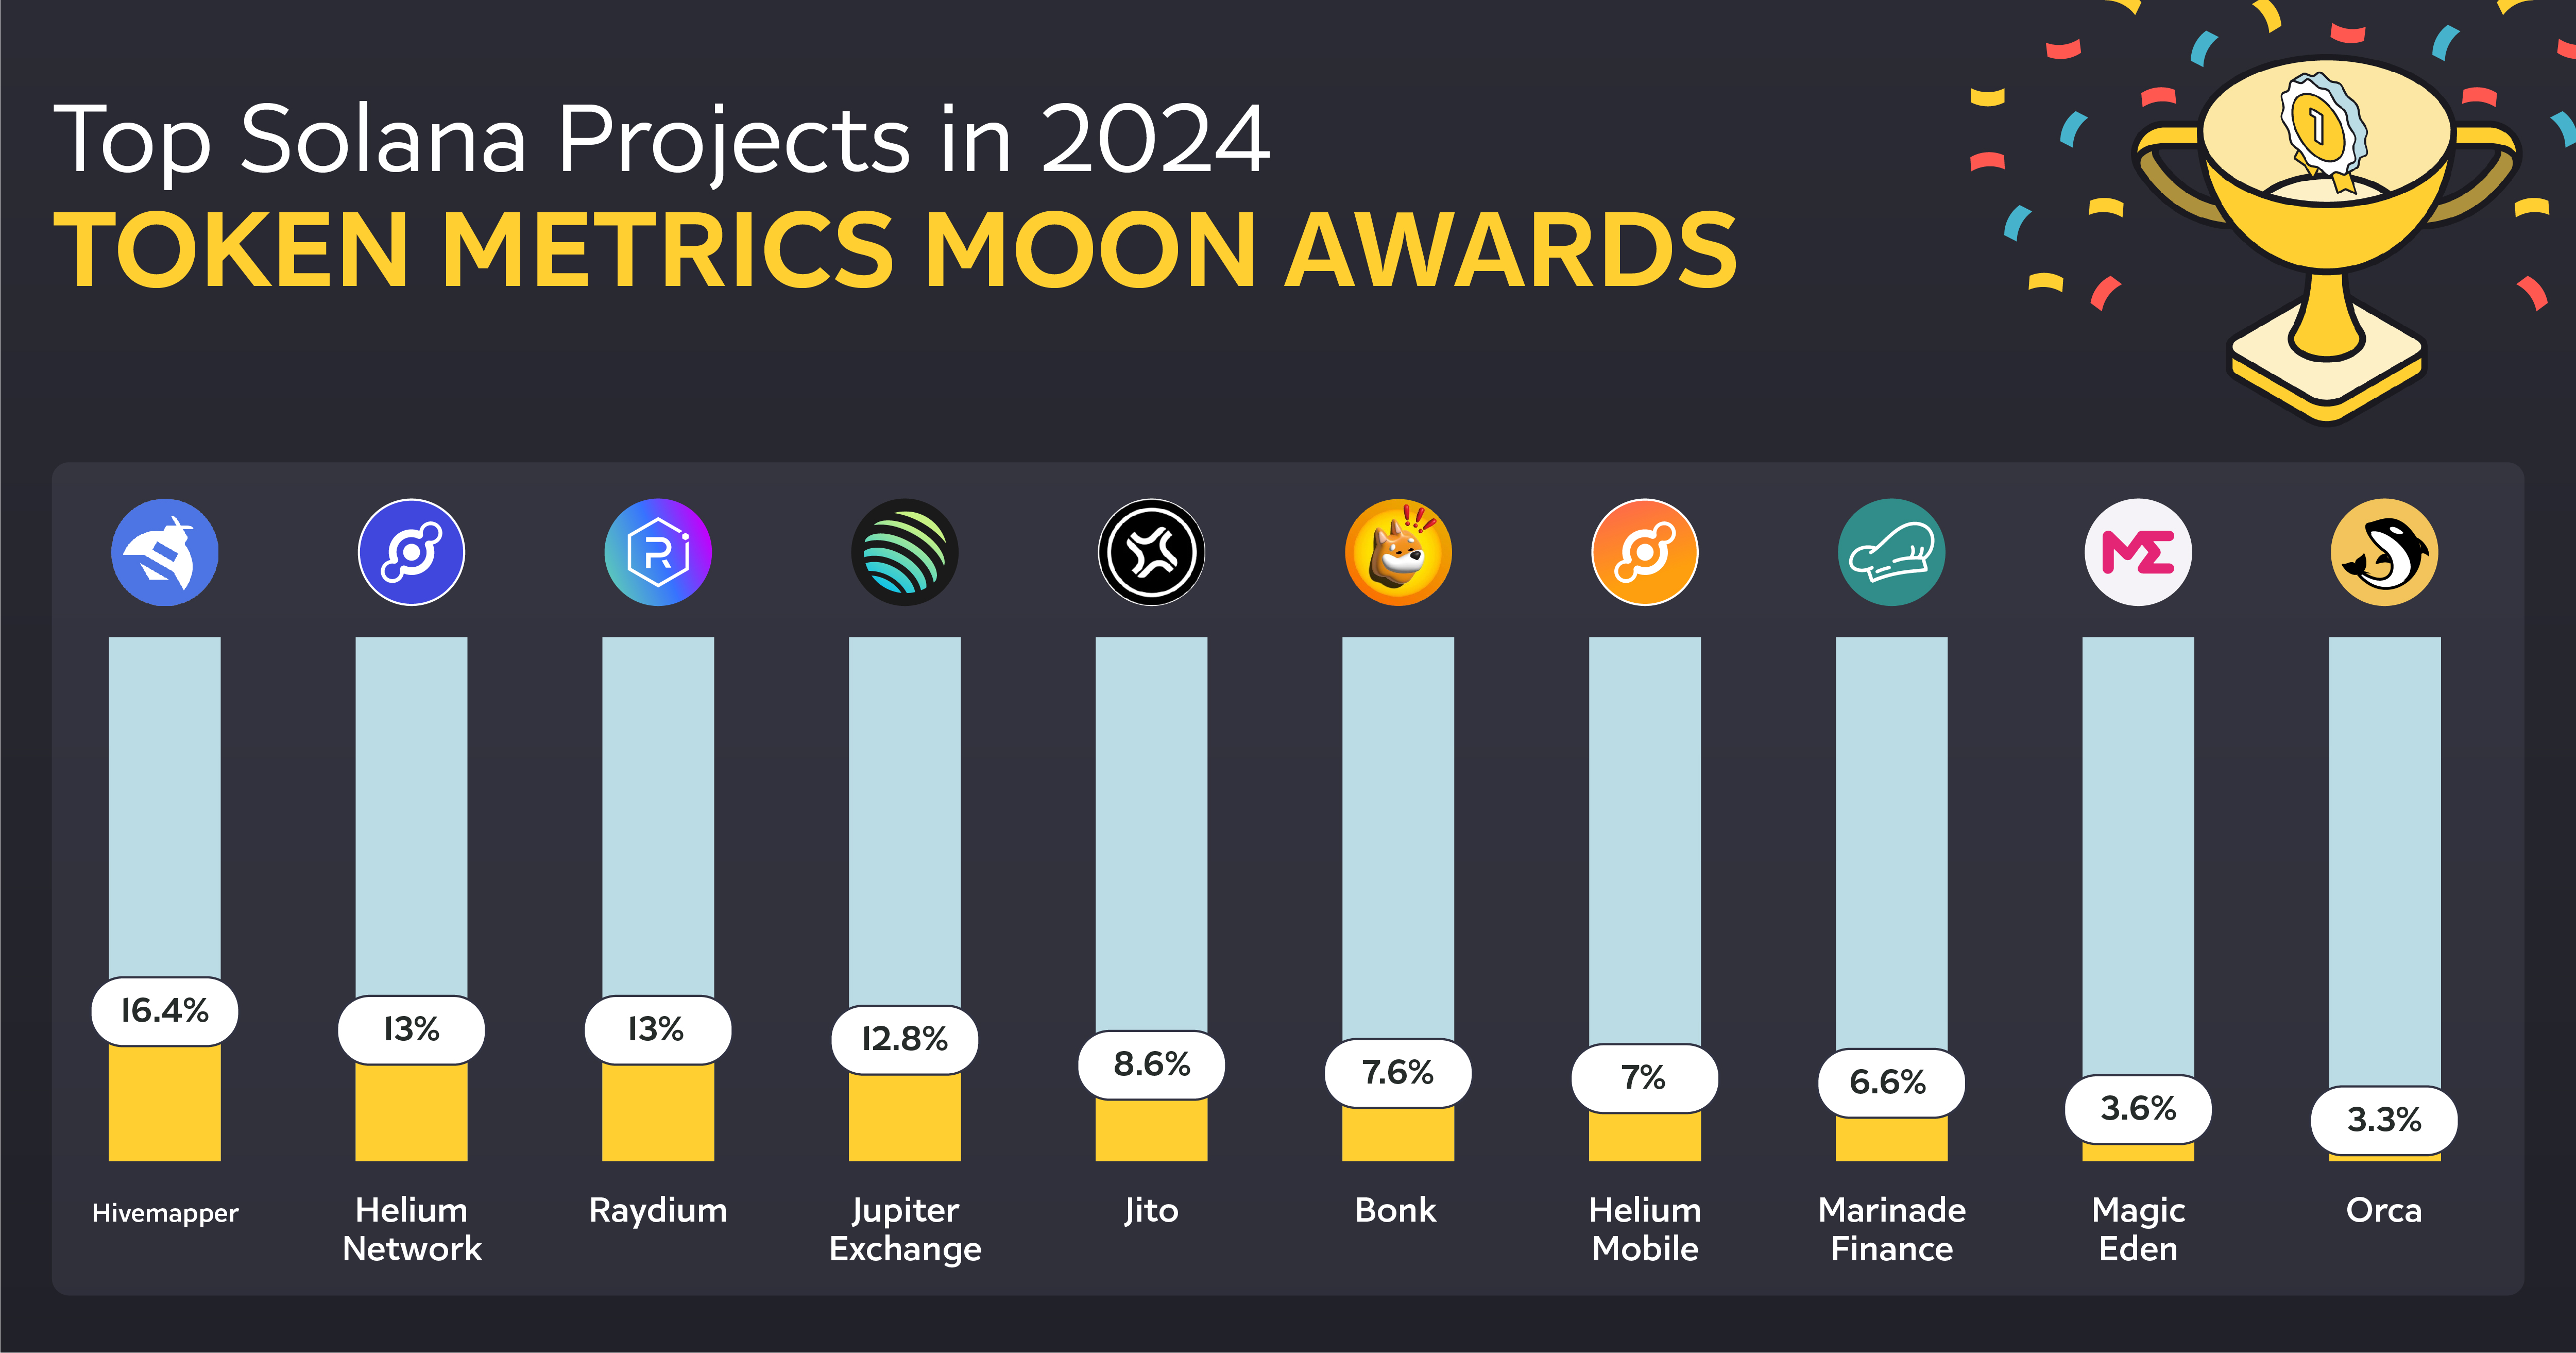
Top Solana Projects in 2024 - Token Metrics Moon Awards

Discover the top Solana projects of 2024 at the Token Metrics Moon Awards. Uncover the best in Solana innovation and investment potential.
Token Metrics Team
12 Minutes
Want Smarter Crypto Picks—Free?
See unbiased Token Metrics Ratings for BTC, ETH, and top alts.
Thank you! Your submission has been received!
Oops! Something went wrong while submitting the form.
 No credit card | 1-click unsubscribe

Welcome to the Token Metrics Moon Awards, a prestigious cryptocurrency industry accolade that recognizes platforms, projects, and initiatives that have significantly impacted the industry. The latest addition to the Moon Awards is the "Top Solana Projects in 2024."

Selection Process

At Token Metrics, we emphasize our audience, considering them the foundation of our operations. Our selection process is firmly rooted in engaging with the community, ensuring that our awards' results authentically reflect crypto enthusiasts' sentiments and experiences.

Through engagement with our community members, we have compiled a comprehensive list of the Top Solana Projects in 2024 based on extensive survey data and user votes.

This article aims to provide a comprehensive guide to the top Solana projects in 2024, showcasing their contributions to the ecosystem's growth despite facing challenges. 

Through an in-depth exploration, we will uncover how these projects drive innovation, the technological advancements they bring, and their role in shaping the future of decentralized applications on Solana.

Solana Ecosystem Overview

Solana's ecosystem is rapidly evolving, with several competitive advantages propelling it to the forefront of blockchain technology. Notably, its ability to process transactions quickly and cheaply has made it a popular choice for developers and investors alike. Some of the highlights include:

Competitive Advantages:

  • Cheap transactions
  • Faster processing speed
  • Growing meme coins contributing to network activity

Resurgence and Growth:

  • Price recovery and zero network outages since February 2023
  • Over 125 protocols, handling 100 million transactions daily
  • Increased attention from investors and developers, especially in Decentralized Physical Infrastructure (DePIN)

These elements underscore Solana's robust and dynamic ecosystem, setting the stage for its continued growth and innovation in 2024.

List of Top Solana Projects in 2024

Delving into the bustling Solana ecosystem for 2024, we uncover a spectrum of projects that stand out for their innovation, utility, and contribution to the blockchain space.

Top Solana Projects
Image Source - Token Metrics Moon Awards

These projects span various domains, including decentralized exchanges (DEXs), lending protocols, NFT marketplaces, and more, showcasing the versatility and robustness of the Solana network.

Here's a closer look at some of the top Solana projects set to make significant impacts in 2024:

1. Hivemapper

In the Moon Awards survey, Hivemapper secured the top position with 16.4% of the total votes.

Hivemapper emerges as a revolutionary force within the Solana ecosystem, championing the cause of decentralized mapping. This crypto-enabled dashcam project is not just about mapping the world; it's about reimagining who owns and contributes to that map. 

With nearly 140 million kilometers mapped across 2,503 regions worldwide, Hivemapper exemplifies the shift from traditional, centralized mapping services to a more democratic, user-driven approach. 

This transformation is pivotal for accurate, up-to-date maps essential for navigation and urban planning.

Key Features and Innovations:

  • Decentralized Mapping: Leveraging the Solana blockchain, it offers a democratic way for global contributors to participate in map creation and updates.
  • Comprehensive Coverage: The project maps nearly 140 million kilometers, covering 2,503 regions globally.
  • Reward System: Contributors are rewarded for their input, with the full reward opportunity for every road reset every 7 days, encouraging continuous updates.

Hivemapper's technological backbone is equally impressive. The platform employs its in-house built Titan engine for processing massive datasets. This engine executes sensor fusion, machine learning/computer vision processing, and crowd consensus review and ensures the continuity of network data. 

Furthermore, Hivemapper is pioneering in hardware development, working with multiple partners in the United States to build dashcams that collect 4K imagery and various telemetry data, all encrypted for security. 

2. Helium Network

In the Moon Awards survey, Helium Network secured the 2nd position with 13% of the total votes.

The Helium Network, under the stewardship of the Helium Foundation, represents a paradigm shift in decentralized wireless technologies. Established in 2021, this US-based non-profit organization is at the forefront of protocol governance and the technical evolution of the Helium Network. 

It's instrumental in educating the public about the advantages of decentralized wireless networks and fostering a vibrant community of network builders, users, and developers.

Key Aspects of the Helium Network:

  • Foundation's Role: The Helium Foundation is central to driving the network's codebase and operations, ensuring a seamless experience for all stakeholders involved. It's committed to expanding public awareness and enhancing the network's utility through innovative use cases.
  • Membership Program: Encompassing Hardware Manufacturers, Network Operators, Service Providers, and Application Developers, the program is set to open its doors to individual enthusiasts, including Hotspot hosts, in 2024.
  • Migration to Solana: A significant milestone was the network's migration to Solana in April 2023, which brought substantial performance and scalability improvements. This move has also paved the way for the network to delve into the mobile and IoT sectors, with initiatives allowing users to earn tokens by supporting the network.

The Helium Network's journey through 2023 into 2024, marked by a 500% surge following its venture into mobile services, reflects its growing influence within the Solana ecosystem. 

With the Helium Wallet now supporting all tokens on the Solana blockchain, the network is poised for further expansion, leveraging the DePIN project to offer decentralized connectivity services. 

3. Raydium

In the Moon Awards survey, Raydium secured the 3rd position with 13% of the total votes.

Raydium stands as a pivotal Solana project, acting as a bridge between the worlds of decentralized finance (DeFi) and automated market makers (AMMs)

This platform has carved out a niche for itself within the Solana ecosystem by offering a suite of financial services that cater to both novice and seasoned crypto enthusiasts.

Key Features and Innovations:

  • AMM Protocol: At its core, Raydium leverages the power of Solana's high-speed blockchain to facilitate lightning-fast trades and transactions. This not only enhances user experience but also contributes to the overall liquidity of the Solana ecosystem.
  • Dual Functionality: Raydium functions as both an AMM and a liquidity provider to the Serum DEX, Solana's premier decentralized exchange. This unique positioning allows Raydium users to access the vast liquidity and wide range of trading pairs available on Serum.

Technological Advancements:

  • High Throughput: Utilizing Solana's capability of processing thousands of transactions per second, Raydium offers a seamless and efficient trading experience.
  • Yield Farming: Raydium introduces users to yield farming opportunities, enabling them to earn rewards by providing liquidity to various pools.

4. Jupiter Exchange

In the Moon Awards survey, Jupiter Exchange secured the 4th position with 12.8% of the total votes.

Jupiter Exchange (JUP) is a cutting-edge swap aggregator within the vibrant Solana ecosystem. It harnesses Solana's speed and efficiency to offer various advanced trading features, making it a standout choice for traders seeking flexibility and depth in their trading strategies. Here's a closer look at what makes Jupiter Exchange a notable Solana project:

Advanced Trading Features:

  • Dollar Cost Averaging (DCA): Allows users to spread their investment over time, reducing the impact of volatility.
  • Limit Orders: Users can set specific price points at which their trades automatically execute, offering greater control over trading outcomes.
  • Perpetual Trading: Provides the opportunity for traders to engage in contracts that do not have an expiry date, enhancing trading flexibility.

Jupiter's commitment to efficiency, low transaction costs, and innovative offerings like swap services and perpetual exchange capabilities, coupled with a significant daily trading volume of $400 million and 90,000 unique wallets, underscores its importance within the Solana projects landscape. 

5. Jito

In the Moon Awards survey, Jito secured the 5th position with 8.6% of the total votes.

In the vibrant Solana ecosystem, Jito stands as a beacon of innovation, particularly in the space of high-frequency trading on decentralized exchanges. 

This Solana project is meticulously designed to address the common pain points encountered in decentralized finance (DeFi), offering solutions that significantly enhance trading efficiency and user experience.

High-Frequency Trading Capabilities:

  • Jito utilizes the Solana blockchain's high throughput and low latency to facilitate high-frequency trading, a feature traditionally reserved for centralized financial markets.
  • This allows traders to execute orders at lightning speed, capitalizing on market movements in real time.

Slippage Reduction:

  • One of the platform's key innovations is its ability to drastically reduce slippage, a common issue that traders face in less liquid markets.
  • By aggregating liquidity across multiple sources, Jito ensures that trades are executed at the most favorable prices, minimizing the cost impact on large orders.

Its emphasis on speed, efficiency, and reduced slippage positions Jito as a critical player among Solana projects, pushing the boundaries of what's possible in the realm of decentralized trading.

6. Bonk

In the Moon Awards survey, Bonk secured the 6th position with 7.6% of the total votes.

Bonk (BONK), a meme coin within the Solana ecosystem, has captured the attention of the cryptocurrency market with its significant traction. 

BONKrewards by ArmadaFi: This initiative allows users to lock BONK for rewards, driving adoption and utility within the Solana ecosystem.

Competition and Roadmap: Facing competition from other meme coins, Bonk's development roadmap, and the team's efforts could influence investor sentiment and its market position.

Bonk's deflationary nature, with over 65% of its total circulating supply burnt, alongside a 10,000% gain in 2023, underscores its status as the hottest meme coin of 2024. 

The Bonk DAO's investment in early-stage startups and the engaging Bonk March Madness event further highlight its community-driven approach and innovative use within the Solana projects landscape.

7. Helium Mobile

In the Moon Awards survey, Helium Mobile secured the 7th position with 7% of the total votes.

Helium Mobile's integration into the Solana ecosystem marks a significant leap forward in decentralized wireless communication, offering users an innovative and expansive service. 

With the Helium Wallet's upgrade to support a wide range of digital assets on the Solana blockchain, users gain a streamlined experience in managing their Solana-based tokens. 

This move not only enhances the utility of the Helium Wallet but also demonstrates Helium's dedication to embracing crypto diversity. The exclusive Pixel NFT, available in the "Badges" tab, rewards users for their engagement, adding a unique element to the user experience.

Key Developments:

  • Coinbase Support: Helium Mobile's full support of Coinbase for trading amplifies its accessibility and potential for widespread adoption.
  • Growth Metrics: The remarkable growth, evidenced by 12,398 active 5G nodes and a surge in new subscribers, indicates a rapidly expanding user base, with projections suggesting nearly 530,000 new subscribers within the year.

Helium Mobile's strategic adjustments to mining rules and the relationship between MOBILE and HNT tokens showcase a thoughtful approach to maintaining a balanced supply-demand dynamic. 

8. Marinade Finance

In the Moon Awards survey, Marinade Finance secured the 8th position with 6.6% of the total votes.

Marinade Finance simplifies the concept of staking on the Solana blockchain, offering users an innovative approach to maximize their returns. 

By automating the staking process across over 100 top-performing validators and providing an automated rebalancing feature, Marinade ensures that users' SOL is always working hard for them. 

This automation not only optimizes returns but also democratizes access to high-quality staking opportunities, previously only available to those with extensive blockchain knowledge.

Key features that set Marinade Finance apart include:

  • Instant Unstake: Users can exit their stake positions instantly at the best available price, offering unparalleled flexibility in managing their investments.
  • Liquid Staking: By unlocking the liquidity of staked SOL, Marinade enables users to participate in DeFi, further enhancing the utility of their assets.
  • mSOL Receipt Token: Depositing staked SOL with Marinade issues users an mSOL token, a fungible asset that can be used as collateral across various DeFi projects.

Moreover, Marinade Finance provides a comprehensive platform for users to review and understand the performance of Solana validators. Utilizing a detailed scoring system, it ranks validators based on yield economics, block production, and stake concentration, ensuring transparency and informed decision-making. 

9. Magic Eden

In the Moon Awards survey, Magic Eden secured the 9th position with 3.6% of the total votes.

Magic Eden has established itself as a premier NFT marketplace within the Solana ecosystem, facilitating the buying, selling, and discovering unique digital assets across multiple blockchains. Several key features underscore its significance:

User and Creator Benefits:

  • User-Friendly Interface: Ensures an intuitive navigation experience.
  • Minimal Fees & Flexible Royalties: A 2% transaction fee for buyers and sellers, with optional royalty alchemy for creators.
  • Magic Eden Wallet: Acts as a multi-purpose web3 navigator for storing crypto assets and interacting with NFTs.

Supported Blockchains and Collections:

  • Blockchains: Solana, Ethereum, Polygon, and Bitcoin (Ordinals).
  • Hot Collections Highlighted: Includes NodeMonkes, Bored Ape Yacht Club, Transdimensional Fox Federation, and Trump Digital Trading Cards, among others.

Magic Eden's blend of extensive collection, low transaction fees, and a user-friendly interface positions it as a hub for artists, creators, and enthusiasts from various blockchain backgrounds.

10. Orca

In the Moon Awards survey, Orca secured the 10th position with 3.3% of the total votes.

Orca emerges as a standout Concentrated Liquidity Automated Market Maker (AMM) on the Solana Network, designed to optimize the trading experience for both liquidity providers and traders. It achieves this through several innovative features and community-driven governance:

Concentrated Liquidity AMM:

  • Liquidity providers can specify price ranges for their tokens, enhancing capital efficiency.
  • A share of trading fees generated on the platform is an incentive, promising higher returns.

Community Governance:

  • Governed by the Orca DAO and the DAO council, utilizing the ORCA token for decision-making.
  • ORCA token is accessible on major exchanges like Kucoin, Gate, and Coinbase, ensuring wide availability.

Orca's platform is not just about trading; it's about creating a comprehensive ecosystem for DeFi activities on Solana. Key features include:

  • Whirlpools: For concentrated liquidity, allowing for higher returns and lower slippage.
  • DCA Feature & Decentralized Perpetuals Trading Platform: Offers up to 100x leverage, catering to various trading strategies.
  • User-Friendly Interface: Ensures minimal transaction fees and lower latency than Ethereum-based DEXs, alongside a fair price guarantee.

Conclusion

Throughout this exploration of Solana's diverse and dynamic ecosystem, we've delved into the vast potential and innovation displayed by leading Solana projects set to shape the blockchain frontier in 2024. 

From the decentralized mapping marvels of Hivemapper to the financial ingenuity of Orca, each project brings its unique contributions, marking Solana's unwavering position in the digital space. 

These endeavors not only illuminate the robust capabilities of the Solana blockchain in supporting high-speed, cost-effective applications, but they also underline the ecosystem's versatility across various domains, including DeFi, wireless communication, NFT marketplaces, and beyond.

Disclaimer

The information provided on this website does not constitute investment advice, financial advice, trading advice, or any other advice, and you should not treat any of the website's content as such.

Token Metrics does not recommend buying, selling, or holding any cryptocurrency. Conduct your due diligence and consult your financial advisor before making investment decisions.

Build Smarter Crypto Apps &
AI Agents in Minutes, Not Months
Real-time prices, trading signals, and on-chain insights all from one powerful API.
Grab a Free API Key
About Token Metrics
Token Metrics: AI-powered crypto research and ratings platform. We help investors make smarter decisions with unbiased Token Metrics Ratings, on-chain analytics, and editor-curated “Top 10” guides. Our platform distills thousands of data points into clear scores, trends, and alerts you can act on.
30 Employees
analysts, data scientists, and crypto engineers
Daily Briefings
concise market insights and “Top Picks”
Transparent & Compliant
Sponsored ≠ Ratings; research remains independent
Want Smarter Crypto Picks—Free?
See unbiased Token Metrics Ratings for BTC, ETH, and top alts.
Thank you! Your submission has been received!
Oops! Something went wrong while submitting the form.
 No credit card | 1-click unsubscribe
Token Metrics Team
Token Metrics Team

Recent Posts

Research

Why AI Makes All the Difference: The Technology Advantage Behind Token Metrics Crypto Indices

Token Metrics Team
12 min read

When evaluating cryptocurrency index providers, most investors focus on past performance, fees, or token selection. While these factors matter, they miss the fundamental differentiator determining long-term success: the sophistication of artificial intelligence powering portfolio management.

Token Metrics doesn't just use AI as marketing buzzword—the platform employs cutting-edge machine learning systems that fundamentally outperform human decision-making in ways that compound into extraordinary advantages over time. Understanding why AI-driven indices surpass both traditional approaches and human-managed alternatives reveals why this technology represents the future of crypto investing.

This comprehensive guide explores the specific AI technologies powering Token Metrics indices, examines what these systems can do that humans cannot, compares AI-driven approaches to traditional alternatives, and reveals how technological advantages translate into superior investment outcomes.

The Limitations of Human Crypto Portfolio Management

Before understanding AI's advantages, recognize the inherent limitations of human portfolio management in cryptocurrency markets.

Information Processing Constraints

The human brain processes information sequentially and slowly. A skilled analyst might evaluate 10-20 cryptocurrencies daily using 5-10 data points each. This yields 50-200 data points daily—a tiny fraction of available information.

Token Metrics' AI analyzes 6,000+ cryptocurrencies using 80+ data points each—480,000+ data points daily. This 2,400x information processing advantage means the AI identifies opportunities and risks invisible to human analysis.

Cognitive Biases Distort Judgment

Human decision-making suffers from systematic cognitive biases:

  • Confirmation Bias: Seeking information supporting existing beliefs while dismissing contradictory evidence
  • Recency Bias: Overweighting recent events while underweighting historical patterns
  • Anchoring Bias: Fixating on initial information (like purchase price) rather than current reality
  • Herding Bias: Following crowd behavior rather than independent analysis
  • Overconfidence Bias: Believing personal judgment exceeds actual accuracy

These biases cause systematic errors leading to poor timing, holding losers too long, selling winners prematurely, and following crowds into overvalued assets. AI systems have no cognitive biases—they evaluate data objectively based on mathematical relationships.

Emotional Volatility Undermines Discipline

Human portfolio managers experience fear during market crashes and euphoria during rallies. These emotions trigger fight-or-flight responses overwhelming rational analysis, causing panic selling at bottoms and overconfident buying at tops.

AI experiences no emotions. Market crashes don't trigger fear. Rallies don't create euphoria. The system evaluates probabilities and executes strategies mechanically regardless of market sentiment.

Physical and Mental Limitations

Humans require sleep, breaks, vacations, and time for other life activities. Portfolio managers cannot monitor markets 24/7 or maintain consistent attention over years without degradation.

AI operates continuously without fatigue, monitoring global markets across time zones simultaneously. The system never sleeps, never takes vacations, never loses focus—maintaining perpetual vigilance impossible for humans.

Inability to Learn from All Data

Human learning occurs slowly through experience and study. A portfolio manager might learn from hundreds of trades over decades, building intuition from limited personal experience.

AI learns from millions of data points across thousands of assets simultaneously. Every market movement, every token launch, every sentiment shift contributes to model training. The system identifies patterns across entire crypto history that individual humans could never detect.

The Specific AI Technologies Powering Token Metrics

Token Metrics employs an ensemble of sophisticated machine learning models, each serving specific purposes within the investment process.

Gradient Boosting Decision Trees

These models excel at identifying complex, non-linear relationships between variables. In crypto markets, simple linear relationships rarely exist—token performance depends on intricate interactions between multiple factors.

Gradient boosting builds thousands of decision trees, each learning from previous trees' errors. This iterative process creates highly accurate predictions by combining many weak predictors into strong aggregate models.

Application: Identifying which combinations of technical, fundamental, and sentiment factors predict future price movements most accurately.

Recurrent Neural Networks (RNNs)

RNNs specialize in time-series analysis, recognizing patterns in sequential data. Cryptocurrency prices represent time-series data where past patterns influence future movements.

Unlike simple technical analysis looking at individual indicators, RNNs identify complex temporal relationships spanning multiple timeframes simultaneously. The networks detect subtle patterns in how prices, volumes, and other metrics evolve together over time.

Application: Forecasting price trajectories by learning from historical patterns while adapting to changing market dynamics.

Random Forests

Random forest algorithms create multiple decision trees using random subsets of data and features, then aggregate their predictions. This approach reduces overfitting risk—where models perform excellently on historical data but fail on new data.

By training on different data subsets, random forests identify robust patterns that generalize well rather than memorizing specific historical sequences unlikely to repeat exactly.

Application: Robust token classification separating quality projects from low-quality alternatives based on generalizable characteristics.

Natural Language Processing (NLP)

NLP algorithms analyze text data from social media, news articles, developer communications, and community forums. These systems extract sentiment, identify trending topics, detect narrative shifts, and quantify community engagement.

Unlike humans who might read dozens of articles weekly, NLP processes millions of text sources daily, identifying sentiment patterns and narrative changes before they become obvious.

Application: Gauging market sentiment, detecting emerging narratives, identifying coordinated pumps or manipulative campaigns, and assessing community health.

Anomaly Detection Frameworks

Anomaly detection identifies unusual patterns suggesting either opportunities or risks. These systems establish baseline "normal" behavior, then flag deviations warranting attention.

In crypto markets, anomalies might indicate insider trading before announcements, coordinated manipulation schemes, security vulnerabilities, or emerging trends before mainstream recognition.

Application: Early warning systems for security threats, manipulation detection, and identifying breakout candidates showing unusual strength relative to historical patterns.

What AI Can Do That Humans Cannot

Understanding specific capabilities unique to AI reveals why technology-driven approaches surpass traditional methods.

Simultaneous Multi-Asset Analysis

Human portfolio managers analyze assets sequentially—evaluating Bitcoin, then Ethereum, then Solana, one at a time. This sequential processing misses relationships between assets.

AI analyzes all assets simultaneously, identifying correlations, relative strength patterns, sector rotations, and cross-asset opportunities. The system recognizes when DeFi tokens strengthen relative to Layer-1s, when memecoins show coordinated movement, or when specific sectors lead or lag broader markets.

This simultaneous analysis reveals relative value opportunities invisible to sequential human analysis.

Pattern Recognition Across Massive Datasets

Humans excel at recognizing simple patterns—support and resistance levels, head-and-shoulders formations, moving average crossovers. However, complex multi-dimensional patterns exceed human cognitive capacity.

AI identifies patterns involving dozens of variables simultaneously across thousands of assets. These patterns might involve specific combinations of technical indicators, on-chain metrics, sentiment scores, and fundamental factors that human analysts could never process holistically.

Example: The AI might recognize that tokens with specific combinations of technical momentum, developer activity growth, and social sentiment shifts outperform 73% of the time over subsequent 30 days. Humans cannot track and validate such complex multi-factor patterns.

Emotionless Execution During Extremes

The most valuable investment opportunities occur during market extremes when fear or greed overwhelm rational analysis. Humans struggle maintaining discipline during these periods—buying during maximum fear feels terrifying, selling during euphoria seems foolish.

AI executes mechanically based on statistical probabilities regardless of market sentiment. When indicators show extreme fear and historically attractive valuations, the system buys aggressively. When indicators show extreme euphoria and overvaluation, the system takes profits systematically.

This emotionless execution during extremes generates substantial alpha that humans rarely capture despite understanding the principle intellectually.

Continuous Learning and Adaptation

Human learning occurs slowly. Portfolio managers develop strategies based on historical experience, but adapting to new market regimes takes time and often requires painful losses first.

AI learns continuously from every market movement. When strategies underperform, the system adjusts weightings automatically. When new patterns emerge, the AI incorporates them immediately. This perpetual learning ensures strategies evolve with markets rather than becoming obsolete.

Microsecond Response Times

Markets move in milliseconds. By the time humans notice significant price movements and decide how to respond, opportunities have passed.

AI monitors markets continuously and responds within microseconds. When rebalancing signals trigger or new opportunities emerge, execution occurs immediately rather than after human deliberation delays.

This speed advantage proves especially valuable during volatile periods when opportunities appear and disappear rapidly.

Comparing AI-Driven Indices to Traditional Alternatives

Understanding Token Metrics' AI advantages becomes clearer through direct comparison with traditional approaches.

Vs. Market-Cap-Weighted Indices: Traditional indices simply track largest cryptocurrencies by size, overexposing to overvalued bubbles and missing emerging opportunities. Token Metrics' AI evaluates fundamentals, momentum, and valuations, overweighting undervalued opportunities regardless of size.

Vs. Human-Managed Crypto Funds: Traditional funds employ analyst teams covering 50-100 tokens maximum, influenced by cognitive biases, charging 2% management and 20% performance fees. Token Metrics covers 6,000+ tokens without biases or emotions at subscription fees far lower than traditional management costs.

Vs. DIY Individual Selection: Individual investors face time constraints, limited professional tools, emotional attachment preventing objectivity, and FOMO-driven poor timing. AI provides comprehensive analysis using professional data, objective evaluation, and systematic timing based on probabilities.

How AI Advantages Translate to Superior Returns

Understanding theoretical AI advantages is useful, but what matters most is how these translate into actual superior investment performance.

Earlier Opportunity Identification

AI identifies emerging opportunities before they become obvious to human investors. By analyzing on-chain activity, developer engagement, and early sentiment shifts, the system detects promising tokens months before mainstream attention arrives.

Result: Index positions established at significantly lower prices capture maximum appreciation when opportunities materialize.

Superior Risk Management

AI's anomaly detection and comprehensive analysis identify risks earlier than human analysis. Security vulnerabilities, team problems, tokenomics issues, or manipulation schemes trigger early warning systems.

Result: Positions reduced or eliminated before major problems cause catastrophic losses, preserving capital for better opportunities.

Optimal Rebalancing Timing

The system identifies optimal rebalancing timing based on technical signals, sentiment extremes, and volatility patterns. Rather than rebalancing on arbitrary schedules, the AI rebalances when conditions offer maximum advantage.

Result: Systematic "buy low, sell high" execution that human emotion prevents, generating additional alpha through superior timing.

Diversification Optimization

AI constructs portfolios maximizing diversification benefits through correlation analysis across all tokens. Rather than naive diversification holding many similar assets, the system combines tokens with complementary characteristics.

Result: Smoother return profiles with superior risk-adjusted performance through true diversification rather than false variety.

Compound Learning Effects

Every market cycle improves AI performance through additional training data. Each bull market, bear market, and consolidation phase provides data points refining model accuracy.

Result: Performance improving over time rather than degrading as with human strategies that become obsolete when markets evolve.

The Future of AI-Driven Crypto Investing

AI technology continues advancing rapidly, suggesting Token Metrics' advantages will expand over time:

  • Advanced Neural Architectures: Emerging technologies like transformers offer superior pattern recognition capabilities
  • Real-Time On-Chain Analysis: AI analyzing blockchain transactions identifies smart money movements and whale behavior
  • Cross-Market Intelligence: Integration with traditional markets, macroeconomics, and geopolitics creates comprehensive models
  • Personalized Optimization: Future AI could create personalized indices tailored to individual preferences while maintaining professional management

Practical Implications for Investors

Understanding AI advantages has direct practical implications:

  • Accept AI Superiority: Recognize that outperforming sophisticated AI through individual selection is increasingly difficult. Strategic allocation to AI-driven indices becomes increasingly rational.
  • Focus Human Energy Wisely: Concentrate on risk tolerance, emotional discipline, and strategic allocation—areas where humans add value—rather than token selection where AI excels.
  • Trust Uncomfortable Recommendations: The system identifies opportunities before they become obvious. Buy when it feels scary, sell when it feels premature.
  • Recognize Competitive Disadvantage: As capital flows into AI-driven strategies, traditional approaches face increasing disadvantage. Early adoption provides compounding advantages.

Conclusion: The Inevitable Future

Artificial intelligence represents the future of cryptocurrency portfolio management not because it's trendy—because it's fundamentally superior. The information processing, pattern recognition, emotionless execution, and continuous learning capabilities of modern AI exceed human limitations by orders of magnitude.

Token Metrics doesn't just use AI as marketing—the platform employs institutional-grade machine learning providing genuine competitive advantages translating into measurably superior risk-adjusted returns.

The choice facing crypto investors is straightforward: compete against sophisticated AI systems using human limitations, or harness those same AI capabilities through Token Metrics indices. One approach fights the future; the other embraces it.

As AI technology continues advancing and more capital recognizes these advantages, the performance gap between AI-driven and traditional approaches will widen. Early adopters of superior technology capture outsized returns, while late adopters play catch-up from positions of disadvantage.

Your opportunity exists today. Token Metrics provides access to institutional-grade AI previously available only to hedge funds and professional investors. The democratization of artificial intelligence through accessible indices transforms crypto investing from speculation into systematic wealth building.

Begin your 7-day free trial and experience firsthand how artificial intelligence transforms cryptocurrency investing from emotional gambling into disciplined, technology-driven wealth creation.

Research

Bitcoin Cash Price Prediction 2028: Payment-Focused Layer 1 Analysis

Token Metrics Team
7 min read

Market Context for Bitcoin Cash Price Prediction: The Case for 2028

The Layer 1 landscape is consolidating as users and developers gravitate to chains with clear specialization. Bitcoin Cash positions itself as a payment-focused chain with low fees and quick settlement for everyday usage.

The Bitcoin Cash price prediction scenario projections below map potential outcomes for BCH across different total crypto market sizes. Base cases assume steady usage and listings, while moon scenarios factor in stronger liquidity and accelerated adoption. Our comprehensive price prediction framework provides investors with data-driven forecasts for strategic decision-making.


Disclosure

Educational purposes only, not financial advice. Crypto is volatile, do your own research and manage risk.

How to Read This BCH Price Prediction

Each band blends cycle analogues and market-cap share math with TA guardrails. Base assumes steady adoption and neutral or positive macro. Moon layers in a liquidity boom. Bear assumes muted flows and tighter liquidity.

TM Agent baseline: Token Metrics lead metric for Bitcoin Cash, cashtag $BCH, is a TM Grade of 54.81%, which translates to Neutral, and the trading signal is bearish, indicating short-term downward momentum. This implies Token Metrics views $BCH as mixed value long term in our price prediction models: fundamentals look strong, while valuation and technology scores are weak, so upside depends on improvements in adoption or technical development. Market context: Bitcoin has been setting market direction, and with broader risk-off moves altcoins face pressure, which increases downside risk for $BCH in the near term.

Live details:

Bitcoin Cash Token Details 

Buy BCH on MEXC

Affiliate Disclosure: We may earn a commission from qualifying purchases made via this link, at no extra cost to you.

Key Takeaways: Bitcoin Cash Price Prediction Summary

  • Scenario driven: Price prediction outcomes hinge on total crypto market cap; higher liquidity and adoption lift the bands
  • Fundamentals: Fundamental Grade 80.41% (Community 62%, Tokenomics 100%, Exchange 100%, VC —, DeFi Scanner 72%)
  • Technology: Technology Grade 29.63% (Activity 22%, Repository 70%, Collaboration 48%, Security —, DeFi Scanner 72%)
  • TM Agent gist: Neutral grade, bearish momentum in price prediction models; adoption must improve for upside
  • Education only, not financial advice

Bitcoin Cash Price Prediction Scenario Analysis

Token Metrics price prediction scenarios span four market cap tiers, each representing different levels of crypto market maturity and liquidity:

8T Market Cap - BCH Price Prediction:

At an 8 trillion total crypto market cap, BCH price prediction projects to $910.79 in bear conditions, $1,025.20 in the base case, and $1,139.62 in bullish scenarios.

16T Market Cap - BCH Price Prediction:

Doubling the market to 16 trillion expands the price prediction range to $1,606.59 (bear), $1,949.83 (base), and $2,293.07 (moon).

23T Market Cap - BCH Price Prediction:

At 23 trillion, the price prediction scenarios show $2,302.38, $2,874.46, and $3,446.53 respectively.

31T Market Cap - BCH Price Prediction:

In the maximum liquidity scenario of 31 trillion, BCH price predictions could reach $2,998.18 (bear), $3,799.08 (base), or $4,599.99 (moon).

Each tier in our price prediction framework assumes progressively stronger market conditions, with the base case reflecting steady growth and the moon case requiring sustained bull market dynamics.

Why Consider the Indices with Top-100 Exposure

Bitcoin Cash represents one opportunity among hundreds in crypto markets. Token Metrics Indices bundle BCH with top one hundred assets for systematic exposure to the strongest projects. Single tokens face idiosyncratic risks that diversified baskets mitigate.

Historical index performance demonstrates the value of systematic diversification versus concentrated positions.

Join the early access list

What Is Bitcoin Cash?

Bitcoin Cash is a peer-to-peer electronic cash network focused on fast confirmation and low fees. It launched in 2017 as a hard fork of Bitcoin with larger block capacity to prioritize payments. The chain secures value transfers using proof of work and aims to keep everyday transactions affordable.

BCH is used to pay transaction fees and settle transfers, and it is widely listed across major exchanges. Adoption centers on payments, micropayments, and remittances where low fees matter. It competes as a payment‑focused Layer 1 within the broader crypto market.

Token Metrics AI Analysis

Token Metrics AI provides comprehensive context on Bitcoin Cash's positioning and challenges, informing our price prediction models:

Vision: Bitcoin Cash (BCH) is a cryptocurrency that emerged from a 2017 hard fork of Bitcoin, aiming to function as a peer-to-peer electronic cash system with faster transactions and lower fees. It is known for prioritizing on-chain scalability by increasing block sizes, allowing more transactions per block compared to Bitcoin. This design choice supports its use in everyday payments, appealing to users seeking a digital cash alternative. Adoption has been driven by its utility in micropayments and remittances, particularly in regions with limited banking infrastructure. However, Bitcoin Cash faces challenges including lower network security due to reduced mining hash rate compared to Bitcoin, and ongoing competition from both Bitcoin and other scalable blockchains. Its value proposition centers on accessibility and transaction efficiency, but it operates in a crowded space with evolving technological and regulatory risks.

Problem: The project addresses scalability limitations in Bitcoin, where rising transaction fees and slow confirmation times hinder its use for small, frequent payments. As Bitcoin evolved into a store of value, a gap emerged for a blockchain-based currency optimized for fast, low-cost transactions accessible to the general public.

Solution: Bitcoin Cash increases block size limits from 1 MB to 32 MB, enabling more transactions per block and reducing congestion. This on-chain scaling approach allows for faster confirmations and lower fees, making microtransactions feasible. The network supports basic smart contract functionality and replay protection, maintaining compatibility with Bitcoin's core architecture while prioritizing payment utility.

Market Analysis: Bitcoin Cash operates in the digital currency segment, competing with Bitcoin, Litecoin, and stablecoins for use in payments and remittances. While not the market leader, it occupies a niche focused on on-chain scalability for transactional use. Its adoption is influenced by merchant acceptance, exchange liquidity, and narratives around digital cash. Key risks include competition from layer-2 solutions on other blockchains, regulatory scrutiny of cryptocurrencies, and lower developer and miner activity compared to larger networks. Price movements are often tied to broader crypto market trends and internal protocol developments. Despite its established presence, long-term growth depends on sustained utility, network security, and differentiation in a market increasingly dominated by high-throughput smart contract platforms—all critical factors in our price prediction analysis.

Fundamental and Technology Snapshot from Token Metrics

Fundamental Grade: 80.41% (Community 62%, Tokenomics 100%, Exchange 100%, VC —, DeFi Scanner 72%).


Technology Grade: 29.63% (Activity 22%, Repository 70%, Collaboration 48%, Security —, DeFi Scanner 72%).


Catalysts That Skew BCH Price Predictions Bullish

  • Institutional and retail access expands with ETFs, listings, and integrations
  • Macro tailwinds from lower real rates and improving liquidity
  • Product or roadmap milestones such as upgrades, scaling, or partnerships
  • Increased merchant adoption for payment processing
  • Growing adoption in remittance corridors and emerging markets
  • Layer-2 development enhancing BCH utility

Risks That Skew BCH Price Predictions Bearish

  • Macro risk-off from tightening or liquidity shocks
  • Regulatory actions targeting payment cryptocurrencies or infrastructure outages
  • Concentration risk in validator economics and competitive displacement
  • Low technology grade (29.63%) indicating development challenges
  • Competition from Bitcoin Lightning Network and other payment solutions
  • Declining developer activity and network effect

Bitcoin Cash Price Prediction FAQs

Can BCH reach $3,000?

Yes. Based on our price prediction scenarios, BCH could reach $3,000 in the 23T moon case and 31T base case. The 23T tier projects $3,446.53 in the moon case, making $3,000 an achievable target under favorable market conditions. Not financial advice.

Can BCH 10x from current levels?

At current price of $553.54, a 10x would reach $5,535.40. This falls beyond our highest price prediction scenario of $4,599.99 (31T moon case). Bear in mind that 10x returns would require substantial market cap expansion beyond our modeled scenarios and exceptional BCH adoption. Not financial advice.

Should I buy BCH now or wait?

Timing depends on your risk tolerance and macro outlook. Current price of $553.54 sits below the 8T bear case in our price prediction scenarios. The Neutral TM Grade (54.81%) and bearish trading signal suggest caution in the near term. Dollar-cost averaging may reduce timing risk. Not financial advice.

What is the Bitcoin Cash price prediction for 2025-2028?

Our comprehensive BCH price prediction framework suggests Bitcoin Cash could trade between $910.79 and $4,599.99 depending on market conditions and total crypto market capitalization. The base case price prediction scenario clusters around $1,025.20 to $3,799.08 across different market cap environments. Current Neutral rating (54.81%) indicates mixed signals requiring adoption improvements. Not financial advice.

Can Bitcoin Cash reach $5,000?

BCH reaching $5,000 would exceed our current price prediction models' highest scenario of $4,599.99 (31T moon case). This would require extraordinary market conditions, significant merchant adoption acceleration, and BCH successfully differentiating itself in the crowded payment cryptocurrency space. Not financial advice.

Is Bitcoin Cash a good investment based on price predictions?

BCH shows strong fundamentals (80.41% grade) but a very weak technology score (29.63%), resulting in a Neutral TM Grade of 54.81% with bearish near-term signals. While our price prediction models show potential upside in favorable market conditions, the low technology grade and adoption challenges suggest significant risks. The payment-focused use case faces competition from Lightning Network and other solutions. Not financial advice.

How does BCH compare to Bitcoin in price predictions?

Bitcoin Cash was designed as a payment-focused alternative to Bitcoin's store-of-value narrative. Our price prediction framework shows BCH could reach $1,025-$4,600 across scenarios, while Bitcoin dominates market cap and network effects. BCH's success depends on carving out a distinct payment niche rather than competing directly with Bitcoin. The correlation between BTC and BCH price movements remains high.

What are the biggest risks to BCH price predictions?

Key risks that could impact Bitcoin Cash price predictions include: extremely low technology grade (29.63%) indicating development stagnation, competition from Bitcoin Lightning Network, declining developer activity, regulatory targeting of payment cryptocurrencies, low mining hash rate security concerns, and competitive displacement from stablecoins and other payment solutions. The bearish trading signal and Neutral grade reflect these challenges.

Will BCH benefit from a Bitcoin bull run?

Historically, Bitcoin Cash has shown positive correlation with Bitcoin price movements. Our price prediction scenarios assume BCH captures some momentum from broader crypto market expansion. However, BCH's lower technology grade and adoption challenges may limit its ability to match Bitcoin's percentage gains. The base case scenarios reflect moderate participation in bull market dynamics.

Next Steps

Track live grades and signals

Join Indices Early Access

Want exposure? Buy BCH on MEXC

Disclosure

Educational purposes only, not financial advice. Crypto is volatile, do your own research and manage risk.

Why Use Token Metrics for BCH Price Predictions?

  • Scenario-based forecasting: Multiple market cap tiers for comprehensive price prediction analysis
  • Transparent grading: Fundamental (80.41%) vs Technology (29.63%) reveals strengths and weaknesses
  • AI-driven insights: Advanced algorithms analyze payment cryptocurrency competitive landscape
  • Real-time signals: Trading signals and TM Grades (Neutral 54.81%) updated regularly
  • Risk assessment: Identifies key risks like low developer activity and competitive pressure
  • Comparative analysis: Analyze BCH against Bitcoin, Litecoin, and 6,000+ tokens
Research

Chainlink Price Prediction 2027: Oracle Infrastructure Analysis

Token Metrics Team
8 min read

Understanding LINK Price Prediction: 2027 Potential

Infrastructure protocols become more valuable as the crypto ecosystem scales and relies on robust middleware. Chainlink provides critical oracle infrastructure where proven utility and deep integrations drive long-term value over retail speculation. Increasing institutional adoption raises demand for professional-grade data delivery and security.

Token Metrics price prediction projections for LINK below span multiple total market cap scenarios from conservative to aggressive. Each tier assumes different levels of infrastructure demand as crypto evolves from speculative markets to institutional-grade systems. These bands frame LINK's price prediction potential outcomes into 2027.

Disclosure

Educational purposes only, not financial advice. Crypto is volatile, do your own research and manage risk.

How to Read This LINK Price Prediction

Each band blends cycle analogues and market-cap share math with TA guardrails. Base assumes steady adoption and neutral or positive macro. Moon layers in a liquidity boom. Bear assumes muted flows and tighter liquidity.

TM Agent baseline: Token Metrics lead metric for Chainlink, cashtag $LINK, is a TM Grade of 23.31%, which translates to a Sell, and the trading signal is bearish, indicating short-term downward momentum. This means Token Metrics currently does not endorse $LINK as a long-term buy at current conditions in our price prediction models, despite strong technology fundamentals.

Live details: Chainlink Token Details

Access: Buy LINK on MEXC

Affiliate Disclosure: We may earn a commission from qualifying purchases made via this link, at no extra cost to you.

Key Takeaways: Chainlink Price Prediction Summary

  • Scenario driven: Price prediction outcomes hinge on total crypto market cap; higher liquidity and adoption lift the bands
  • Fundamentals: Fundamental Grade 74.58% (Community 81%, Tokenomics 100%, Exchange 100%, VC —, DeFi Scanner 17%)
  • Technology: Technology Grade 88.50% (Activity 81%, Repository 72%, Collaboration 100%, Security 86%, DeFi Scanner 17%)
  • TM Agent gist: Bearish signal with limited upside in price prediction models unless fundamentals or market regime change
  • Current rating: Sell (23.31%) with strong tech but weak valuation
  • Education only, not financial advice

Chainlink Price Prediction Scenario Analysis

Token Metrics price prediction scenarios span four market cap tiers, each representing different levels of crypto market maturity and liquidity:

8T Market Cap - LINK Price Prediction:

At an 8 trillion dollar total crypto market cap, LINK price prediction projects to $26.10 in bear conditions, $30.65 in the base case, and $35.20 in bullish scenarios.

 16T Market Cap - LINK Price Prediction:

Doubling the market to 16 trillion expands the price prediction range to $42.64 (bear), $56.29 (base), and $69.95 (moon).

 23T Market Cap - LINK Price Prediction:

At 23 trillion, the price prediction scenarios show $59.18, $81.94, and $104.70 respectively.

 31T Market Cap - LINK Price Prediction:

In the maximum liquidity scenario of 31 trillion, LINK price predictions could reach $75.71 (bear), $107.58 (base), or $139.44 (moon).

  These price prediction ranges reflect potential infrastructure value capture as crypto markets mature, though current valuation concerns contribute to the Sell rating despite strong technology fundamentals.

Why Consider the Indices with Top-100 Exposure

Chainlink represents one opportunity among hundreds in crypto markets. Token Metrics Indices bundle LINK with top one hundred assets for systematic exposure to the strongest projects. Single tokens face idiosyncratic risks that diversified baskets mitigate.

Historical index performance demonstrates the value of systematic diversification versus concentrated positions.

Join the early access list

What Is Chainlink?

Chainlink is a decentralized oracle network that connects smart contracts to real-world data and systems. It enables secure retrieval and verification of off-chain information, supports computation, and integrates across multiple blockchains. As adoption grows, Chainlink serves as critical infrastructure for reliable data feeds and automation.

The LINK token is used to pay node operators and secure the network's services. Common use cases include DeFi price feeds, insurance, and enterprise integrations, with CCIP extending cross-chain messaging and token transfers—all factors that influence long-term LINK price predictions.

Token Metrics AI Analysis

Token Metrics AI provides comprehensive context informing our LINK price prediction models:

Vision: Chainlink aims to create a decentralized, secure, and reliable network for connecting smart contracts with real-world data and systems. Its vision is to become the standard for how blockchains interact with external environments, enabling trust-minimized automation across industries.

Problem: Smart contracts cannot natively access data outside their blockchain, limiting their functionality. Relying on centralized oracles introduces single points of failure and undermines the security and decentralization of blockchain applications. This creates a critical need for a trustless, tamper-proof way to bring real-world information onto blockchains.

Solution: Chainlink solves this by operating a decentralized network of node operators that fetch, aggregate, and deliver data from off-chain sources to smart contracts. It uses cryptographic proofs, reputation systems, and economic incentives to ensure data integrity. The network supports various data types and computation tasks, allowing developers to build complex, data-driven decentralized applications.

Market Analysis: Chainlink is a market leader in the oracle space and a key infrastructure component in the broader blockchain ecosystem, particularly within Ethereum and other smart contract platforms. It faces competition from emerging oracle networks like Band Protocol and API3, but maintains a strong first-mover advantage and widespread integration across DeFi, NFTs, and enterprise blockchain solutions. Adoption is driven by developer activity, partnerships with major blockchain projects, and demand for secure data feeds. Key risks include technological shifts, regulatory scrutiny on data providers, and execution challenges in scaling decentralized oracle networks. As smart contract usage grows, so does the potential for oracle services, positioning Chainlink at the center of a critical niche, though its success depends on maintaining security and decentralization over time—all critical factors in our price prediction analysis.

Fundamental and Technology Snapshot from Token Metrics

Fundamental Grade: 74.58% (Community 81%, Tokenomics 100%, Exchange 100%, VC —, DeFi Scanner 17%).


Technology Grade: 88.50% (Activity 81%, Repository 72%, Collaboration 100%, Security 86%, DeFi Scanner 17%).

  Catalysts That Skew LINK Price Predictions Bullish

  • Institutional and retail access expands with ETFs, listings, and integrations
  • Macro tailwinds from lower real rates and improving liquidity
  • Product or roadmap milestones such as CCIP upgrades, scaling, or partnerships
  • Increased adoption of Chainlink oracle services across DeFi protocols
  • Enterprise blockchain integrations requiring secure data feeds
  • Cross-chain expansion through CCIP (Cross-Chain Interoperability Protocol)

Risks That Skew LINK Price Predictions Bearish

  • Macro risk-off from tightening or liquidity shocks
  • Regulatory actions targeting oracle networks or infrastructure outages
  • Concentration in node operator economics and competitive displacement
  • Current low TM Grade (23.31%) indicating valuation concerns
  • Competition from alternative oracle solutions (Band Protocol, API3)
  • Token economics challenges despite 100% tokenomics score

How Token Metrics Can Help

Token Metrics empowers you to analyze Chainlink and hundreds of digital assets with AI-driven ratings, on-chain and fundamental data, and index solutions to manage portfolio risk smartly in a rapidly evolving crypto market. Our price prediction frameworks provide transparent scenario-based analysis even for tokens with Sell ratings.

Chainlink Price Prediction FAQs

Can LINK reach $100?

Yes. Based on our price prediction scenarios, LINK could reach $100+ in the 23T moon case, projecting $104.70. However, this requires significant market cap expansion and improved market conditions beyond the current Sell rating (23.31%). Not financial advice.

What price could LINK reach in the moon case?

Moon case price predictions range from $35.20 at 8T to $139.44 at 31T total crypto market cap. These scenarios assume maximum liquidity expansion and strong Chainlink adoption, though current bearish signals suggest caution. Not financial advice.

Should I buy LINK now or wait?

Timing depends on risk tolerance and macro outlook. Current price of $18.09 sits below the 8T bear case in our price prediction scenarios, suggesting potential value. However, the Sell rating (23.31%) and bearish trading signal indicate Token Metrics does not currently endorse LINK at these levels. Dollar-cost averaging may reduce timing risk if you believe in long-term infrastructure value. Not financial advice.

What is the Chainlink price prediction for 2025-2027?

Our comprehensive LINK price prediction framework suggests Chainlink could trade between $26.10 and $139.44 depending on market conditions and total crypto market capitalization. The base case price prediction scenario clusters around $30.65 to $107.58 across different market cap environments. Despite strong technology (88.50%) and fundamentals (74.58%), the current Sell rating (23.31%) reflects valuation concerns. Not financial advice.

Can Chainlink reach $50?

Yes. Based on our price prediction scenarios, LINK could reach $56.29 in the 16T base case and higher in 23T/31T scenarios. The $50 target becomes achievable in moderate market cap environments (16T tier), though current bearish momentum suggests this may take time. Not financial advice.

Why does LINK have a Sell rating despite strong technology?

LINK shows excellent technology fundamentals (88.50% grade) with strong development activity, collaboration, and security. However, the overall TM Grade of 23.31% (Sell) reflects current valuation concerns, market positioning, and bearish trading signals. Our price prediction models show potential upside in favorable market conditions, but current metrics suggest waiting for improved entry points. Not financial advice.

Is Chainlink a good investment based on price predictions?

LINK presents a complex investment case: exceptional technology grade (88.50%), solid fundamentals (74.58%), but a Sell rating (23.31%) with bearish momentum. While our price prediction models show significant upside potential in bull market scenarios, current valuation concerns and bearish signals suggest caution. The oracle infrastructure thesis remains compelling long-term, but timing and entry points matter. Consider diversified exposure through indices. Not financial advice.

How does LINK compare to other oracle price predictions?

Chainlink dominates the oracle space with first-mover advantage and widespread integration. Our price prediction framework suggests LINK could reach $30-$139 across scenarios. Competitors like Band Protocol and API3 offer alternatives, but Chainlink's established network effects and enterprise partnerships position it as the infrastructure leader. However, the current Sell rating suggests valuation concerns versus alternatives.

What are the biggest risks to LINK price predictions?

Key risks that could impact Chainlink price predictions include: current Sell rating (23.31%) indicating valuation concerns, competition from emerging oracle networks, regulatory scrutiny on data providers, node operator centralization risks, macro liquidity shocks, and challenges scaling decentralized oracle infrastructure. Despite strong technology (88.50%), these factors contribute to bearish near-term outlook.

Will LINK benefit from DeFi growth?

Chainlink is critical infrastructure for DeFi, providing price feeds for lending protocols, derivatives, and stablecoins. Our price prediction scenarios assume LINK captures value from continued DeFi adoption. However, the current Sell rating suggests this thesis isn't reflected in valuation metrics yet. Long-term infrastructure value may require patience and improved market conditions.


Should I buy LINK now or wait?

Timing depends on risk tolerance and macro outlook. Current price of $18.09 sits below the 8T bear case in the scenarios. Dollar-cost averaging may reduce timing risk. Not financial advice.

Next Steps

Track live grades and signals: Token Details

Join Indices Early Access 

Want exposure? Buy LINK on MEXC 

Disclosure

Educational purposes only, not financial advice. Crypto is volatile, do your own research and manage risk.

Why Token Metrics Ratings Matter

Discover the full potential of your crypto research and portfolio management with Token Metrics. Our ratings combine AI-driven analytics, on-chain data, and decades of investing expertise—giving you the edge to navigate fast-changing markets. Try our platform to access scenario-based price prediction targets, token grades, indices, and more for institutional and individual investors. Token Metrics is your research partner through every crypto market cycle.

Why Use Token Metrics for LINK Price Predictions?

  • Transparent analysis: Honest Sell ratings (23.31%) even when technology fundamentals are strong (88.50%)
  • Scenario-based modeling: Multiple market cap tiers for comprehensive price prediction analysis
  • Infrastructure focus: Specialized oracle network analysis and competitive landscape assessment
  • Risk-adjusted approach: Balanced view of technology strength versus valuation concerns
  • Real-time signals: Trading signals and TM Grades updated regularly
  • Diversification tools: Index solutions to spread oracle infrastructure risk
  • Comparative analysis: Analyze LINK against Band Protocol, API3, and 6,000+ tokens
Choose from Platinum, Gold, and Silver packages
Reach with 25–30% open rates and 0.5–1% CTR
Craft your own custom ad—from banners to tailored copy
Perfect for Crypto Exchanges, SaaS Tools, DeFi, and AI Products