


Trezor vs Ledger - Which Crypto Wallet is Better?
%201.svg)
%201.svg)


In the world of cryptocurrency, the question of security is paramount. No matter how well you understand the market, or how diversified your portfolio is, if you don’t safeguard your assets, all can be lost in the blink of an eye.
Two names stand out in the hardware wallet industry: Trezor and Ledger. Both promise top-notch security, but which one should you entrust with your digital gold? Let's dive deep and make an informed decision.
What is a Hardware Wallet?
Before we start, it's essential to grasp what a hardware wallet is. Simply put, it's a physical device, often resembling a USB stick, that stores your cryptocurrency private keys offline.
By keeping the keys offline, it offers protection against online hacking attempts, a significant advantage over online wallets.
Trezor Wallet Overview
Trezor Wallet is a pioneering hardware wallet developed by SatoshiLabs, a Czech-based company. Introduced in 2013, Trezor set the gold standard for cold storage of cryptocurrencies.
Unlike traditional online wallets, which are vulnerable to hacks, Trezor keeps your private keys offline, ensuring top-tier security against cyber threats. It's a compact device, somewhat resembling a USB flash drive, which connects to your computer or smartphone.
The wallet supports over a thousand different cryptocurrencies, providing both accessibility and security. Its intuitive interface, combined with features like pin protection, physical transaction confirmation, and a recovery seed system, ensures that even beginners can handle their crypto holdings with confidence and peace of mind.
Origin: Czech Republic
Founded: 2013 by SatoshiLabs
Popular Models: Trezor One, Trezor Model T
Ledger Wallet Overview
Ledger Wallet stands as one of the crypto community's most trusted hardware wallet solutions. Founded in France in 2014, Ledger offers users the security of cold storage combined with the flexibility of more than 1,800 supported cryptocurrencies.
Distinctively, Ledger incorporates a Secure Element (SE) chip, an advanced layer of protection against potential breaches. Resembling a sleek USB device, the Ledger can be connected to both computers and mobile devices.
Through its proprietary Ledger Live software, users can seamlessly manage transactions, check balances, and perform firmware updates.
With mandatory pin protection, physical verification of transactions, and a 24-word recovery seed mechanism, Ledger maintains a balance of user-friendliness and robust security for crypto enthusiasts.
Origin: France
Founded: 2014
Popular Models: Ledger Nano S, Ledger Nano X
Ledger vs Trezor - Security Features
Both devices prioritize security. After all, that's their primary function. Let's look at how each performs in this domain.
Trezor:
- Pin Protection: A mandatory feature ensuring only the device's rightful owner can access it.
- Physical Verification: Transactions require manual approval using the device's buttons.
- Recovery Seed: A 12-24 word seed allows recovery of assets if the device is lost.
Ledger:
- Secure Element (SE) Chip: Ledger incorporates an SE chip, adding an extra layer of security.
- Pin Protection: Similar to Trezor, pin protection is mandatory.
- Physical Verification: Transactions need manual approval.
- Recovery Seed: 24-word seed for asset recovery.
Ledger vs Trezor - Compatibility
One of the primary considerations for crypto enthusiasts when selecting a hardware wallet is the range of supported cryptocurrencies. Ledger and Trezor, the industry titans, both offer extensive compatibility, albeit with some differences.
Ledger, with its Ledger Live software, proudly supports over 1,800 coins and tokens, ensuring that users can securely manage a broad spectrum of assets from major currencies like Bitcoin and Ethereum to numerous ERC-20 tokens.
On the other hand, Trezor isn't far behind, boasting support for more than 1,000 coins and tokens. While it provides native support for heavyweights like Bitcoin and Ethereum, certain lesser-known coins might require third-party interfaces.
Ultimately, while both wallets cater to the majority of crypto users' needs, those with diverse portfolios might lean towards Ledger for its wider array, whereas Trezor users appreciate its straightforward, web-based interface.
User Interface and Experience
Usability plays a pivotal role in ensuring that users can securely and efficiently manage their assets.
Trezor:
1. Trezor offers straightforward interface with clear instructions.
2. Web-based interface that can be accessed easily from any computer.
3. The Model T features a touch screen for improved user experience.
Ledger:
1. Ledger Live software offers a comprehensive dashboard to manage assets.
2. The Nano X can connect via Bluetooth, making it compatible with mobile devices.
3. User-friendly design and intuitive features.
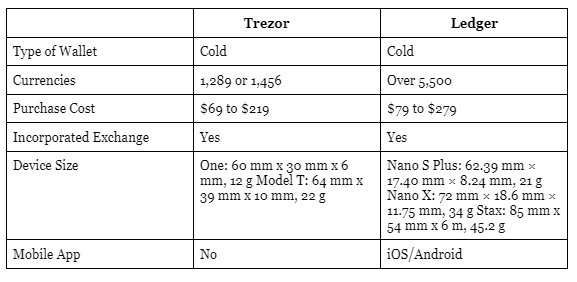
Ledger vs Trezor Comparison
Frequently Asked Questions
Q1. How often do Trezor and Ledger release firmware updates?
Both Trezor and Ledger are committed to maintaining high security and functionality standards. As such, firmware updates are released periodically, addressing potential vulnerabilities and improving user experience.
Q2. Can I use both Trezor and Ledger simultaneously for different assets?
Absolutely! Many crypto investors use multiple wallets to diversify their security approach. You can manage different assets or even the same asset across both wallets.
Q3. What happens if my hardware wallet gets stolen or damaged?
Both Trezor and Ledger provide recovery seeds (a series of words) during initial setup. With this seed, you can restore your assets on a new device.
Q4. Is it possible to add custom tokens or coins that aren't natively supported?
Ledger and Trezor both support numerous ERC-20 tokens and other assets. If a token isn't natively supported, it may be possible through third-party integrations or software.
Q5. Do I need an internet connection to use these hardware wallets?
While the wallets themselves store keys offline, an internet connection is required for transactions or updates. Always ensure a secure connection when using your wallet.
Q6. How do I know if the firmware update is official and not from a malicious source?
Always update firmware from the official Trezor or Ledger websites. Be wary of emails or pop-ups directing you to other sites or urging immediate updates.
Q7. Is it safe to use hardware wallets on public computers or networks?
While hardware wallets provide a layer of protection, using them on potentially compromised computers or open networks might expose you to risks. Always prioritize using trusted devices and networks.
Q8. Can I use my Trezor or Ledger wallet with mobile devices?
Yes, both wallets have mobile compatibility. Ledger's Nano X even offers Bluetooth connectivity for added convenience with mobile devices.
Final Thoughts: Which One Should You Choose?
The decision between Trezor and Ledger boils down to personal preferences and specific needs.
- If you prioritize a more extended list of supported coins and a unified application interface, Ledger may be more suitable.
- If a touch screen interface appeals to you and you value a web-based platform, Trezor might be the way to go.
- For those heavily invested in cryptocurrency, it might even be worthwhile to have both. Diversifying your security approach can be just as crucial as diversifying your crypto portfolio.
Actionable Steps
Research & Stay Updated: Always look for the most recent reviews and updates on hardware wallets. The crypto world evolves rapidly, and staying informed is crucial.
Prioritize Security: No matter which wallet you choose, never share your pin or recovery seed with anyone.
Purchase from Official Channels: To avoid counterfeit devices, always buy directly from the official Trezor or Ledger websites or authorized sellers.
Backup: Always keep multiple copies of your recovery seed in safe places.
In conclusion, both Trezor and Ledger have proven their mettle in the crypto community, earning trust and loyalty from users. Your decision should align with your specific needs and preferences, but rest assured, both devices strive to offer the best protection for your digital assets.
Disclaimer
The information provided on this website does not constitute investment advice, financial advice, trading advice, or any other sort of advice and you should not treat any of the website's content as such.
Token Metrics does not recommend that any cryptocurrency should be bought, sold, or held by you. Do conduct your own due diligence and consult your financial advisor before making any investment decisions.
AI Agents in Minutes, Not Months

.svg)


%201.svg)

.png)


.svg)
No Credit Card Required


Online Payment


SSL Encrypted
.png)
Token Metrics Media LLC is a regular publication of information, analysis, and commentary focused especially on blockchain technology and business, cryptocurrency, blockchain-based tokens, market trends, and trading strategies.
Token Metrics Media LLC does not provide individually tailored investment advice and does not take a subscriber’s or anyone’s personal circumstances into consideration when discussing investments; nor is Token Metrics Advisers LLC registered as an investment adviser or broker-dealer in any jurisdiction.
Information contained herein is not an offer or solicitation to buy, hold, or sell any security. The Token Metrics team has advised and invested in many blockchain companies. A complete list of their advisory roles and current holdings can be viewed here: https://tokenmetrics.com/disclosures.html/
Token Metrics Media LLC relies on information from various sources believed to be reliable, including clients and third parties, but cannot guarantee the accuracy and completeness of that information. Additionally, Token Metrics Media LLC does not provide tax advice, and investors are encouraged to consult with their personal tax advisors.
All investing involves risk, including the possible loss of money you invest, and past performance does not guarantee future performance. Ratings and price predictions are provided for informational and illustrative purposes, and may not reflect actual future performance.