Back to blog
Research

Understanding Proprietary Market Signals: How Crypto Indices Detect Bull and Bear Markets

Learn how crypto indices and proprietary market signals, including AI-powered insights from Token Metrics, help detect bull and bear markets for risk-conscious investors.
Token Metrics Team
12
Want Smarter Crypto Picks—Free?
See unbiased Token Metrics Ratings for BTC, ETH, and top alts.
Thank you! Your submission has been received!
Oops! Something went wrong while submitting the form.
 No credit card | 1-click unsubscribe

In the fast-paced and often unpredictable world of cryptocurrency, understanding how crypto indices detect bull and bear markets is crucial for investors aiming to maximize profits and minimize losses. Unlike traditional financial markets, where a simple 20% price drop might signify a bear market, the crypto market is far more volatile, with frequent sharp price fluctuations that do not necessarily indicate a shift in market regime. This volatility demands more sophisticated tools that analyze a wide range of data points, enabling investors and traders to distinguish genuine bull and bear markets from short-term noise.

Traditional indicators commonly used in traditional finance often fall short when applied to digital assets. To address this challenge, proprietary market signals have emerged as a useful tool that leverages advanced analytics, including artificial intelligence and on-chain data, to detect market regime shifts with greater accuracy. This article explores the limitations of legacy indicators, the architecture behind proprietary signals, and how platforms like Token Metrics are revolutionizing the way market phases are identified and acted upon.

The Inadequacy of Traditional Indicators

Many newcomers to crypto rely heavily on legacy technical indicators such as the Relative Strength Index (RSI), Moving Average Convergence Divergence (MACD), and simple moving averages. These tools have a long history in traditional markets, but they exhibit critical weaknesses when applied to the crypto market cycle.

The Lagging Problem

Traditional indicators are inherently backward-looking. For example, RSI may only indicate that Bitcoin is "overbought" after a significant rally has already occurred, while MACD crossover signals often lag behind actual trend changes by days. This delay means that by the time traders receive warnings, institutional investors and experienced traders have often already adjusted their positions. The widely cited 200-day moving average (MA) is a classic example: it requires 200 days of data to calculate, making it slow to react to rapid market shifts. When Bitcoin’s price dropped below the 200-day MA in March 2025, many declared a bear market, but this signal came too late to capture the onset of the downturn effectively.

The False Signal Epidemic

Crypto's notorious volatility generates frequent false alarms with traditional metrics. A 20% price drop—enough to define a bear market in stocks—can be a routine correction or consolidation in crypto, occurring without a genuine regime change. Bitcoin, for instance, can experience significant price trends downward during an overall bull market and then resume its upward momentum. Relying on these traditional signals often results in premature selling during temporary bear phases or missed opportunities during early bull phases.

Single-Factor Blindness

Legacy indicators typically focus on a single dimension, usually price action. They overlook critical factors like on-chain activity, wallet flows, network fundamentals, trading volume, market sentiment, liquidity, and broader macroeconomic influences such as interest rates or the wider economy. This narrow view produces an incomplete and sometimes misleading picture of the market’s health.

The Architecture of Proprietary Market Signals

Proprietary market signals represent a significant evolution beyond traditional tools by incorporating three key innovations: multi-factor analysis, machine learning adaptation, and signal confluence validation.

Multi-Factor Analysis

Advanced systems evaluate dozens of independent data sources spanning multiple categories to build a nuanced understanding of market conditions:

  • Price Dynamics: Beyond just the current price, these systems analyze momentum shifts, volatility patterns, support and resistance levels, breakout formations, and historical pattern recognition.
  • Volume Intelligence: They assess trading volume across exchanges, volume-weighted price metrics, detect anomalous volume spikes, and monitor liquidity depth.
  • On-Chain Fundamentals: Key metrics include active address growth, transaction counts, whale wallet movements, exchange inflow and outflow ratios, coin age distribution (HODL waves), and network fee trends.
  • Sentiment Signals: These incorporate social media velocity and tone, the greed index, search trends, and institutional sentiment indicators.
  • Market Structure: Factors like Bitcoin dominance shifts, altcoin season indicators, asset correlation patterns, and sector rotation signals are analyzed.
  • Macroeconomic Context: Broader influences such as Federal Reserve policies, global liquidity conditions, regulatory developments, and institutional capital flows are also factored in.

By integrating these diverse data points, proprietary systems develop a holistic view of the crypto market, enabling more accurate detection of bull or bear market regimes.

Machine Learning Adaptation

Unlike static technical indicators, the most sophisticated proprietary systems employ machine learning models that continuously learn from historical outcomes. These AI-powered models analyze thousands of past market setups to identify which combinations of factors preceded genuine breakouts or downturns. This adaptability is critical because the crypto market cycle evolves rapidly; patterns effective in 2020 may not hold in 2025 as the market matures and institutional participation increases.

By constantly refining their algorithms based on new data, these systems maintain their effectiveness across different market phases, including bull markets, bear markets, and sideways consolidations.

Signal Confluence

A defining feature of proprietary signals is the requirement that multiple independent indicators align before a signal is triggered. Instead of reacting to any single metric crossing a threshold, these systems wait for a confluence of price action, volume patterns, on-chain metrics, and sentiment indicators to confirm a setup.

This multi-factor confirmation dramatically reduces false positives. When several data points simultaneously indicate bullish conditions, the probability of a true bull market increases significantly compared to relying on one indicator alone. The same applies to detecting bear markets, where combined signals of selling pressure, declining volume, and negative sentiment provide stronger evidence of a downturn.

Token Metrics: Setting the Standard for Market Intelligence

Token Metrics has emerged as a leader in applying proprietary signal technology to the crypto space, offering what many consider the industry's most sophisticated market detection system. As a cryptocurrency investment research firm leveraging AI and machine learning, Token Metrics analyzes over 6,000 projects, processing more data points and generating more accurate signals than most competitors.

The Token Metrics Signal Architecture

Token Metrics’ Bullish and Bearish Signals operate through a multi-layered system that integrates over 80 data points per token. These include price momentum shifts across various timeframes, higher trading volumes and anomalies, interactions with support and resistance levels, on-chain activity strength, whale wallet flow patterns, social sentiment analysis, and liquidity and order book depth.

Importantly, signals are only triggered when multiple critical factors confirm the setup, following the signal confluence approach that eliminates many false alarms common in traditional methods.

AI-Powered Learning

What sets Token Metrics apart is its continuous machine learning-driven refinement. The platform’s AI models train on outcomes, not just patterns, learning which factor combinations consistently lead to real breakouts or downturns. This outcome-based training ensures the system remains responsive to evolving market dynamics, such as increased institutional adoption and the rise of tokenized real-world assets.

Rigorous backtesting against extensive historical data ensures signals maintain accuracy across bull and bear cycles, avoiding deterioration that plagues static indicators.

Real-World Performance

Token Metrics regularly showcases its signal effectiveness with documented examples. For instance, a Bullish Signal on a lesser-known token, $DEGEN, preceded a +35% breakout despite minimal social media attention. Conversely, a Bearish Signal on $ENA helped users avoid a -22% correction. These examples illustrate how proprietary intelligence offers insights that can assist in managing market risks and opportunities.

How Regime Switching Works in Practice

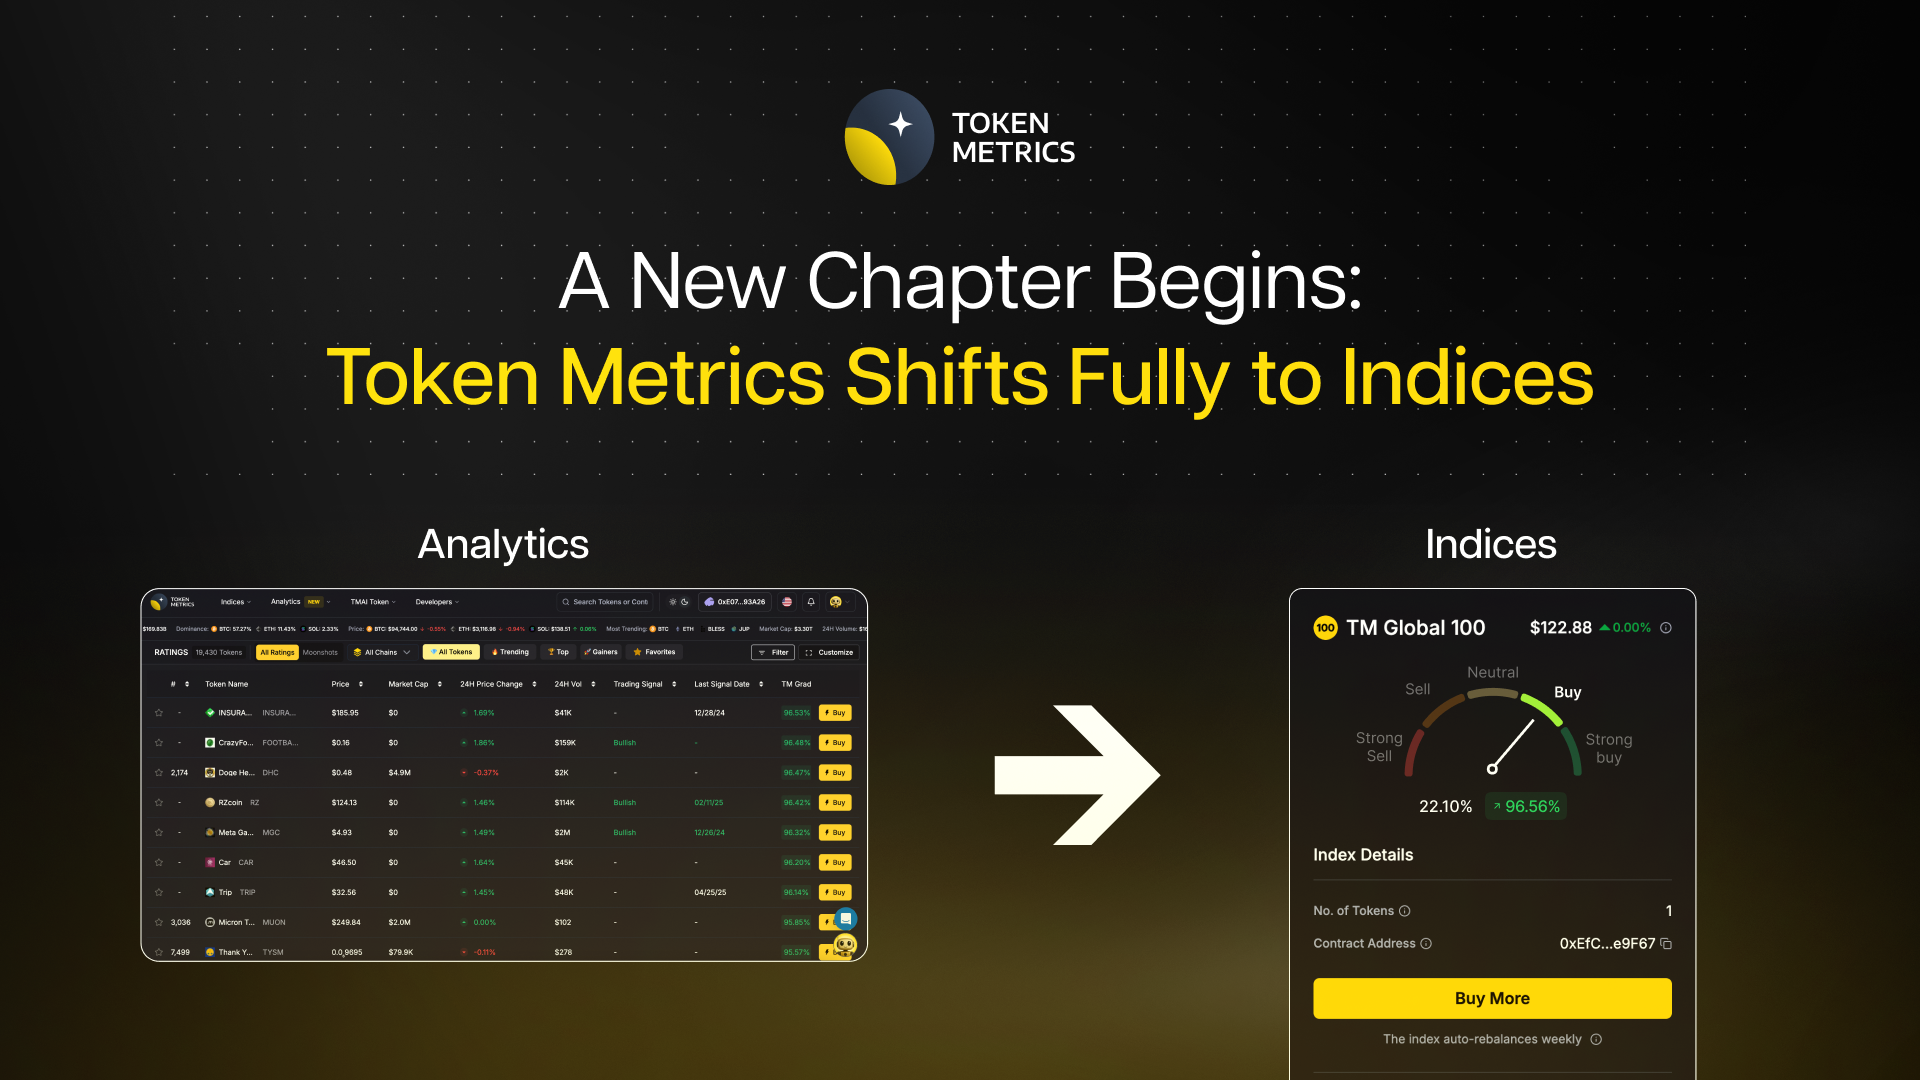
The practical application of proprietary signals is evident in automated index strategies like Token Metrics’ TM Global 100 Index, which demonstrates systematic regime switching based on real-time market intelligence.

The Detection Process

Token Metrics continuously monitors its proprietary indicators, synthesizing price action, volume, on-chain metrics, sentiment data, and macroeconomic factors into comprehensive assessments of market regimes. When multiple signals align bullishly, the system classifies the environment as a bull market and maintains full exposure to the top 100 cryptocurrencies by market capitalization, capturing upside potential across the ecosystem.

When bearish signals dominate, indicating elevated risk and selling pressure, the index automatically shifts holdings into stablecoins like USDC, preserving capital during downturns often referred to as crypto winter.

The Advantage Over Manual Trading

Manual market timing is challenging for individual investors who must juggle numerous indicators, overcome emotional biases like fear and greed, and execute complex portfolio adjustments efficiently. Proprietary systems remove these obstacles by making emotionless, data-driven decisions automatically. This disciplined approach helps avoid panic sells during bottoms and impulsive buys at tops, common pitfalls for many traders.

Transparency Without Complexity

While the underlying AI and multi-factor models are complex, Token Metrics maintains transparency by providing users with a Market Gauge showing current regime assessments, interactive portfolio visualizations, detailed transaction logs, and performance analytics. This openness fosters trust while safeguarding the proprietary nature of the algorithms.

Beyond Binary: Understanding Market Nuance

Sophisticated proprietary systems recognize that markets are not simply in a binary bull or bear state but operate along a spectrum with varying conviction levels. Token Metrics’ signals can indicate conditions ranging from "strong bullish" to "strong bearish," allowing for nuanced position sizing and risk management.

During strong bullish phases, indices maintain maximum exposure to volatile assets and emerging projects with strong demand. In neutral or uncertain periods, exposure is moderated, and in strong bearish environments, defensive allocations to stablecoins are preferred. This approach helps to optimize returns and manage risk effectively.

The Competitive Moat of Proprietary Intelligence

The significance of proprietary signals lies in the information advantage they offer. Investors who effectively detect regime shifts early can capitalize on opportunities before the broader market recognizes them. By the time mainstream media or lagging indicators declare a bear or bull market, those relying on shared signals may have missed the optimal entry or exit points.

Token Metrics invests heavily in AI infrastructure, data science, and comprehensive data gathering to sustain its competitive edge. Its ability to analyze billions of data points and adapt models swiftly provides insights difficult to replicate manually, democratizing sophisticated market detection for individual investors.

Practical Application for Investors

Understanding how crypto indices detect bull and bear markets is vital, but the key lies in how investors apply this knowledge:

  • Active Traders: Utilize Token Metrics’ Bullish and Bearish Signals to time entries and exits with higher precision. Confirm signals with high Trader Grade tokens for better accuracy.
  • Index Investors: Rely on automated regime switching within the TM Global 100 Index to adjust exposure according to market conditions without manual intervention.
  • Research-Oriented Investors: Use the Market Gauge and signal history to inform portfolio adjustments and risk management strategies.
  • Risk Managers: Treat bearish signals as prompts to reduce exposure or increase allocations to stable assets, aligning with personal risk appetite.

The Future of Market Intelligence

As the crypto ecosystem matures, with innovations in DeFi, AI, and tokenized assets, the need for advanced analytics will intensify. Token Metrics plans to expand its proprietary signal technology with sector-specific indicators, enhanced natural language processing, integration with automated trading, and deeper on-chain health metrics to keep users at the forefront of market intelligence.

Conclusion: Intelligence as Competitive Advantage

In today’s complex financial landscape, accurately identifying market regimes is essential for systemic risk management and opportunity capture. Proprietary signals, powered by AI and multi-factor analysis, offer a comprehensive and adaptive approach that surpasses traditional indicators. Platforms like Token Metrics provide invaluable insights that help investors navigate volatile markets effectively. Recognizing regime shifts early and acting on them systematically can be the difference between sustained success and missed opportunities. Equip yourself with cutting-edge tools to stay ahead in the evolving crypto world.

Discover Crypto Gems with Token Metrics AI

Token Metrics uses AI-powered analysis to help you uncover profitable opportunities in the crypto market. Get Started For Free

What are crypto indices?

Crypto indices are financial instruments that track the performance of a basket of digital assets, typically weighted by market capitalization or other criteria. These indices provide a broad overview of the cryptocurrency market, making it easier to monitor overall trends and benchmark returns without focusing on individual tokens.

How do proprietary signals differ from traditional indicators?

Proprietary signals integrate multiple data sources—including price action, on-chain data, sentiment, and macroeconomic factors—while leveraging machine learning and advanced analytics. Traditional indicators often rely on single-factor price analysis. By synthesizing diverse data, proprietary signals are better equipped to detect genuine market regime shifts and reduce false signals.

How does Token Metrics generate its market signals?

Token Metrics employs a multi-factor, AI-driven system that analyzes over 80 data points per token, including price dynamics, volume, on-chain activity, liquidity, and sentiment. Signals are only triggered when several independent metrics confirm the same market regime, ensuring robustness and reducing the risk of false alerts.

Can individual investors use proprietary market signals?

Yes. Platforms like Token Metrics provide access to proprietary signals, making advanced analytics available to retail investors. This democratizes the sophisticated tools once reserved for institutions and enables individuals to make more informed decisions and manage risk effectively.

How do crypto indices handle market volatility?

Advanced crypto indices employ real-time monitoring and regime-switching algorithms, allowing them to shift allocations—from full exposure to stablecoins—based on current market conditions. This adaptability helps manage risk and reduce the impact of extreme volatility commonly observed in the crypto market.

Disclaimer

This content is for informational and educational purposes only and should not be interpreted as financial advice, investment recommendations, or an offer to buy or sell any asset. The information provided is accurate to the best of our knowledge at the time of publication. Always conduct your own research and consult with a professional advisor before making investment decisions. Cryptocurrency markets are volatile, and past performance is not indicative of future results.

Build Smarter Crypto Apps &
AI Agents in Minutes, Not Months
Real-time prices, trading signals, and on-chain insights all from one powerful API.
Grab a Free API Key
About Token Metrics
Token Metrics: AI-powered crypto research and ratings platform. We help investors make smarter decisions with unbiased Token Metrics Ratings, on-chain analytics, and editor-curated “Top 10” guides. Our platform distills thousands of data points into clear scores, trends, and alerts you can act on.
30 Employees
analysts, data scientists, and crypto engineers
30 Employees
analysts, data scientists, and crypto engineers
30 Employees
analysts, data scientists, and crypto engineers
Want Smarter Crypto Picks—Free?
See unbiased Token Metrics Ratings for BTC, ETH, and top alts.
Thank you! Your submission has been received!
Oops! Something went wrong while submitting the form.
 No credit card | 1-click unsubscribe
Token Metrics Team
Token Metrics Team

Recent Posts

Research

The Complete Beginner's Guide to Token Metrics Crypto Indices: Start Investing in 30 Minutes

Token Metrics Team
12 min read

Cryptocurrency investing intimidates many potential investors. The technical jargon, overwhelming number of tokens, security concerns, and stories of people losing fortunes create paralysis. You know crypto represents an opportunity, but where do you even begin?

Token Metrics AI Indices eliminate these barriers by providing a simple, secure pathway into cryptocurrency investing. Whether you've never bought crypto before or you're transitioning from traditional investments, this comprehensive beginner's guide walks you through everything needed to start investing successfully in just 30 minutes.

No technical expertise required. No complicated wallet setup. No endless research into thousands of tokens. Just straightforward steps that get you invested intelligently and positioned for long-term wealth creation.

What Exactly Are Crypto Indices? (Explained Simply)

Before diving into the how-to, let's establish a simple understanding of what you're investing in.

Think of crypto indices like a basket containing multiple cryptocurrencies. Instead of buying Bitcoin or Ethereum individually, you buy a pre-made collection of several carefully selected digital assets. This is similar to how traditional stock index funds like the S&P 500 contain hundreds of companies rather than forcing you to pick individual stocks.

Token Metrics creates these baskets using artificial intelligence that analyzes thousands of cryptocurrencies and selects the best ones based on comprehensive data. The AI acts like a team of expert analysts working 24/7, constantly monitoring market conditions and adjusting your portfolio to maximize returns while managing risk.

When you invest in a Token Metrics index, you're essentially hiring sophisticated AI technology to build and manage your crypto portfolio professionally. You get instant diversification across multiple tokens, automatic rebalancing when market conditions change, protection from common investing mistakes, and access to opportunities you'd never find independently.

The beauty of this approach is simplicity. You don't need to understand blockchain technology, read complicated whitepapers, or analyze trading charts. The AI handles complexity while you focus on your life and watch your investment grow.

Why Beginners Should Start with Indices Instead of Individual Tokens

New investors often make the mistake of buying individual cryptocurrencies based on social media hype, friend recommendations, or price momentum. This approach leads to several problems that indices elegantly solve.

• Individual token selection requires expertise most beginners lack. How do you evaluate whether a cryptocurrency's technology is legitimate or vaporware? How do you determine if tokenomics are sustainable? How do you identify scams before they steal your money? Without experience, these questions prove nearly impossible to answer correctly.

• Concentration risk destroys portfolios quickly. If you invest everything in three tokens and one fails catastrophically, you lose a third of your capital immediately. Indices spread risk across 10-30 carefully vetted assets, ensuring single failures don't devastate your portfolio.

• Emotional decision-making causes most investment losses. Fear drives panic selling during downturns. Greed drives buying at market tops. FOMO drives chasing pumps into overvalued assets. AI indices eliminate emotion entirely, maintaining discipline when human investors make terrible decisions.

• Time requirements prove unsustainable. Successfully managing individual crypto positions requires hours daily monitoring markets, reading news, analyzing charts, and executing trades. Most people with jobs and families can't sustain this commitment. Indices require maybe 30 minutes quarterly.

For beginners, indices provide the perfect entry point—immediate diversification, professional management, emotion-free investing, and minimal time commitment. You can start small, learn gradually, and scale up as you become comfortable.

Step-by-Step: Your First 30 Minutes in Crypto Indices

Ready to begin? Follow this simple roadmap to go from complete beginner to invested in under 30 minutes.

Minutes 1-5: Create Your Token Metrics Account

Visit the Token Metrics website and click the sign-up button. You'll need to provide basic information including email address, create a secure password, and verify your email through the confirmation link sent to your inbox.

Token Metrics offers a 7-day free trial, allowing you to explore the platform thoroughly before committing financially. Take advantage of this trial to familiarize yourself with available indices, review performance data, and understand the interface.

During signup, you'll choose a subscription tier. For beginners, start with the basic tier that provides access to all indices and essential features. You can upgrade later if you want additional tools like advanced analytics or trading signals.

Minutes 6-15: Explore Available Indices and Choose Your Strategy

Once logged in, navigate to the Indices section. You'll see several different index options, each designed for specific investment strategies and risk profiles. Here's how to choose:

• Conservative Investor Grade Index: If you're risk-averse, older, or investing money you can't afford to lose, start here. This index focuses on established cryptocurrencies with strong fundamentals—primarily Bitcoin, Ethereum, and select large-cap altcoins. Returns are more moderate but volatility is lower.

• Balanced Growth Index: If you're comfortable with moderate risk and seeking steady growth, this balanced approach combines major cryptocurrencies with promising mid-cap projects. It offers stronger growth potential than conservative indices while maintaining reasonable risk levels.

• Aggressive Growth Index: If you're young, risk-tolerant, and seeking maximum returns, this index targets smaller-cap tokens with explosive potential. Volatility is higher but so are potential returns. Only choose this if you can stomach significant price swings.

• Sector-Specific Indices: Token Metrics offers indices focused on specific crypto sectors like DeFi, Layer-1 blockchains, AI tokens, or memecoins. Choose these if you believe strongly in a particular sector's growth potential.

For most beginners, starting with the Balanced Growth Index makes sense. It provides diversification, reasonable growth potential, and manageable volatility. You can always adjust later as you learn more.

Minutes 16-20: Determine Your Investment Amount

How much should you invest in crypto indices? This critical decision depends on your financial situation, but follow these general guidelines.

• Never invest money you need for living expenses. Crypto remains volatile. Only invest money you won't need for at least 3-5 years and that you could lose entirely without affecting your lifestyle.

• Start small while learning. If you're completely new to crypto, consider investing just $500-1,000 initially. Get comfortable with the process, experience some market volatility, and understand how indices work before committing larger amounts.

• Follow the 5-20% rule. Financial advisors typically recommend allocating 5-20% of your total investment portfolio to cryptocurrency depending on age and risk tolerance. If you have $50,000 in traditional investments, consider $2,500-10,000 in crypto.

• Use dollar-cost averaging. Rather than investing your entire amount immediately, spread purchases over 3-6 months. If you plan to invest $6,000, invest $1,000 monthly. This reduces timing risk and smooths out entry prices.

Write down your investment amount now so you don't invest emotionally based on market conditions. Stick to your predetermined plan regardless of whether markets are surging or crashing.

Minutes 21-25: Set Up Your Exchange Account and Funding

To invest in Token Metrics indices, you need to purchase the recommended cryptocurrencies through a cryptocurrency exchange. Major exchanges include Coinbase, Kraken, Binance.US, or Gemini.

• Choose one exchange and create an account. You'll need to provide identification for regulatory compliance—typically a driver's license or passport. This verification process usually takes a few hours to a few days, so you might need to pause here and return once approved.

• Once verified, connect a funding source. Most beginners use bank transfers, though credit cards and debit cards work too (often with higher fees). Transfer funds from your bank account to your exchange account. Bank transfers typically take 1-3 business days but have lower fees than card payments.

• For security, enable two-factor authentication (2FA) on your exchange account immediately. This adds an extra security layer requiring a code from your phone when logging in, protecting against unauthorized access.

Minutes 26-30: Make Your First Index-Aligned Purchases

Now comes the exciting part—your first crypto investments. Token Metrics indices provide specific recommendations about which tokens to buy and in what proportions.

Review your chosen index's current composition. It might show something like: 40% Bitcoin, 25% Ethereum, 15% Solana, 10% Avalanche, 10% Polkadot. These percentages tell you how to allocate your investment.

If investing $1,000, you'd buy approximately $400 in Bitcoin, $250 in Ethereum, $150 in Solana, $100 in Avalanche, and $100 in Polkadot. Round to reasonable amounts given minimum purchase requirements.

On your exchange, navigate to each cryptocurrency and execute market buy orders. A market order purchases at current market price immediately. For beginners, market orders are simplest—don't worry about limit orders or advanced trading features initially.

After purchasing, you can either leave assets on the exchange (simplest for beginners with small amounts) or transfer to a personal wallet (more secure for larger holdings). Initially, leaving assets on a reputable exchange is fine. Learn about wallet security as your investment grows.

Congratulations! You're now invested in crypto indices. The entire process took under 30 minutes.

Understanding What Happens Next: Ongoing Management

After your initial investment, understanding ongoing management helps you stay invested successfully.

Token Metrics indices rebalance regularly as market conditions change. You'll receive notifications when adjustments are recommended. These typically occur weekly, bi-weekly, or monthly. Follow the recommendations by making small adjustments—usually just a few minutes to execute.

Check your portfolio monthly rather than daily. Cryptocurrency volatility means dramatic day-to-day swings. Monthly reviews allow tracking overall trajectory without getting caught up in noise. Token Metrics provides performance tracking tools showing returns over various periods and comparing to benchmarks.

Occasionally rebalance your overall portfolio allocation. If crypto has grown from 10% to 25% of your total investments, consider taking profits to rebalance back to your target. This ensures you don't become overexposed during market euphoria.

Common Beginner Questions Answered

New investors often have the same questions and concerns. Here are straightforward answers.

"Is crypto investing safe?"

Cryptocurrency carries risk like all investments. However, indices are far safer than buying random tokens. Token Metrics' AI vetting filters out scams, diversification reduces risk, and professional management protects against emotional mistakes.

"What if I lose everything?"

This is why you only invest money you can afford to lose. Crypto indices are diversified across multiple assets, making total loss extremely unlikely. Individual tokens can fail, but portfolios of 10-30 carefully selected tokens provide resilience.

"How much can I make?"

Token Metrics indices have historically delivered returns significantly exceeding Bitcoin and Ethereum. Conservative indices might return 100-200% annually during bull markets. Aggressive indices could deliver 300-500%+. Bear markets may see negative returns—long-term holding is essential.

"What about taxes?"

Cryptocurrency transactions trigger capital gains taxes in most jurisdictions. Keep records of all transactions. Token Metrics provides transaction tracking to simplify tax preparation. Consult a tax professional for personalized guidance.

"Do I need a special wallet?"

For beginners with smaller amounts, keeping crypto on a reputable exchange is acceptable. As holdings grow beyond $10,000, consider a hardware wallet for additional security.

"Can I start with just $100?"

Yes! While larger amounts generate more absolute returns, you can start with any amount. Use small initial investments to learn and build confidence.

Your 30-Day Action Plan for Success

You've made your first investment. Here's your plan for the next 30 days to build upon this foundation.

• Days 1-7: Leave your investment alone. Resist checking prices constantly. Use this week to explore Token Metrics' educational resources and learn about the cryptocurrencies in your index.

• Days 8-14: Conduct your first performance review. Don't react emotionally to gains or losses. Review any rebalancing recommendations and execute them if suggested.

• Days 15-21: Evaluate whether your initial allocation feels appropriate. If you chose dollar-cost averaging, make your second purchase following your predetermined schedule.

• Days 22-30: Reflect on your first month. Did you stay calm during volatility? Are you confident in your strategy? Decide whether to continue your current approach or make adjustments.

After 30 days, continue monthly reviews, execute recommended rebalancing, and stick to your dollar-cost averaging schedule. Successful investing is about consistency and discipline, not constant activity.

Conclusion: Your Journey Begins Now

Cryptocurrency investing doesn't require technical expertise, complicated processes, or endless time commitment. Token Metrics AI Indices make professional-grade crypto investing accessible to anyone willing to follow a simple, proven system.

You've learned what indices are, why they're perfect for beginners, and exactly how to get started in 30 minutes. You understand ongoing management, have answers to common concerns, and possess a 30-day action plan for success.

The only thing remaining is action. Every day you delay is a day you're not participating in one of the most significant wealth creation opportunities of our generation. Markets don't wait for perfect timing—they reward those who begin with imperfect action.

Your 30-minute journey to crypto investing starts with a single click. Sign up for Token Metrics' 7-day free trial today, explore the indices, and make your first investment following this guide. Your future self will thank you for taking action now rather than watching from the sidelines as others build life-changing wealth.

The tools are available. The guidance is clear. The opportunity is now. Begin your Token Metrics journey today.

Research

Dogecoin (DOGE) Price Prediction to 2027: Scenario Ranges, Scores and Key Drivers

Token Metrics Team
6 min read

Why 2026 Looks Bullish, And What It Could Mean for DOGE

Crypto is transitioning into a broadly bullish regime into 2026 as liquidity improves and adoption deepens.

Regulatory clarity is reshaping the classic four-year cycle, flows can arrive earlier and persist longer as institutions gain confidence.

Access and infrastructure continue to mature with ETFs, qualified custody, and faster L2 scaling that reduce frictions for new capital.

Real‑world integrations expand the surface area for crypto utility, which supports sustained participation across market phases.

This backdrop frames our scenario work for DOGE. The bands below reflect different total market sizes and DOGE's share dynamics.

Read the TLDR first, then dive into grades, catalysts, and risks.


How to read it: Each band blends cycle analogues and market-cap share math with TA guardrails. Base assumes steady adoption and neutral or positive macro. Moon layers in a liquidity boom. Bear assumes muted flows and tighter liquidity.

TM Agent baseline: Token Metrics lead metric, TM Grade, is 22.65 (Sell), and the trading signal is bearish, indicating short-term downward momentum. Price context: $DOGE is trading around $0.193, rank #9, down about 3.1% in 24 hours and roughly 16% over 30 days. Implication: upside likely requires a broader risk-on environment and renewed retail or celebrity-driven interest.

Live details: Dogecoin Token Details → https://app.tokenmetrics.com/en/dogecoin

Buy DOGE

Key Takeaways

• Scenario driven, outcomes hinge on total crypto market cap, higher liquidity and adoption lift the bands.
• Technology: Technology Grade 54.58% (Activity 36%, Repository 72%, Collaboration 61%, Security N/A, DeFi Scanner N/A).
• TM Agent gist: cautious long‑term stance until grades and momentum improve.
• Education only, not financial advice.

Scenario Images

8T:   

16T:   

23T:   

31T:   

Why Consider the Indices with Top-100 Exposure

Diversification matters. Dogecoin is compelling, yet concentrated bets can be volatile. Token Metrics Indices hold DOGE alongside the top one hundred tokens for broad exposure to leaders and emerging winners.

Our backtests indicate that owning the full market with diversified indices has historically outperformed both the total market and Bitcoin in many regimes due to diversification and rotation.

Get early access

What Is Dogecoin?

Dogecoin is a peer-to-peer cryptocurrency that began as a meme but has evolved into a widely recognized digital asset used for tipping, payments, and community-driven initiatives. It runs on its own blockchain with inflationary supply mechanics. The token’s liquidity and brand awareness create periodic speculative cycles, especially during broad risk-on phases.

Technology Snapshot from Token Metrics

Technology Grade: 54.58% (Activity 36%, Repository 72%, Collaboration 61%, Security N/A, DeFi Scanner N/A).


Catalysts That Skew Bullish

• Institutional and retail access expands with ETFs, listings, and integrations.
• Macro tailwinds from lower real rates and improving liquidity.
• Product or roadmap milestones such as upgrades, scaling, or partnerships.

Risks That Skew Bearish

• Macro risk-off from tightening or liquidity shocks.
• Regulatory actions or infrastructure outages.
• Concentration or validator economics and competitive displacement.

Special Offer — Token Metrics Advanced Plan with 20% Off

Unlock platform-wide intelligence on every major crypto asset. Use code ADVANCED20 at checkout for twenty percent off.

• AI powered ratings on thousands of tokens for traders and investors.
• Interactive TM AI Agent to ask any crypto question.
• Indices explorer to surface promising tokens and diversified baskets.
• Signal dashboards, backtests, and historical performance views.
• Watchlists, alerts, and portfolio tools to track what matters.
• Early feature access and enhanced research coverage.

Start with Advanced today

FAQs

Can DOGE reach $1.00?

Yes, multiple tiers imply levels above $1.00 by the 2027 horizon, including the 23T Base and all 31T scenarios. Not financial advice.

Is DOGE a good long-term investment?

Outcome depends on adoption, liquidity regime, competition, and supply dynamics. Diversify and size positions responsibly.


Next Steps

• Track live grades and signals: Token Details
• Join Indices Early Access
• Want exposure Buy DOGE on MEXC

Disclosure

Educational purposes only, not financial advice. Crypto is volatile, do your own research and manage risk.

Research

Tron (TRX) Price Prediction to 2027: Scenario Ranges, Scores and Key Drivers

Token Metrics Team
6 min read

Why 2026 Looks Bullish, And What It Could Mean for TRX

The crypto market is shifting toward a broadly bullish regime into 2026 as liquidity improves and risk appetite normalizes.

Regulatory clarity across major regions is reshaping the classic four-year cycle, flows can arrive earlier and persist longer.

Institutional access keeps expanding through ETFs and qualified custody, while L2 scaling and real-world integrations broaden utility.

Infrastructure maturity lowers frictions for capital, which supports deeper order books and more persistent participation.

This backdrop frames our scenario work for TRX. The bands below map potential outcomes to different total crypto market sizes.

Use the table as a quick benchmark, then layer in live grades and signals for timing.


Current price: $0.2971.

How to read it: Each band blends cycle analogues and market-cap share math with TA guardrails. Base assumes steady adoption and neutral or positive macro. Moon layers in a liquidity boom. Bear assumes muted flows and tighter liquidity.

TM Agent baseline: Token Metrics TM Grade for $TRX is 19.06, which translates to a Strong Sell, and the trading signal is bearish, indicating short-term downward momentum. Price context: $TRX is trading around $0.297, market cap rank #10, and is down about 11% over 30 days while up about 80% year-over-year, it has returned roughly 963% since the last trading signal flip.

Live details: Tron Token Details → https://app.tokenmetrics.com/en/tron 

Buy TRX: https://www.mexc.com/acquisition/custom-sign-up?shareCode=mexc-2djd4 

Key Takeaways

• Scenario driven, outcomes hinge on total crypto market cap, higher liquidity and adoption lift the bands.
• TM Agent gist: bearish near term, upside depends on a sustained risk-on regime and improvements in TM Grade and the trading signal.
• Education only, not financial advice.

Price Predictions

8T:   

16T:   

23T:     

Why Consider the Indices with Top-100 Exposure

Diversification matters. Tron is compelling, yet concentrated bets can be volatile. Token Metrics Indices hold TRX alongside the top one hundred tokens for broad exposure to leaders and emerging winners.

Our backtests indicate that owning the full market with diversified indices has historically outperformed both the total market and Bitcoin in many regimes due to diversification and rotation.

Get early access: https://docs.google.com/forms/d/1AnJr8hn51ita6654sRGiiW1K6sE10F1JX-plqTUssXk/preview 

If your editor supports embeds, place a form embed here. Otherwise, include the link above as a button labeled Join Indices Early Access.

What Is Tron?

Tron is a smart-contract blockchain focused on low-cost, high-throughput transactions and cross-border settlement.

The network supports token issuance and a broad set of dApps, with an emphasis on stablecoin transfer volume and payments.

TRX is the native asset that powers fees and staking for validators and delegators within the network.

Developers and enterprises use the chain for predictable costs and fast finality, which supports consumer-facing use cases.

Catalysts That Skew Bullish

• Institutional and retail access expands with ETFs, listings, and integrations.
• Macro tailwinds from lower real rates and improving liquidity.
• Product or roadmap milestones such as upgrades, scaling, or partnerships.

Risks That Skew Bearish

• Macro risk-off from tightening or liquidity shocks.
• Regulatory actions or infrastructure outages.
• Concentration or validator economics and competitive displacement.

Special Offer — Token Metrics Advanced Plan with 20% Off

Unlock platform-wide intelligence on every major crypto asset. Use code ADVANCED20 at checkout for twenty percent off.

• AI powered ratings on thousands of tokens for traders and investors.
• Interactive TM AI Agent to ask any crypto question.
• Indices explorer to surface promising tokens and diversified baskets.
• Signal dashboards, backtests, and historical performance views.
• Watchlists, alerts, and portfolio tools to track what matters.
• Early feature access and enhanced research coverage.

Start with Advanced today → https://www.tokenmetrics.com/token-metrics-pricing 

FAQs

Can TRX reach $1?

Yes, the 23T moon case shows $1.02 and the 31T moon case shows $1.31, which imply a path to $1 in higher-liquidity regimes. Not financial advice.

Is TRX a good long-term investment

Outcome depends on adoption, liquidity regime, competition, and supply dynamics. Diversify and size positions responsibly.


Next Steps

Track live grades and signals: Token Details → https://app.tokenmetrics.com/en/tron 

Join Indices Early Access: https://docs.google.com/forms/d/1AnJr8hn51ita6654sRGiiW1K6sE10F1JX-plqTUssXk/preview

Want exposure Buy TRX on MEXC → https://www.mexc.com/acquisition/custom-sign-up?shareCode=mexc-2djd4 

Disclosure

Educational purposes only, not financial advice. Crypto is volatile, do your own research and manage risk.

Choose from Platinum, Gold, and Silver packages
Reach with 25–30% open rates and 0.5–1% CTR
Craft your own custom ad—from banners to tailored copy
Perfect for Crypto Exchanges, SaaS Tools, DeFi, and AI Products