Crypto Basics

Understanding the Altcoin Season Index: Your Complete Guide to Altcoin Market Dominance

Discover the Altcoin Season Index and how Token Metrics' AI platform helps traders identify optimal altcoin opportunities. Complete 2025 guide with current market insights.
Token Metrics Team
6 min
MIN

The cryptocurrency market operates in distinct cycles, with periods where Bitcoin dominates and others where alternative cryptocurrencies (altcoins) take center stage. Understanding when these shifts occur is crucial for successful crypto trading and investment. The Altcoin Season Index has emerged as the definitive metric for identifying these market transitions, providing traders and investors with essential insights into optimal timing for altcoin investments.

What is the Altcoin Season Index?

The Altcoin Season Index is a sophisticated metric that measures the relative performance of altcoins compared to Bitcoin over specific time periods. This indicator serves as a market sentiment gauge, helping traders identify when alternative cryptocurrencies are outperforming Bitcoin and whether the market has entered what's known as "Altcoin Season."

The index uses the top 100 coins ranked on CMC (excluding stablecoins and wrapped tokens) and compares them based on their rolling 90-day price performances. If 75% of the top 100 coins outperform Bitcoin in the last 90 days, it's Altcoin Season. Conversely, if only 25% or fewer altcoins outperform Bitcoin, the market is considered to be in "Bitcoin Season."

The methodology behind this index is straightforward yet effective. By analyzing the performance of the top-ranked cryptocurrencies against Bitcoin's price movements, the index creates a percentage score ranging from 0 to 100. A score above 75 indicates strong altcoin dominance, while a score below 25 suggests Bitcoin is leading the market.

How the Altcoin Season Index Works?

The calculation process involves several key components that ensure accuracy and relevance. Stablecoins like Tether and DAI, as well as asset-backed tokens (e.g., WBTC, stETH, cLINK), are excluded. This exclusion ensures that the index focuses on genuine price appreciation rather than pegged assets or derivatives.

Different platforms may use slightly varying methodologies. If 75% of the Top 50 coins performed better than Bitcoin over the last season (90 days) it is Altcoin Season. Some platforms focus on the top 50 cryptocurrencies, while others extend to the top 100, but the core principle remains consistent across all implementations.

The 90-day rolling window provides sufficient data to identify meaningful trends while remaining responsive to recent market movements. This timeframe helps filter out short-term volatility and focuses on sustained performance patterns that indicate genuine market shifts.

Current Market Status and Recent Trends

As of mid-2025, the cryptocurrency market is experiencing significant dynamics that reflect the utility of the Altcoin Season Index. The cryptocurrency market shows strong bullish momentum halfway through 2025, with Bitcoin reaching record highs near $122,946.00. This unprecedented Bitcoin performance has created interesting market conditions for altcoin investors.

Recent data shows varying altcoin performance across different categories. As of July 21, 2025, Stellar (XLM) is leading the pack, surging 74% for the week to trade at $0.527. Cardano (ADA) is up 23% at $1.004, and Ripple (XRP) has gained 21% this week to reach $3.92. These gains demonstrate that certain altcoins can achieve significant outperformance even during periods of strong Bitcoin dominance.

The market appears to be in a transitional phase. BTC dominance: ~60–61.5%—declining but not yet low enough. There is a strong interest in major alternative cryptocurrencies (alts) and large-cap coins. Into early/mid-phase alt season, not for quick whale-level meme pumps yet. This suggests that while we're not in full altcoin season, the conditions are developing for increased altcoin outperformance.

Historical Context and Market Cycles

Understanding historical altcoin seasons provides valuable context for current market conditions. The most notable altcoin season occurred in 2021, when the convergence of multiple factors created optimal conditions for alternative cryptocurrency growth. During this period, BTC's market dominance dropped from 70% to 38%, while the total market capitalization doubled from 30% to 62%. The altcoin season index hit 98 on April 16, 2021.

This historical precedent demonstrates the potential magnitude of altcoin seasons. When market conditions align, the shift from Bitcoin dominance to altcoin outperformance can be dramatic and sustained. The 2021 altcoin season was fueled by institutional adoption, decentralized finance (DeFi) growth, and the NFT boom, creating a perfect storm for alternative cryptocurrency appreciation.

Recent market activity has shown signs of renewed altcoin interest. The Altcoin Season Index, a widely tracked metric on CoinMarketCap (CMC), surged seven points to reach 84 on December 3, 2024. While this was a temporary spike, it demonstrated that altcoin seasons can emerge quickly when market conditions shift.

The Role of AI and Advanced Analytics in Altcoin Trading

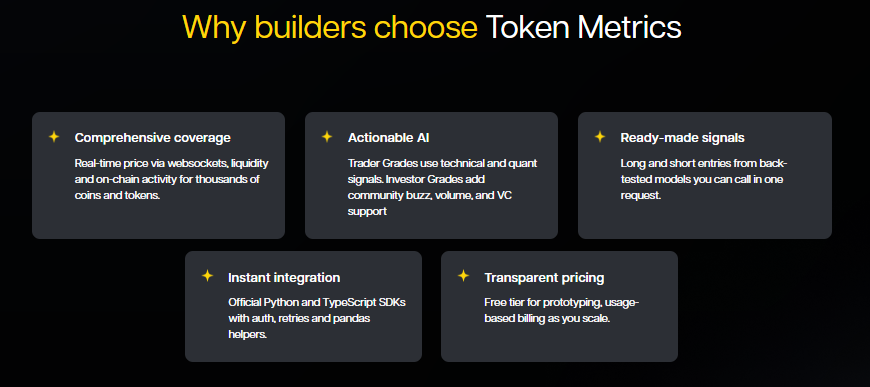
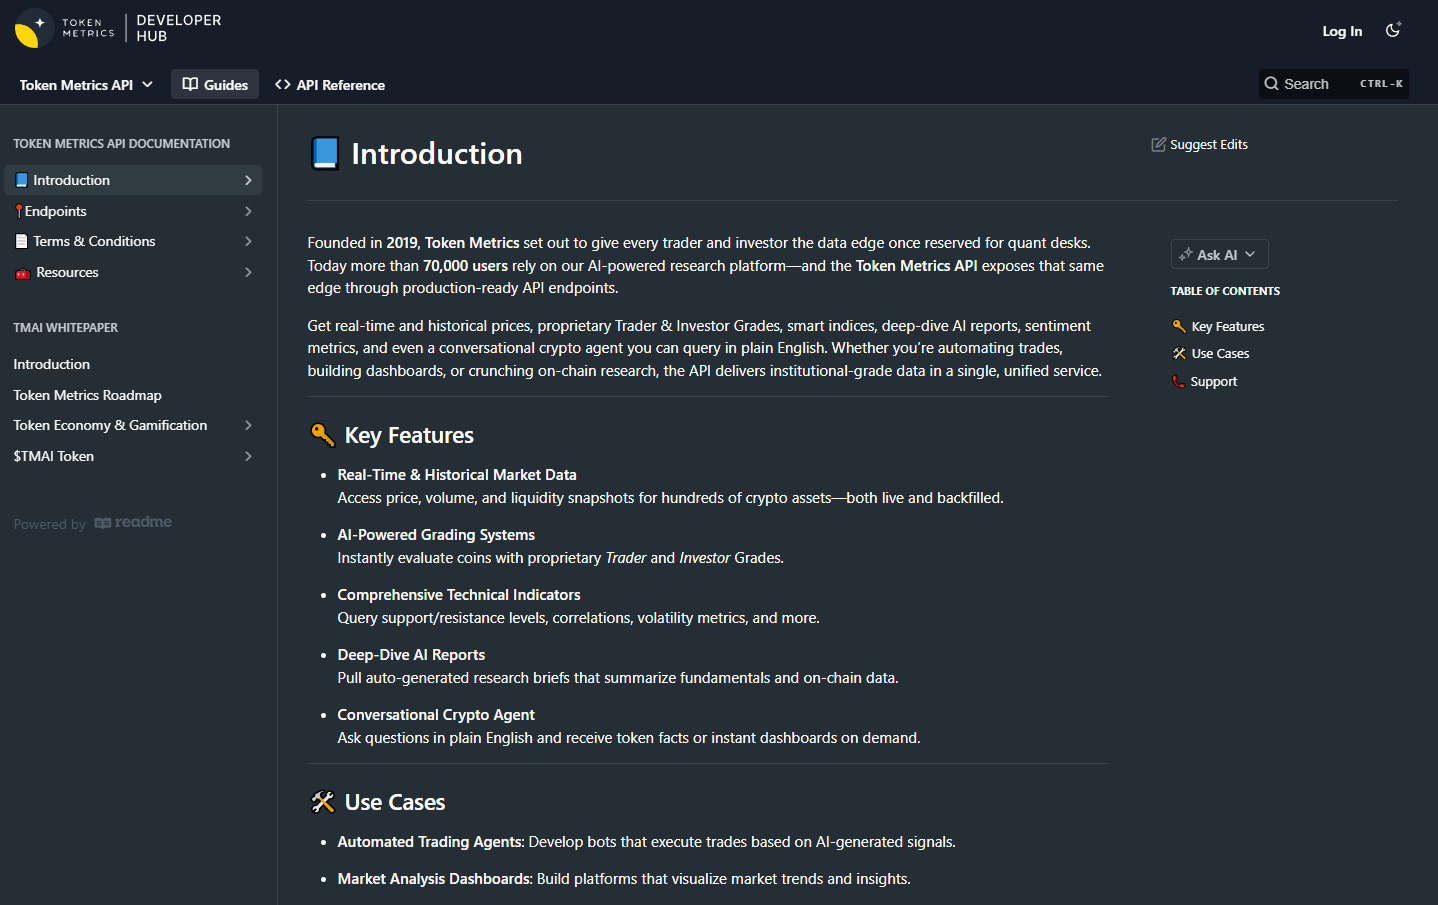
Modern altcoin trading has been revolutionized by artificial intelligence and advanced analytics platforms. Token Metrics stands at the forefront of this technological evolution, providing traders with unprecedented insights into altcoin markets. Trade and invest crypto with Token Metrics—your AI-powered platform for crypto trading, research, and data analytics.

The platform's sophisticated approach to market analysis sets it apart from traditional trading tools. Token Metrics scans 6,000+ tokens daily and gives each one a score based on technical analysis, on-chain data, fundamental metrics, sentiment and social data, and exchange data. This comprehensive analysis ensures that traders have access to multi-dimensional insights that go far beyond simple price movements.

Token Metrics' AI-driven methodology provides particular value during altcoin seasons. Token Metrics has developed an AI-powered rating system that scans the market 24/7, analyzing over 80 data points per token. Their Moonshots tab is designed specifically for users looking to spot early-stage altcoins before they break out. This capability is crucial for capitalizing on altcoin season opportunities, as the window for maximum gains often occurs in the early stages of market shifts.

Strategic Applications for Traders and Investors

The Altcoin Season Index serves multiple strategic purposes for different types of market participants. For swing traders, the index provides timing signals for portfolio rebalancing. When the index begins climbing toward 75, it may signal an opportune time to increase altcoin exposure while reducing Bitcoin allocation.

Long-term investors can use the index to identify accumulation opportunities. During Bitcoin seasons (index below 25), quality altcoins often trade at relative discounts, presenting attractive entry points for patient investors. This contrarian approach can be particularly effective when combined with fundamental analysis of individual projects.

Day traders benefit from understanding index trends to gauge market sentiment and momentum. Token Metrics' AI-driven platform exemplifies this shift, enabling traders to analyze market sentiment and identify patterns that human traders might overlook. Real-time sentiment analysis becomes crucial during transitional periods when the index hovers around the 50 mark.

Portfolio managers can use the index as a risk management tool. Sharp increases in the index during established bull markets may signal overheated conditions, suggesting the need for profit-taking or risk reduction. Conversely, low index readings during bear markets might indicate oversold conditions and potential accumulation opportunities.

Risk Management and Market Considerations

While the Altcoin Season Index provides valuable insights, it should not be used in isolation. Market conditions can change rapidly, and the 90-day rolling window means the index may lag sudden market shifts. Traders should combine index signals with other technical and fundamental analysis tools for comprehensive market assessment.

Regulatory developments, macroeconomic factors, and technological breakthroughs can all influence altcoin performance independently of historical patterns. The index should be viewed as one component of a broader analytical framework rather than a definitive trading signal.

Market manipulation and coordinated activities can temporarily skew individual altcoin performance, potentially affecting index calculations. This risk is mitigated by focusing on the top-ranked cryptocurrencies, but traders should remain aware of potential anomalies in index readings.

The Future of Altcoin Season Analysis

The evolution of altcoin markets continues to accelerate, driven by technological innovation and institutional adoption. AI-powered platforms like Token Metrics are becoming essential tools for navigating this complexity. Token Metrics, an AI-powered platform, consolidates research, portfolio management, and trading signals into a unified ecosystem.

As the cryptocurrency market matures, the dynamics underlying altcoin seasons may evolve. Increased institutional participation, regulatory clarity, and technological developments in blockchain infrastructure could create new patterns in altcoin performance cycles. The Altcoin Season Index will likely adapt to incorporate these changing market dynamics.

The integration of artificial intelligence and machine learning into market analysis represents the next frontier in cryptocurrency trading. These technologies can process vast amounts of data in real-time, identifying subtle patterns and correlations that human analysts might miss. This capability becomes particularly valuable during volatile market conditions when rapid decision-making is crucial.

Conclusion

The Altcoin Season Index has established itself as an indispensable tool for cryptocurrency traders and investors seeking to optimize their market timing and portfolio allocation. By providing clear, quantifiable metrics for measuring altcoin performance relative to Bitcoin, the index removes much of the guesswork from market cycle identification.

Success in altcoin trading requires more than just understanding market cycles; it demands sophisticated analytical tools and real-time data processing capabilities. Token Metrics represents the pinnacle of AI-driven cryptocurrency analysis, offering traders the advanced insights necessary to capitalize on altcoin season opportunities.

As the cryptocurrency market continues to evolve and mature, the combination of proven indicators like the Altcoin Season Index with cutting-edge AI analysis platforms will become increasingly important for sustained trading success. The future belongs to traders who can effectively combine traditional market wisdom with modern technological capabilities, positioning themselves to capture the significant opportunities that altcoin seasons provide.

Whether you're a seasoned trader or new to cryptocurrency markets, understanding and utilizing the Altcoin Season Index, supported by advanced analytics platforms like Token Metrics, will be crucial for navigating the complex and rewarding world of altcoin investing. The key lies in combining these powerful tools with sound risk management principles and a deep understanding of the underlying market dynamics that drive cryptocurrency performance cycles.

Build Smarter Crypto Apps &
AI Agents in Minutes, Not Months
Real-time prices, trading signals, and on-chain insights all from one powerful API.
Grab a Free API Key
Token Metrics Team
Token Metrics Team

Recent Posts

Token Metrics API

Best Crypto API: Power Your Apps with Data, Signals, and AI

Sam Monac
6 min
MIN

What Makes a Crypto API the “Best”?

The best cryptocurrency API isn’t just about raw data. It’s about empowering your application to perform faster, smarter, and more reliably. A truly great crypto API balances:

  • Depth of Coverage – Spot, DeFi tokens, and on-chain metrics.

  • Speed – Real-time, low-latency updates that can handle market volatility.

  • Intelligence – Analytics and AI-driven signals that go beyond price feeds.

  • Scalability – Infrastructure that grows with your user base.

  • Reliability – High uptime and SLA-backed performance guarantees.

Whether you’re building a high-frequency crypto trading bot, a DeFi portfolio tracker, or a research platform, choosing the right API means aligning features with your mission.

Key Features to Look for in a Crypto API

Before selecting a crypto API, evaluate these criteria:

  • Real-Time & Historical Data – Do you get both sub-second updates and multi-year backtesting datasets?

  • On-Chain Analytics – Can you track wallet behavior, liquidity shifts, or whale flows?

  • AI-Powered Insights – Does the API offer predictive signals, ratings, or trend forecasts?

  • Ease of Integration – Look for clean docs, SDKs, and community examples.

  • Reliability & Uptime – Providers should publish incident histories and SLA commitments.

  • Pricing & Scalability – Free tiers for testing, plus paid plans that make sense as you scale.

  • Compliance & Security – Encrypted endpoints and strong authentication are a must.

📌 Tip for builders: Always start with multiple free crypto APIs and benchmark them in your stack before committing long term.

Comparing Leading Crypto APIs: Strengths & Weaknesses

  • CoinGecko & CoinMarketCap


    • Strengths: Huge token coverage, easy for price tickers and charts.

    • Weaknesses: Limited historical and on-chain analytics, slower refresh rates.

  • CryptoCompare


    • Strengths: Deep historical trade data, useful for backtesting.

    • Weaknesses: Less emphasis on predictive insights or AI.

  • Glassnode


    • Strengths: Advanced on-chain metrics (network health, wallet flows).

    • Weaknesses: Best for researchers, less suited to trading bots or dashboards.

  • Alchemy & Infura


    • Strengths: Node-level blockchain access, ideal for dApps and DeFi projects.

    • Weaknesses: Provide raw blockchain data, not trading analytics.

  • Token Metrics API


    • Strengths: Combines real-time prices, AI trading signals, ratings, portfolio analytics, and on-chain intelligence in one API.

    • Weaknesses: Free tier has rate limits (scalable through paid plans).

Why Token Metrics API Stands Out

Most crypto APIs specialize in one dimension (prices, exchange data, or on-chain metrics). Token Metrics unifies them all and adds AI intelligence on top.

  • Comprehensive Coverage – Prices, historical datasets, indices, grades, and on-chain data.

  • AI Trading Signals – Unique bull/bear calls and predictive analytics unavailable in traditional APIs.

  • Portfolio Intelligence – Ratings and indices that give context to raw numbers.

  • Enterprise-Ready – Encrypted endpoints, authentication, and scalable infrastructure.

  • Developer Friendly – Clear docs, quick-start guides, and responsive support.

📌 Put simply: most crypto APIs give you data. Token Metrics gives you data + intelligence.

Use Cases: From AI Crypto Trading Bots to Research Dashboards

  • AI Trading Bots – Execute strategies using both real-time prices and predictive signals.

  • DeFi Dashboards – Aggregate wallet flows, liquidity data, and token ratings.

  • Crypto Research Tools – Combine historical OHLC data with Token Metrics grades.

  • AI Agents – Power AI apps with actionable signals, not just raw feeds.

  • Enterprise Analytics – Build institutional dashboards with indices and compliance-ready datasets.

Best Practices for Implementing a Crypto API

  1. Prototype Across Providers – Test CoinGecko, Token Metrics, and others in parallel.

  2. Abstract Your Integration – Use a middleware layer to make switching APIs easier.

  3. Secure Your Keys – Store credentials safely and rotate them regularly.

  4. Plan for Scale – Rate limits hit fast; design for bursts in traffic.

  5. Leverage AI-Enhanced APIs – This is where user expectations are heading.

📌 For production apps: always monitor crypto API latency and uptime with tools like Datadog or Grafana.

Beyond Token Metrics: Other Useful Resources

While Token Metrics API offers an all-in-one solution, developers can also explore other resources for specialized needs:

  • Dune Analytics – Great for custom SQL-based blockchain queries.

  • DefiLlama API – Free API focused on DeFi protocol yields and TVL.

  • Santiment API – Alternative on-chain and sentiment analytics.

  • TradingView – Charting and integration options for front-end visualizations.

📌 Strategy tip: many developers combine multiple APIs—Token Metrics for signals + CoinGecko for breadth + DefiLlama for yields—to cover all angles.

Frequently Asked Questions About Crypto APIs

Which crypto API is best overall?
If you want real-time data plus AI-powered insights, crypto api is used. Token Metrics Api is the strongest all-in-one option. For niche use cases, CoinGecko is good for prices, Glassnode for on-chain analytics.

Is Token Metrics API free?
Yes, the free tier is perfect for prototyping. Paid plans unlock faster throughput, more history, and advanced endpoints.

How is Token Metrics different from CoinGecko?
CoinGecko tracks prices broadly. Token Metrics layers AI signals, indices, and predictive analytics for trading and research.

Can I build a trading bot with Token Metrics API?
Yes—many developers use the low-latency price feeds and predictive signals to power automated strategies.

Scaling With Paid Plans and X.402

As your project grows, Token Metrics offers flexible upgrade paths:

  • Pay-Per-Call (X.402) – As low as $0.017 per call, no commitment. Unlimited calls, all endpoints, and 3 months of historical data.

  • Advanced Plan ($999.99/year) – 20,000 calls/month, access to indices & indicators, 3 WebSockets.

  • Premium Plan ($1,999.99/year) – 100,000 calls/month, all endpoints including AI Agent & Reports, 3 years of historical data, and 6 WebSockets.

With up to 35% discounts when paying in TMAI tokens, scaling is cost-efficient.

📌 Why X.402 matters: Instead of locking into an annual plan, you can scale gradually with pay-per-call pricing—perfect for startups and experimental apps.

Build Smarter, Scale Easier

The best crypto API doesn’t just serve data—it helps your app think, act, and adapt. With Token Metrics, you start free, learn fast, and scale seamlessly. Combine it with other specialized APIs when needed, and you’ll have a development stack that’s both powerful and future-proof.

👉 Grab Your Free Token Metrics API Key and Start Building

‍

Token Metrics API

Fast Crypto API: Real-Time Data Without the Lag

Sam Monac
9 min
MIN

Why Speed Matters in a Crypto API

In crypto, milliseconds can make or break a trade. Whether you’re building a high-frequency bot, a risk management tool, or a market dashboard, slow crypto APIs lead to:

  • Missed trade opportunities during volatility

  • Bots that lag behind signals

  • Dashboards that feel sluggish

  • Risk models that update too late

📌 Example: In a Bitcoin price swing, even a 500 ms delay can translate to thousands in lost value for trading bots. That’s why developers emphasize low latency when choosing best Crypto APIs.

What Defines a “Fast” Crypto API

Not every Crypto API marketed as “fast” is built the same. A truly fast crypto API provides:

  • Low Latency Feeds – Sub-second updates across major tokens and exchanges.

  • WebSocket Support – Push-based data streams instead of slower polling.

  • Scalable Infrastructure – Resilient under heavy traffic spikes.

  • Global Edge Delivery – Reduced latency for users worldwide.

📌 Tip for builders: Always benchmark an API in real market conditions (during volatility) to see if “fast” performance holds up under stress.

Comparing Fast Crypto APIs: Strengths & Limitations

  • CoinGecko / CoinMarketCap


    • Strengths: Broad token coverage, good for price tickers.

    • Limitations: Refresh cycles can lag; not ideal for bots or real-time dashboards.

  • CryptoCompare


    • Strengths: Strong historical data for research.

    • Limitations: Not optimized for ultra-fast live feeds.

  • Glassnode


    • Strengths: On-chain metrics and blockchain health insights.

    • Limitations: Focused on analytics, not real-time trading data.

  • Token Metrics API


    • Strengths: Sub-second updates, fast bull/bear signals, predictive AI, and on-chain metrics.

    • Limitations: Free tier includes rate limits (higher throughput available via X.402 or paid plans).

Token Metrics API: Fast + Intelligent

What sets Token Metrics API apart is that it’s not just fast data—it’s fast intelligence:

  • Real-Time Prices – Thousands of tokens continuously updated.

  • AI Trading Signals – Bull/bear predictions delivered instantly.

  • On-Chain Metrics – Track wallet flows, liquidity, and token behavior in near real time.

  • Scalable Performance – Built to withstand institutional-grade usage during volatility.

📌 Instead of just reacting to prices, developers can anticipate market shifts with AI-driven signals.

Use Cases: From Trading Bots to AI Agents

  • High-Frequency Trading Bots – Execute strategies using low-latency feeds and predictive signals.

  • DeFi Dashboards – Display liquidity flows and token activity in real time.

  • Risk Management Systems – Keep risk models updated second by second.

  • AI Agents – Power intelligent assistants with actionable streaming data.

Best Practices for Building With Fast APIs

  1. Use WebSockets – Relying only on REST endpoints introduces unnecessary delay.

  2. Benchmark During Volatility – Test APIs when the market is busiest.

  3. Optimize Request Handling – Cache where possible to avoid unnecessary calls.

  4. Monitor Latency – Use observability tools like Grafana or New Relic to track delays.

  5. Failover Strategy – Have a backup API (e.g., CoinGecko) if primary data slows.

Beyond Token Metrics: Other Tools to Explore

Token Metrics API excels at fast data + signals, but developers often combine it with other tools for a full-stack setup:

  • DefiLlama API – Best for free DeFi protocol data and yield metrics.

  • Dune Analytics – Query blockchain data in real time with SQL.

  • TradingView Webhooks – Add instant chart-based triggers for front ends.

  • Kaiko / Amberdata – Enterprise-grade APIs for institutional price feeds.

📌 Pro tip: Use Token Metrics for predictive signals, and pair it with TradingView or DefiLlama for visualization and DeFi-specific data.

How to Start Using the Token Metrics Fast API

  1. Sign Up Free – Create a Token Metrics account.

  2. Generate Your API Key – Instantly available in your dashboard.

  3. Choose WebSockets or REST – Based on your use case.

  4. Start Building – Bots, dashboards, or risk models with sub-second data.

👉 Get Your Free Token Metrics API Key

Scaling Fast With Paid Plans & X.402

When free limits aren’t enough, Token Metrics offers:

  • Pay-Per-Call (X.402) – From $0.017 per call, unlimited usage, all endpoints, and 3 months of history.

  • Advanced Plan ($999.99/year) – 20,000 calls/month, indices & indicators, 3 WebSockets.

  • Premium Plan ($1,999.99/year) – 100,000 calls/month, AI agent + reports, 3 years of history.

📌 Why X.402 matters: You can start scaling instantly with no upfront cost—just pay per call as you grow.

Build With the Fastest Insights in Crypto

In crypto, speed without intelligence is noise. With Token Metrics Fast Crypto API, you get sub-second price data + AI-driven insights, giving your trading bots, dashboards, and AI agents the real-time edge they need.

👉 Start Free With Token Metrics API

Token Metrics API

Best Crypto Prices API: Accurate, Real-Time, and AI-Enhanced

Sam Monac
8 min
MIN

Why Price Data Is the Core of Every Crypto App

No matter what kind of crypto app you’re building—a trading bot, a DeFi dashboard, or a research tool—the foundation is always accurate price data. Without it:

  • Traders miss entry and exit points.

  • Bots execute late or incorrectly.

  • Dashboards lose credibility with users.

  • Researchers can’t properly backtest models.

The best crypto prices API ensures:

  • Live, accurate prices across thousands of tokens.

  • Deep historical data (OHLC, tick-level) for research and backtesting.

  • Reliable updates even during volatile market swings.

  • Flexibility to support both real-time trading and long-term analytics.

📌 Example: An arbitrage bot relying on stale or inaccurate data won’t just underperform—it could lose money on every trade.

What Makes the Best Crypto Prices API

Not every API marketed for prices is built for precision. Key factors to consider include:

  • Accuracy – Are prices aggregated across multiple exchanges and validated?

  • Latency – Do you get sub-second updates with WebSocket streaming?

  • Historical Depth – Can you access years of OHLC and tick-level data?

  • Coverage – Spot markets, DeFi tokens, stablecoins, and derivatives.

  • Scalability – Rate limits that grow with your application’s user base.

  • Developer Experience – SDKs, documentation, and active support.

📌 Tip for developers: Start by asking, “Do I need accuracy, speed, or depth the most?” The answer often determines which API fits your project.

Comparing Leading Crypto Price APIs: Strengths & Trade-offs

  • CoinGecko & CoinMarketCap


    • Strengths: Excellent breadth—tens of thousands of tokens covered.

    • Trade-offs: Updates refresh more slowly; historical depth limited. Best for tickers and retail dashboards.

  • CryptoCompare


    • Strengths: Solid historical trade-level datasets for backtesting.

    • Trade-offs: Real-time speed is weaker than competitors.

  • Glassnode


    • Strengths: Advanced on-chain insights.

    • Trade-offs: Pricing data isn’t their main strength; better for researchers than traders.

  • Kaiko / Amberdata


    • Strengths: Enterprise-grade accuracy, broad market coverage.

    • Trade-offs: Expensive, geared toward institutions.

  • Token Metrics API
    • Strengths: Combines real-time accuracy, deep history, and AI-enhanced insights—giving more than raw prices.

    • Trade-offs: Free tier has rate limits (higher throughput unlocked via X.402 or paid plans).

Why Token Metrics API Stands Out

Where many crypto APIs stop at providing raw price feeds, Token Metrics API enriches price data with context and intelligence.

  • Real-Time Prices – Sub-second updates for Bitcoin, Ethereum, and thousands of tokens.

  • Deep Historical Data – Tick-level and OHLC datasets ideal for research.

  • Exchange-Aware Accuracy – Prices aggregated from multiple sources and validated for reliability.

  • AI Trading Signals – Bull/bear indicators layered on top of raw prices.

  • Portfolio Ratings – Token Metrics grades and indices for added context.

📌 Most crypto APIs give you numbers. Token Metrics gives you numbers + insights.

Use Cases: From Crypto Trading Bots to Dashboards

  • Trading Bots – Execute trades with accurate, low-latency feeds.

  • Market Dashboards – Provide users with credible, real-time prices and charts.

  • Backtesting Platforms – Use multi-year OHLCV data for strategy validation.

  • DeFi Trackers – Monitor token values and liquidity with precision.

  • AI Agents – Train ML models using validated, exchange-aware price data.

Best Practices for Working With Crypto Price Data

  1. Cross-Verify Prices – Use multiple APIs in parallel during testing.

  2. Cache Effectively – Cache non-volatile data to reduce API load.

  3. Use WebSockets – REST-only setups can introduce delays.

  4. Monitor Latency – Benchmark APIs during volatility (e.g., CPI announcements, Fed decisions).

  5. Plan for Failover – Integrate a secondary API as a backup if your primary feed fails.

📌 Example: Production apps can combine Token Metrics for intelligence + CoinGecko for breadth to balance reliability with insights.

Beyond Token Metrics: Other Crypto Price Data Resources

Developers often mix and match APIs to cover specialized needs:

  • DefiLlama API – For DeFi protocol yields and TVL.

  • Dune Analytics – Run SQL queries for custom blockchain metrics.

  • TradingView Widgets / Webhooks – For embedding charting into front ends.

  • Santiment – Adds sentiment data to complement price feeds.

Pairing Token Metrics with these resources gives developers a multi-layered data stack—accurate prices, predictive signals, and extra DeFi/social context.

How to Get Started With the Best Prices API

  1. Sign Up Free – Create a Token Metrics account.

  2. Generate Your API Key – Available instantly in your dashboard.

  3. Access Price Endpoints – Fetch real-time and historical datasets via REST or WebSockets.

  4. Start Building – Bots, dashboards, or backtesting frameworks.

  5. Upgrade When Ready – Scale throughput and unlock advanced endpoints.

👉 Get Your Free Token Metrics API Key

FAQs on Crypto Price APIs

Which crypto API has the best price accuracy?
Token Metrics validates data from multiple exchanges, ensuring cleaner and more reliable price feeds.

Can I get historical prices with Token Metrics API?
Yes—OHLC and tick-level datasets are available for multi-year backtesting.

Is the Token Metrics API free?
Yes, there’s a free tier for prototypes. Paid plans unlock higher request rates and advanced data.

How fast are Token Metrics updates?
Sub-second latency with WebSocket support for real-time responsiveness.

Scaling Beyond Free: Paid Plans & X.402

As your project scales, Token Metrics makes upgrading simple:

  • Pay-Per-Call (X.402) – From $0.017 per call, unlimited usage, no commitment.

  • Advanced Plan ($999.99/year) – 20,000 calls/month, indices & indicators, 3 WebSockets.

  • Premium Plan ($1,999.99/year) – 100,000 calls/month, AI agent & reports, 3 years of historical data.

📌 Why X.402 matters: Instead of locking into annual costs, you can pay as you grow—ideal for startups and experimental apps.

Build With the Best Crypto Prices API

In crypto, price accuracy is trust. Whether you’re building a bot, a dashboard, or a research tool, Token Metrics provides more than just numbers. With validated prices, deep history, and AI-enhanced insights, you can build applications that stand out.

👉 Start Free With Token Metrics API

‍

‍

Choose from Platinum, Gold, and Silver packages
Reach with 25–30% open rates and 0.5–1% CTR
Craft your own custom ad—from banners to tailored copy
Perfect for Crypto Exchanges, SaaS Tools, DeFi, and AI Products