Back to blog
Research

Uniswap Price Prediction 2027: $13.50-$43 Target Analysis

Actionable Uniswap price prediction with scenario math, on-chain grades, and a clear TLDR for investors looking at 2027
Token Metrics Team
8 min read
Want Smarter Crypto Picks—Free?
See unbiased Token Metrics Ratings for BTC, ETH, and top alts.
Thank you! Your submission has been received!
Oops! Something went wrong while submitting the form.
 No credit card | 1-click unsubscribe

Uniswap Price Prediction: Market Context for UNI in the 2027 Case

DeFi protocols are maturing beyond early ponzi dynamics toward sustainable revenue models. Uniswap operates in this evolving landscape where real yield and proven product market fit increasingly drive valuations rather than speculation alone. Growing regulatory pressure on centralized platforms creates tailwinds for decentralized alternatives.

The price prediction scenario bands below reflect how UNI might perform across different total crypto market cap environments. Each tier represents a distinct liquidity regime, from bear conditions with muted DeFi activity to moon price prediction scenarios where decentralized infrastructure captures significant value from traditional finance.


Disclosure

Educational purposes only, not financial advice. Crypto is volatile, do your own research and manage risk.

How to read this price prediction:

Each band blends cycle analogues and market cap share math with TA guardrails. Base assumes steady adoption and neutral or positive macro. Moon layers in a liquidity boom. Bear assumes muted flows and tighter liquidity.

TM Agent baseline:

Token Metrics TM Grade is 69%, Buy, and the trading signal is bullish. Price prediction scenarios cluster roughly between $6.50 and $28, with a base case price target near $13.50.

Live details: Uniswap Token Details 

Affiliate Disclosure: We may earn a commission from qualifying purchases made via this link, at no extra cost to you.

Key Takeaways

  • Scenario driven, outcomes hinge on total crypto market cap, higher liquidity and adoption lift the bands.
  • Fundamentals: Fundamental Grade 79.88% (Community 77%, Tokenomics 100%, Exchange 100%, VC 66%, DeFi Scanner 62%).
  • Technology: Technology Grade 86.88% (Activity 72%, Repository 72%, Collaboration 100%, Security N/A, DeFi Scanner 62%).
  • TM Agent gist: bullish bias with a base case near $13.50 and a broad range between $6.50 and $28.
  • Education only, not financial advice.

Uniswap Price Prediction: Scenario Analysis

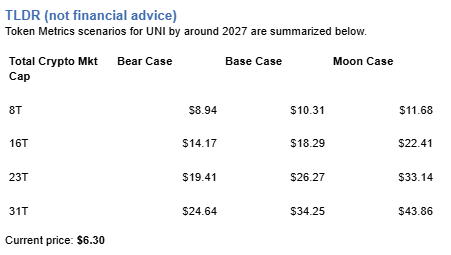
Token Metrics price prediction scenarios span four market cap tiers, each representing different levels of crypto market maturity and liquidity:

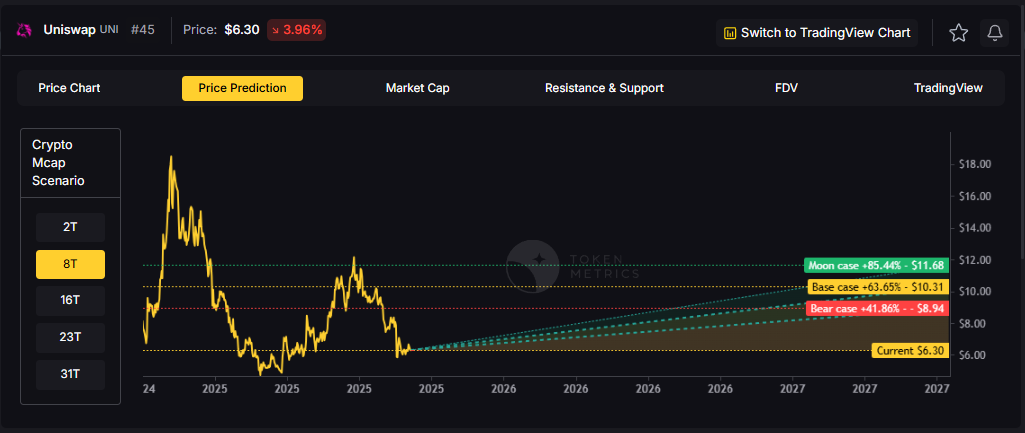
8T Market Cap Price Prediction:

At an 8 trillion dollar total crypto market cap, UNI price prediction projects to $8.94 in bear conditions, $10.31 in the base case, and $11.68 in bullish scenarios.

16T Market Cap Price Prediction:

Doubling the market to 16 trillion expands the price prediction range to $14.17 (bear), $18.29 (base), and $22.41 (moon).

23T Market Cap Price Prediction:

At 23 trillion, the price forecast scenarios show $19.41, $26.27, and $33.14 respectively.

31T Market Cap Price Prediction:

In the maximum liquidity scenario of 31 trillion, UNI price prediction could reach $24.64 (bear), $34.25 (base), or $43.86 (moon).

Each tier assumes progressively stronger market conditions, with the base case price prediction reflecting steady growth and the moon case requiring sustained bull market dynamics.

Why Consider the Indices with Top-100 Exposure

Uniswap represents one opportunity among hundreds in crypto markets. Token Metrics Indices bundle UNI with top one hundred assets for systematic exposure to the strongest projects. Single tokens face idiosyncratic risks that diversified baskets mitigate.

Historical index performance demonstrates the value of systematic diversification versus concentrated positions.

Join the early access list

What Is Uniswap?

Uniswap is a decentralized exchange protocol built on Ethereum that enables token swaps using automated market makers instead of order books. It aims to provide open access to liquidity for traders, developers, and applications through transparent smart contracts.

UNI is the governance token that lets holders vote on protocol upgrades and parameters, aligning incentives across the ecosystem. The protocol is a market leader in decentralized exchange activity with broad integration across wallets and DeFi apps.

Token Metrics AI Analysis for Price Prediction

Token Metrics AI provides comprehensive context on Uniswap's positioning and challenges that inform our price prediction models.

Vision: Uniswap aims to create a fully decentralized and permissionless financial market where anyone can trade or provide liquidity without relying on centralized intermediaries. Its vision emphasizes open access, censorship resistance, and community driven governance.

Problem: Traditional exchanges require trusted intermediaries to match buyers and sellers, creating barriers to access, custody risks, and potential for censorship. In DeFi, the lack of efficient, trustless mechanisms for token swaps limits interoperability and liquidity across applications.

Solution: Uniswap solves this by using smart contracts to create liquidity pools funded by users who earn trading fees in return. The protocol automatically prices assets using a constant product formula, enabling seamless swaps. UNI token holders can participate in governance, influencing parameters like fee structures and protocol upgrades.

Market Analysis: Uniswap operates within the broader DeFi and Ethereum ecosystems, competing with other decentralized exchanges like SushiSwap, Curve, and Balancer. It is a market leader in terms of cumulative trading volume and liquidity depth. Adoption is strengthened by strong developer activity, widespread integration across wallets and dApps, and a large user base.

Fundamental and Technology Snapshot from Token Metrics

Fundamental Grade: 79.88% (Community 77%, Tokenomics 100%, Exchange 100%, VC 66%, DeFi Scanner 62%).


Technology Grade: 86.88% (Activity 72%, Repository 72%, Collaboration 100%, Security N/A, DeFi Scanner 62%).

Catalysts That Skew Bullish for Price Prediction

  • Institutional and retail access expands with ETFs, listings, and integrations
  • Macro tailwinds from lower real rates and improving liquidity
  • Product or roadmap milestones such as upgrades, scaling, or partnerships
  • These factors could push UNI toward higher price prediction targets

Risks That Skew Bearish for Price Prediction

  • Macro risk off from tightening or liquidity shocks
  • Regulatory actions or infrastructure outages
  • Competitive displacement across DEXs or changes to validator and liquidity incentives
  • These factors could push UNI toward lower price prediction scenarios

FAQs: Uniswap Price Prediction

Will UNI hit $20 by 2027 according to price predictions?

‍The 16T price prediction scenario shows UNI at $18.29 in the base case, which does not exceed $20. However, the 23T base case shows $26.27, surpassing the $20 target. Price prediction outcome depends on total crypto market cap growth and Uniswap maintaining market share. Not financial advice.

Can UNI 10x from current levels based on price predictions?

‍At current price of $6.30, a 10x would reach $63.00. This falls within none of the listed price prediction scenarios, which top out at $43.86 in the 31T moon case. Bear in mind that 10x returns require substantial market cap expansion beyond our modeled scenarios. Not financial advice.

What price could UNI reach in the moon case price prediction?

‍Moon case price predictions range from $11.68 at 8T to $43.86 at 31T total crypto market cap. These price prediction scenarios assume maximum liquidity expansion and strong Uniswap adoption. Not financial advice.

What is the 2027 Uniswap price prediction?

‍Based on Token Metrics analysis, the 2027 price prediction for Uniswap centers around $13.50 in the base case under current market conditions, with a range between $6.50 and $28 depending on market scenarios. Bullish price predictions with strong market conditions range from $10.31 to $43.86 across different total crypto market cap environments.

What drives UNI price predictions?

‍UNI price predictions are driven by DEX trading volume, liquidity provider activity, governance participation, protocol fee revenue, and competition from other decentralized exchanges. The strong technology grade (86.88%) and bullish signal support upward price potential. DeFi adoption rates and regulatory clarity around decentralized exchanges remain primary drivers for reaching upper price prediction targets.

Can UNI reach $30-$40 by 2027?

‍According to our price prediction models, UNI could reach $30-$40 in the 23T moon case ($33.14) and in the 31T scenarios where the base case is $34.25 and the moon case is $43.86. These price prediction outcomes require significant crypto market expansion and Uniswap maintaining DEX market leadership. Not financial advice.


Next Steps

Disclosure

Educational purposes only, not financial advice. Crypto is volatile, do your own research and manage risk.

Why Use Token Metrics for Uniswap Research?

  • Get on-chain ratings, AI-powered scenario projections, backtested indices, and exclusive insights for Uniswap and other top-100 crypto assets.
  • Spot emerging trends before the crowd and manage risk with our transparent AI grades.
  • Token Metrics helps you save time, avoid hidden pitfalls, and discover data-driven opportunities in DeFi.
Build Smarter Crypto Apps &
AI Agents in Minutes, Not Months
Real-time prices, trading signals, and on-chain insights all from one powerful API.
Grab a Free API Key
About Token Metrics
Token Metrics: AI-powered crypto research and ratings platform. We help investors make smarter decisions with unbiased Token Metrics Ratings, on-chain analytics, and editor-curated “Top 10” guides. Our platform distills thousands of data points into clear scores, trends, and alerts you can act on.
30 Employees
analysts, data scientists, and crypto engineers
Daily Briefings
concise market insights and “Top Picks”
Transparent & Compliant
Sponsored ≠ Ratings; research remains independent
Want Smarter Crypto Picks—Free?
See unbiased Token Metrics Ratings for BTC, ETH, and top alts.
Thank you! Your submission has been received!
Oops! Something went wrong while submitting the form.
 No credit card | 1-click unsubscribe
Token Metrics Team
Token Metrics Team

Recent Posts

Research

How Token Metrics AI Actually Works: Inside the Technology Behind 8000% Returns

Token Metrics Team
12

You've seen the results: 8000% returns since inception, consistent outperformance across market cycles, and systematic risk management that protects capital during downturns. But how does Token Metrics' AI actually achieve these outcomes?

Most platforms hide behind vague promises of “artificial intelligence” and “machine learning” without explaining what that means. For sophisticated investors, this opacity creates legitimate skepticism. If you can't understand how something works, how can you trust it with your capital?

This article pulls back the curtain on Token Metrics' AI technology. We'll explain the data sources, algorithms, decision-making processes, and quality controls that enable consistent performance. No marketing fluff—just honest technical explanation accessible to investors without computer science degrees.

By understanding the “how,” you'll gain confidence in the “why” Token Metrics works.

Get Started For Free

The Foundation: 80+ Data Points Per Token

Token Metrics' AI doesn't make decisions based on hunches or simple price charts. It analyzes over 80 distinct data points for every cryptocurrency before making allocation decisions.

The AI Model Architecture

Token Metrics doesn't use a single algorithm—it employs an ensemble of specialized machine learning models working in concert.

The Multi-Model Ensemble Approach

The Decision Integration Process

The five models don't vote independently. Token Metrics uses a weighted ensemble approach where each model's output combines into a final composite score.


Final Score = (0.35 Ă— Fundamental) + (0.25 Ă— Technical) + (0.20 Ă— On-Chain) + (0.15 Ă— Sentiment) - (Risk_Penalties)

Token Selection Threshold:

Real Example: Solana in Early 2021:

The Learning and Adaptation Process

Static models become obsolete quickly in crypto's rapidly evolving environment. Token Metrics' AI continuously learns and adapts.

Continuous Model Retraining

What This Means: The AI learns from every market cycle, every token launch, every trend. Mistakes become lessons that improve future decisions.

Feedback Loop Integration

Market Regime Detection

The AI doesn't just analyze individual tokens—it identifies overall market conditions and adjusts accordingly.

How Detection Works: The system analyzes correlation patterns, volatility measures, volume trends, and sentiment indicators to classify current market state. When regime shifts are detected, index strategies automatically adjust.

Get Started For Free

Quality Control and Human Oversight

Despite advanced AI, Token Metrics maintains human oversight to prevent catastrophic errors.

The Three-Layer Validation System

Result: The AI provides intelligence and recommendations, but humans maintain ultimate control preventing algorithmic errors from causing harm.

The Data Infrastructure

Garbage in, garbage out. Token Metrics' AI is only as good as its data sources.

Primary Data Sources

Data Quality Assurance

Example: If one exchange shows wildly different price than others, that data point is flagged and excluded to prevent wash trading or manipulation from affecting decisions.

Comparing Token Metrics to Other Approaches

Understanding how Token Metrics differs from alternatives clarifies its value proposition.

Limitations and Honest Disclaimers

No system is perfect. Understanding limitations is crucial for realistic expectations.

The Future of Token Metrics AI

The system continues evolving with emerging technologies and capabilities.

Your AI-Powered Advantage

Understanding how Token Metrics AI works reveals why it delivers consistent outperformance: comprehensive data, sophisticated multi-model architecture, continuous learning, and human oversight create a system that combines the best of algorithmic intelligence with human wisdom.

The technology isn't magic—it's rigorous data science, proven methodologies, and years of refinement through real-world market conditions.

The question isn't whether you understand every technical detail. The question is whether the systematic, data-driven approach makes more sense than emotional human decision-making or simple rule-based strategies.

For most investors, the answer is clear.

Ready to leverage AI-powered investing? Visit Token Metrics to access the technology delivering consistent crypto market outperformance.

Discover Crypto Gems with Token Metrics AI

Token Metrics uses AI-powered analysis to help you uncover profitable opportunities in the crypto market.

Get Started For Free

FAQ

How many data points does Token Metrics AI analyze per token?

Token Metrics AI examines over 80 quantitative and qualitative data points for every cryptocurrency. These span fundamental analysis, technical indicators, on-chain activity, tokenomics, and sentiment metrics for a comprehensive view.

What machine learning models are used in Token Metrics?

The platform employs an ensemble of models, including gradient boosting decision trees, recurrent neural networks, random forests, natural language processing, and anomaly detection frameworks. Each model focuses on a specific data category and output.

How does Token Metrics AI adapt to changing crypto markets?

Token Metrics AI is continuously retrained with new data on a weekly basis. The platform learns from past predictions, integrates feedback from trading outcomes, and adapts its weighting of models as market conditions change.

How does Token Metrics ensure data quality and minimize manipulation?

Data is aggregated from multiple sources and undergoes cross-verification, anomaly detection, and outlier filtering. Inaccurate or manipulated data points are flagged and excluded to preserve the integrity of analysis.

What are the key limitations of Token Metrics AI?

While advanced, Token Metrics AI cannot predict unprecedented market events, guarantee future performance, or fully eliminate crypto volatility. Human oversight and due diligence from users remain essential.

Get Started For Free

Disclaimer

This article is for educational purposes only and should not be considered financial advice. The AI systems described are current as of 2025 and continue evolving. Cryptocurrency investments carry significant risk, including the possibility of complete capital loss. Past performance does not guarantee future results. Always conduct your own research and consult with qualified financial advisors before making investment decisions.

Research

Crypto Indices vs Traditional Portfolios: The Modern Investor's Dilemma in 2025

Token Metrics Team
8

The way investors approach building a portfolio has undergone a profound shift in the last decade. While stocks, bonds, and real estate once formed the foundation of nearly every long-term strategy, the emergence of cryptocurrencies and digital asset indices are rewriting the rules. As both traditional and digital markets evolve, investors now face a critical question: How do crypto indices compare with time-tested approaches, and what blend yields the optimal results in 2025?

The Traditional Portfolio Baseline

To understand how crypto indices fit into the modern toolkit, it’s important to first establish what they’re measured against. The classic 60/40 portfolio—60% U.S. stocks and 40% U.S. bonds—has delivered annual returns of roughly 7.2% over the past two decades with a standard deviation of 11.3% and a Sharpe ratio of 0.48. Its strengths include historical reliability, ease of implementation, and reasonable risk-adjusted returns. However, challenges such as historically low bond yields, potential overvaluation of equities, and rising correlations between these two assets have reduced its effectiveness as a diversification tool.

The modern 80/20 growth portfolio, involving 80% U.S. stocks and 20% international stocks, increases growth potential (8.9% annual return, 14.7% standard deviation, 0.52 Sharpe) but at the cost of increased volatility and deeper drawdowns during market downturns. For pure growth metrics, the S&P 500 index—100% equities—delivered about 9.7% annually with 15.8% standard deviation and a 0.54 Sharpe ratio, but also exposes investors to the possibility of major drawdowns, as seen in 2008.

Token Metrics Crypto Indices Performance

Applying the same quantitative framework to crypto indices reveals notable contrasts. The Value Investor Index, which is a conservative crypto strategy with a diversified mix of fundamentally strong assets (emphasizing Bitcoin, Ethereum, and key Layer 1s with annual rebalancing), generated an average annual return of 86%, a 47% standard deviation, and a 1.68 Sharpe ratio since 2020. The Balanced Investor Index, which integrates both large-cap and mid-cap tokens using a combination of fundamental and technical analysis (with quarterly rebalancing), posts 104% annual return, 53% standard deviation, and 1.87 Sharpe. Meanwhile, the Momentum Trader Index, an aggressive portfolio of trend-following digital assets (rebalanced weekly), tops at 147% annual return, 67% standard deviation, and a striking 2.09 Sharpe ratio.

Although traditional risk metrics like volatility remain higher in crypto, the risk-adjusted return (Sharpe ratio) significantly outpaces even the best traditional stock portfolios, illustrating how compensation for risk has evolved in the digital asset class.

The Direct Comparison: What Do Numbers Tell Us?

Consider an initial investment of $100,000. Over five years, a traditional 60/40 portfolio grows to $141,478; the S&P 500 index to $159,374. By contrast, a similarly sized allocation to Token Metrics crypto indices could historically result in:

Even accounting for volatility, these outcomes represent a multiple of the traditional gains. The Sharpe ratios for crypto indices (1.68-2.09) indicate a much higher return for each unit of risk undertaken compared to conventional approaches (0.48-0.54).

The Correlation Advantage

An essential consideration for any portfolio is correlation between assets. Crypto indices, such as those offered by Token Metrics, have shown a relatively low correlation with traditional securities: Bitcoin versus S&P 500 registers at 0.35, and broader crypto indices at 0.31. Correlation with U.S. bonds is even lower (0.09 for Bitcoin, and 0.12 for indices). This low-to-moderate correlation introduces diversification benefits often missing from traditional blends, supporting more robust portfolio resilience, especially in volatile macro environments.

Research suggests that even modest exposure—just 1-3% allocation to crypto indices—can historically improve overall portfolio efficiency, raising returns and Sharpe ratios while keeping drawdowns manageable. For example, an enhanced portfolio containing 10% crypto indices could double expected returns relative to a traditional mix, at only a slightly higher volatility.

The Optimal Allocation Strategy

Diversification frameworks for crypto exposure vary by risk profile. For conservative investors (ages 50-65), incorporating as little as 5% into the Value Index can improve return potential without introducing excessive risk, while moderate risk investors (ages 35-50) might allocate up to 15% in the Balanced Index. Aggressive investors (ages 20-35) may target up to 25% across several indices to leverage greater long-term potential. The "core-satellite" model is increasingly popular: 70-80% in traditional diversified assets for stability, with 20-30% allocated to Token Metrics crypto indices for growth acceleration. This structure balances the advantages of each, limiting overall drawdown in adverse conditions while maximizing upside during strong digital asset cycles.

Addressing Traditional Investor Concerns

Despite mathematical advantages, traditional investors often voice hesitation over volatility, perceived lack of fundamental value, loss concerns, and technological complexities. Yet, many of these risks are mitigated by systematic index construction and responsible allocation:

The Tax Consideration

Traditional portfolios retain an edge with favorable tax treatment through dividends, long-term capital gains status, and integration within retirement vehicles. Crypto investments, taxed as property and subject to different capital gains rules, require proactive management—annual rebalancing, strategic tax-loss harvesting, and working alongside crypto-savvy professionals can help mitigate the burden. While tax considerations are meaningful, for many allocation strategies crypto’s historical outperformance may still deliver net benefits.

The 2025 Reality: Both, Not Either/Or

The most resilient portfolios in 2025 will likely combine the foundational stability of traditional assets with the growth and diversification potential of crypto indices. Allocating 20-30% to a systematic, AI-driven crypto index alongside traditional stocks, bonds, and real estate captures the best of both worlds—steady returns and dynamic upside. Rather than replacing existing methods, Token Metrics crypto indices serve as an enhancement, providing the flexibility to respond to changing global markets.

Your Action Plan

Achieving an optimized portfolio involves a structured process:

The bottom line is clear: portfolios that blend both sectors are positioned to harness the unique strengths of each, achieving superior results for the next era of investing.

Discover Crypto Gems with Token Metrics AI

Token Metrics uses AI-powered analysis to help you uncover profitable opportunities in the crypto market. Get Started For Free

FAQ: Crypto Indices & Traditional Portfolios

What is a crypto index and how does it differ from a traditional index?

A crypto index is a diversified digital asset portfolio, algorithmically constructed to track the broader crypto market or targeted sectors. Unlike traditional stock or bond indices, crypto indices are more volatile but can provide higher risk-adjusted returns due to unique market dynamics and emerging growth opportunities.

How much of my portfolio should be allocated to crypto indices?

Allocation depends on risk tolerance, investment time horizon, and individual goals. Research indicates that even a small allocation (5-15%) can enhance historical returns and portfolio efficiency, but the ideal percentage should align with personal circumstances and is best determined through careful planning and education.

Are Token Metrics crypto indices actively managed?

Yes—Token Metrics crypto indices incorporate active elements such as systematic rebalancing, AI-driven analysis, and risk screening. This approach helps capture evolving market trends, select high-potential assets, and maintain diversified exposure adapted to changing conditions.

Do crypto indices offer real diversification for traditional portfolios?

Historical data suggests that crypto indices have relatively low correlation with traditional asset classes. Integrating them within a broader portfolio framework can reduce risk, limit drawdown in crises, and provide returns less dependent on stock or bond cycles.

What are the key risks when adding crypto indices to a portfolio?

Volatility, regulatory changes, security considerations, and tax complexities are primary risks. Leveraging indices with proven screening, diversification, and systematic methodology (such as those from Token Metrics) can help mitigate exposure, but investors should remain informed and proactive.

Disclaimer

This blog is for educational and informational purposes only. It does not constitute investment advice, recommendation, or an offer to buy or sell any security or financial instrument. Past performance is not indicative of future results. Always conduct your own research and consult a qualified financial professional before making investment decisions.

Research

How to Choose the Right Token Metrics Index: A Complete Decision Guide for 2025

Token Metrics Team
9

The Paradox of Choice

You've decided to invest in crypto through Token Metrics indices—a decision that puts an array of research-backed strategies at your fingertips. But with over 14 unique indices available, the next step can feel daunting: Which index aligns best with your profile and investment objectives?

Choosing without a framework can result in missed opportunities or unintentional risk. Choosing carefully ensures your portfolio is tailored to your goals, risk appetite, and available time.

This guide brings clarity to the selection process. By its end, you'll recognize which Token Metrics index (or blend of indices) most closely fits your circumstances—and appreciate the rationale behind each option.

Understanding the Token Metrics Index Universe

Before choosing, it’s essential to understand what the Token Metrics index platform provides. The suite spans three main categories, each designed for distinct investing approaches:

The Three Primary Index Categories

Available Token Metrics Indices

These indices are designed with different objectives. The key to successful index selection is matching to your unique profile.

The Five-Factor Decision Framework

Applying a structured framework to your decision can eliminate uncertainty and make index selection evidence-based. Consider the following factors:

Factor #1: Your Investment Time Horizon

How long do you intend to hold your investments?

Example: Sarah, age 32, planning to purchase a home in 3 years, uses the Balanced Investor Index for growth with measured risk—helping keep her financial goals on track.

Factor #2: Your Risk Tolerance

How would you react to a 40% portfolio decline?

Example: Mike, 28, high income and an aggressive trading style, allocates heavily to momentum and sector indices, aligning risk with his financial situation.

Factor #3: Your Available Time

How much time each week or month can you realistically dedicate?

Example: Jennifer, a full-time lawyer and parent, uses the Value Investor Index with annual rebalancing—spending only 30 minutes quarterly monitoring but making changes just once a year.

Factor #4: Your Investment Knowledge Level

What’s your current crypto expertise?

Example: David, new to crypto but with a finance background, starts with the Balanced Investor Index to learn market-specific nuances before layering in sector exposure.

Factor #5: Your Investment Goals

What is your primary investment objective?

Example: Robert, 55, aiming for retirement in five years, focuses on the Value Investor Index for stability with a modest allocation to the DeFi Index for passive yield.

The Decision Matrix: Finding Your Match

The framework above can be applied using this practical matrix:

Common Index Combinations That Work

Making Your Final Decision

Follow this three-step process to finalize your index strategy:

What If You Choose Wrong?

The flexibility of Token Metrics indices means initial choices are not irreversible. Review your selections quarterly and pivot as your goals or circumstances change. Consider reducing or increasing complexity as needed based on your lifestyle and comfort with volatility.

Taking Action Today

With this framework, you are ready to decide. Here is a practical action sequence:

The ideal index for your needs is available—begin with your best match, iterate as you learn, and refine your allocation as your investment journey evolves.

Your crypto journey starts here.

Discover Crypto Gems with Token Metrics AI

Token Metrics uses AI-powered analysis to help you uncover profitable opportunities in the crypto market. Get Started For Free

FAQ: Choosing the Right Token Metrics Index

How many Token Metrics indices can I invest in at once?

There is no hard limit on the number of indices you can follow simultaneously. Many investors start with a single index for simplicity, then diversify by layering additional indices as familiarity and confidence grow.

What is the difference between an investor index and a trader index?

Investor indices prioritize long-term growth, utilize infrequent rebalancing, and lower volatility. Trader indices aim for active returns through frequent asset rotation, accepting higher volatility and requiring more hands-on management.

Who should consider sector-specific indices?

Sector-specific indices are suitable for those looking to capitalize on emerging trends and willing to accept higher variance. They are ideal as a tactical addition for investors who already have a stable portfolio base.

Can I change my Token Metrics index selection if my goals or risk tolerance shift?

Yes, you can modify your chosen indices at any time. Tailoring your strategy as your circumstances or market outlook evolve is both possible and encouraged for ongoing alignment with your objectives.

Is it easy to monitor and rebalance Token Metrics indices?

Monitoring and rebalancing is straightforward, with clear instructions provided. Frequency and complexity depend on the indices you select and your availability, making the process adaptable to many investor profiles.

How does Token Metrics support index selection and monitoring?

Token Metrics offers data-driven insights, rankings, and AI-powered analysis to streamline index selection and track performance—empowering investors to make informed, evidence-based decisions.

What if my chosen index performs differently than expected?

All investments carry risk, and index performance can vary year to year. Regularly reviewing your portfolio and adjusting allocations as your experience grows is key to ongoing risk management.

Disclaimer

This guide is for informational and educational purposes only and should not be interpreted as investment, financial, or other advice. All investments, including crypto indices, involve risk. Past performance does not guarantee future results. Please do your own research and consult a qualified advisor before making investment decisions.

Choose from Platinum, Gold, and Silver packages
Reach with 25–30% open rates and 0.5–1% CTR
Craft your own custom ad—from banners to tailored copy
Perfect for Crypto Exchanges, SaaS Tools, DeFi, and AI Products