Back to blog
Crypto Basics

Uniswap Price Prediction - Investment Insights and Analysis

Gain valuable investment insights with our Uniswap price prediction analysis. Also, check crypto industry expert forecasts to make informed decisions.
S. Vishwa
6 Minutes
Want Smarter Crypto Picks—Free?
See unbiased Token Metrics Ratings for BTC, ETH, and top alts.
Thank you! Your submission has been received!
Oops! Something went wrong while submitting the form.
 No credit card | 1-click unsubscribe

Uniswap has carved a niche for itself in the decentralized finance (DeFi) ecosystem. As one of the pioneering platforms introducing an automated market maker (AMM) system, it has significantly impacted how trading is conducted on decentralized exchanges. 

With the cryptocurrency market being notably volatile, potential investors and crypto enthusiasts are constantly on the lookout for opportunities. 

This brings us to the pertinent question, is investing in Uniswap a wise decision or is it better to steer clear? This post delves into a thorough analysis aiming to provide a well-informed answer to this query.

Uniswap Overview

Before diving into predictions, let's understand what Uniswap is. Uniswap is a decentralized exchange protocol built on Ethereum. 

Unlike traditional exchanges, where you trade with an order book, Uniswap uses liquidity pools where users can trade directly from a shared fund, earning providers a fraction of the transaction fees in return.

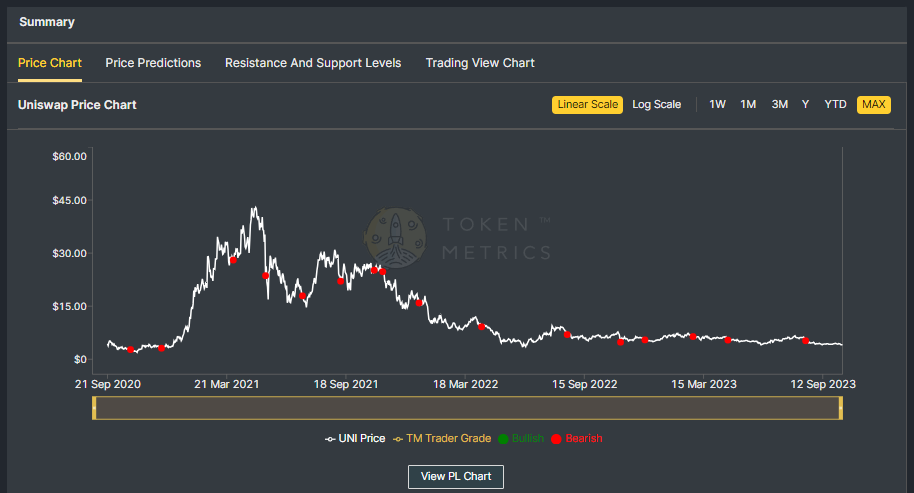
Historical Data of Uniswap

To predict the future, we need to look at the past. Uniswap's native token, UNI, launched in September 2020, has witnessed significant volatility, much like the broader crypto market.

Despite several ups and downs, Uniswap maintained its position among the top DeFi platforms in terms of total value locked, showcasing its resilience and user trust.

Uniswap Price Chart
Get a free trial today and discover your token's predicted performance on Token Metrics

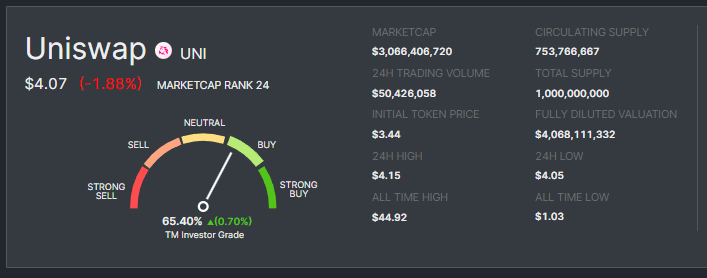
Uniswap Current Fundamentals

Analyzing the current fundamentals and tokenomics of Uniswap can provide insight into its price direction. 

Recent price data shows that Uniswap (UNI) is trading at $4.07 with a 24-hour trading volume of approximately $50 million. 

Uniswap’s fundamentals remain strong with its innovative automated market maker (AMM) protocol. 

Uniswap Tokenomics

Uniswap Price Prediction for Longterm - Industry Expert Opinion

Changelly, a prominent crypto platform predicted that by the end of 2030, Uniswap price can reach around $104 to $124.

Coincodex predicts a decline in Uniswap's price by -7.28% in 2023, with current sentiment leaning bearish. Their projections also suggest a possible range of $3.60 to $9.52 for Uniswap in 2024-2025. 

On the other hand, DigitalCoinPrice has a bullish stance, forecasting that UNI might surpass $9.94 in 2024, potentially peaking at $78.53 by 2032. 

Meanwhile, CryptoPredictions.com anticipates Uniswap to start November 2023 at $3.359, peaking at $4.939 and settling at $3.383 by month's end.

Is Uniswap Good to Invest?

Uniswap, as one of the pioneering decentralized exchanges in the DeFi sector, has demonstrated consistent growth and innovation, particularly with the introduction of its V3 protocol. Its native token, UNI, reflects the platform's vision and the overall sentiment towards decentralized finance. 

The platform's consistent user adoption, resilience to market fluctuations, and increasing total value locked (TVL) signify a positive trajectory. However, like any investment, it carries inherent risks. Regulatory changes, market volatility, and growing competition from other DEXs can impact its value. 

Thus, while Uniswap presents promising potential, investors need to conduct thorough research and consider their risk tolerance before committing funds.

Risks and Challenges

Uniswap, despite its revolutionary stance in decentralized finance, is not without its challenges. One prominent concern is impermanent loss, a scenario where liquidity providers can potentially face losses when the price of tokens within the pool diverges significantly. 

Additionally, smart contract vulnerabilities, although rare, can be exploited, leading to significant financial setbacks for users. Regulatory uncertainties also loom large, as global authorities grapple with defining and regulating DeFi platforms. 

Finally, with the rapid evolution of the crypto landscape, Uniswap faces stiff competition from newer DEX platforms, which continually push the boundaries of innovation and user offerings.

Future Potential of Uniswap

Uniswap's future is brimming with possibilities, rooted in its commitment to enhancing decentralized trading. The recent introduction of Uniswap V3, with features like concentrated liquidity and multiple fee tiers, showcases its drive for innovation. 

As the broader DeFi sector witnesses exponential growth, Uniswap is well-positioned to capitalize on this trend, given its solid reputation and vast user base. Furthermore, the increasing interest of institutional investors in DeFi signals a wider acceptance and potential capital inflow. 

However, while Uniswap's trajectory appears promising, its continued growth hinges on its adaptability, user-centric innovations, and the evolving regulatory landscape of the crypto space.

Frequently Asked Questions

Q1. What differentiates Uniswap from other decentralized exchanges?

Uniswap employs an automated market maker (AMM) model, which means it uses liquidity pools rather than traditional order books. This allows for instant trades, irrespective of the order size or existing trade volume.

Q2. How does Uniswap's liquidity pool work?

Liquidity providers deposit an equal value of two tokens in a pool to form a market. In return, they get liquidity tokens representing their share and earn a portion of the trading fees.

Q3. What are the fees associated with trading on Uniswap?

As of the last update, Uniswap has introduced a 0.15% fee on its most popular trading pairs for the very first time.

Q4. How secure is Uniswap?

While Uniswap employs rigorous security protocols, like any platform, it's not immune to risks. Past incidents, mainly due to smart contract vulnerabilities, have occurred, but Uniswap continually works to improve its security.

Q5. Can I list my token on Uniswap?

Yes, one of Uniswap's features is its permissionless nature. Anyone can list their token without a centralized approval process. However, due diligence is advised for traders, as this also means potentially risky or scam tokens can be listed.

Q6. What is the role of the UNI token in the Uniswap ecosystem?

UNI is Uniswap's governance token. Holders can vote on proposals or even submit their proposals regarding protocol upgrades, fee structures, and other platform-related decisions.

Q7. Are there any alternatives to Uniswap?

Several other DEX platforms exist, such as Sushiswap, Balancer, and Curve, each with its unique features. It's recommended to research and compare based on fees, supported tokens, and user experience before choosing a platform.

Q8. How does Uniswap handle failed transactions?

Failed transactions on Uniswap usually return the gas fees to the user. However, it's crucial to ensure you're using an adequate gas price and gas limit to prevent transaction failures.

Conclusion

Uniswap, with its innovative approach to decentralized exchange, certainly holds promise. While the potential for returns exists, it's essential to approach it with knowledge and caution. Whether you decide to invest or avoid, always make informed decisions based on comprehensive research.

Note: Always consult with financial advisors before making investment decisions. The information provided here is for educational purposes and should not be considered financial advice.

Disclaimer

The information provided on this website does not constitute investment advice, financial advice, trading advice, or any other sort of advice and you should not treat any of the website's content as such.

Token Metrics does not recommend that any cryptocurrency should be bought, sold, or held by you. Do conduct your due diligence and consult your financial advisor before making any investment decisions.

Build Smarter Crypto Apps &
AI Agents in Minutes, Not Months
Real-time prices, trading signals, and on-chain insights all from one powerful API.
Grab a Free API Key
About Token Metrics
Token Metrics: AI-powered crypto research and ratings platform. We help investors make smarter decisions with unbiased Token Metrics Ratings, on-chain analytics, and editor-curated “Top 10” guides. Our platform distills thousands of data points into clear scores, trends, and alerts you can act on.
30 Employees
analysts, data scientists, and crypto engineers
Daily Briefings
concise market insights and “Top Picks”
Transparent & Compliant
Sponsored ≠ Ratings; research remains independent
Want Smarter Crypto Picks—Free?
See unbiased Token Metrics Ratings for BTC, ETH, and top alts.
Thank you! Your submission has been received!
Oops! Something went wrong while submitting the form.
 No credit card | 1-click unsubscribe
Token Metrics Team
Token Metrics Team

Recent Posts

Research

Hedera (HBAR) 2027 Price Targets: Token Metrics Scenarios

Token Metrics Team
8 min read

Portfolio Context for Hedera: Diversification in the 2027 Landscape

Layer 1 tokens like Hedera represent bets on specific blockchain architectures winning developer and user mindshare. HBAR carries both systematic crypto risk and unsystematic risk from Hedera's technical roadmap execution and ecosystem growth. Multi-chain thesis suggests diversifying across several L1s rather than concentrating in one, since predicting which chains will dominate remains difficult.

The projections below show how HBAR might perform under different market cap scenarios. While Hedera may have strong fundamentals, prudent portfolio construction balances L1 exposure across Ethereum, competing smart contract platforms, and Bitcoin to capture the sector without overexposure to any single chain's fate.


Disclosure

Educational purposes only, not financial advice. Crypto is volatile, do your own research and manage risk.

How to read it: Each band blends cycle analogues and market-cap share math with TA guardrails. Base assumes steady adoption and neutral or positive macro. Moon layers in a liquidity boom. Bear assumes muted flows and tighter liquidity.

TM Agent baseline:

Token Metrics lead metric for Hedera, cashtag $HBAR, is a TM Grade of 61.8%, which maps to Hold, and the trading signal is bearish, indicating short-term downward momentum. This means Token Metrics views $HBAR as having reasonably solid fundamentals but limited conviction for strong outperformance in the near term.

A concise long-term numeric view for a 12-month horizon: Token Metrics scenarios center around a range of about $0.06 to $0.18, with a base case near $0.10, reflecting steady ecosystem growth, moderate adoption of Hedera services, and continued enterprise partnerships. Implication: if Bitcoin and broader crypto risk appetite improve, $HBAR could revisit the higher end, while a risk-off market or slower-than-expected developer traction would keep it toward the lower bound.

Live details: Token Details

Key Takeaways

  • Scenario driven, outcomes hinge on total crypto market cap, higher liquidity and adoption lift the bands.
  • Single-asset concentration amplifies both upside and downside versus diversified approaches.
  • Fundamentals: Fundamental Grade 81.08% (Community 74%, Tokenomics 100%, Exchange 100%, VC 59%, DeFi Scanner 85%).
  • Technology: Technology Grade 62.39% (Activity 58%, Repository 68%, Collaboration 74%, Security 56%, DeFi Scanner 85%).
  • TM Agent gist: bearish short term, range view with upside if crypto risk appetite improves.
  • Education only, not financial advice.

Scenario Analysis

Token Metrics scenarios span four market cap tiers, each representing different levels of crypto market maturity and liquidity:

  • 8T: At an 8 trillion dollar total crypto market cap, HBAR projects to $0.27 in bear conditions, $0.32 in the base case, and $0.37 in bullish scenarios.  
  • 16T: Doubling the market to 16 trillion expands the range to $0.42 (bear), $0.57 (base), and $0.72 (moon).  
  • 23T: At 23 trillion, the scenarios show $0.56, $0.82, and $1.07 respectively.  
  • 31T: In the maximum liquidity scenario of 31 trillion, HBAR could reach $0.71 (bear), $1.07 (base), or $1.42 (moon).  

These ranges illustrate potential outcomes for concentrated HBAR positions, but investors should weigh whether single-asset exposure matches their risk tolerance or whether diversified strategies better suit their objectives.

The Case for Diversified Index Exposure

Professional investors across asset classes prefer diversified exposure over concentrated bets for good reason. Hedera faces numerous risks - technical vulnerabilities, competitive pressure, regulatory targeting, team execution failure - any of which could derail HBAR performance independent of broader market conditions. Token Metrics Indices spread this risk across one hundred tokens, ensuring no single failure destroys your crypto portfolio.

Diversification becomes especially critical in crypto given the sector's nascency and rapid evolution. Technologies and narratives that dominate today may be obsolete within years as the space matures. By holding HBAR exclusively, you're betting not only on crypto succeeding but on Hedera specifically remaining relevant. Index approaches hedge against picking the wrong horse while maintaining full crypto exposure.

Tax efficiency and rebalancing challenges also favor indices over managing concentrated positions. Token Metrics Indices handle portfolio construction, rebalancing, and position sizing systematically, eliminating the emotional and logistical burden of doing this manually with multiple tokens.

Early access to Token Metrics Indices 

What Is Hedera?

Hedera is a high-performance public ledger that emphasizes speed, low fees, and energy efficiency, positioning itself for enterprise and decentralized applications. It uses a unique Hashgraph consensus that enables fast finality and high throughput, paired with a council-governed model that targets real-world use cases like payments, tokenization, and decentralized identity.

HBAR is the native token used for fees, staking, and network security, and it supports smart contracts and decentralized file storage. Adoption draws from partnerships and integrations, though decentralization levels and reliance on institutional demand are often discussed in the community.

Token Metrics AI Analysis

Token Metrics AI provides comprehensive context on Hedera's positioning and challenges.

  • Vision: Hedera's vision is to provide a secure, fair, and scalable distributed ledger technology platform that supports decentralized applications and enterprise use cases globally. It emphasizes governed decentralization, aiming to combine the benefits of distributed systems with responsible oversight through its council-based governance model.
  • Problem: Many blockchain networks face trade-offs between scalability, security, and decentralization, often resulting in high transaction fees, slow processing times, or environmental concerns. Hedera aims to address these limitations by offering a system that supports high throughput and fast finality without sacrificing security or incurring significant energy costs, making it suitable for both enterprise and decentralized applications.
  • Solution: Hedera uses the Hashgraph consensus algorithm, a directed acyclic graph (DAG)-based approach that achieves asynchronous Byzantine fault tolerance, enabling fast, secure, and fair transaction processing. The network supports smart contracts, tokenization, and decentralized file storage, with HBAR serving as the native token for fees, staking, and network security. Its council-governed model aims to ensure stability and trust, particularly for institutional and enterprise users.
  • Market Analysis: Hedera operates in the Layer 1 blockchain space, competing with high-throughput platforms like Solana, Avalanche, and Algorand, while differentiating through its Hashgraph consensus and governed governance model. It targets enterprise adoption, focusing on use cases in supply chain, payments, and asset tokenization, which sets it apart from more community-driven or DeFi-centric networks. Adoption is influenced by strategic partnerships, developer engagement, and real-world integrations rather than speculative activity. Key risks include competition from established and emerging blockchains, regulatory scrutiny around governance tokens, and challenges in achieving broad decentralization.

Fundamental and Technology Snapshot from Token Metrics

Fundamental Grade: 81.08% (Community 74%, Tokenomics 100%, Exchange 100%, VC 59%, DeFi Scanner 85%).  

Technology Grade: 62.39% (Activity 58%, Repository 68%, Collaboration 74%, Security 56%, DeFi Scanner 85%).  

Catalysts That Skew Bullish

  • Institutional and retail access expands with ETFs, listings, and integrations.
  • Macro tailwinds from lower real rates and improving liquidity.
  • Product or roadmap milestones such as upgrades, scaling, or partnerships.

Risks That Skew Bearish

  • Macro risk-off from tightening or liquidity shocks.
  • Regulatory actions or infrastructure outages.
  • Concentration or validator economics and competitive displacement.
  • Protocol-specific execution risk and competitive pressure from alternatives.

FAQs

Can HBAR reach $1.00?

Yes. Based on the scenarios, HBAR could reach $1.00 or above in the higher tiers. The 23T tier projects $1.07 in the moon case and the 31T tier projects $1.42 in the moon case. Achieving this requires broad market cap expansion and Hedera maintaining competitive position. Not financial advice.

What price could HBAR reach in the moon case?

Moon case projections range from $0.37 at 8T to $1.42 at 31T. These scenarios assume maximum liquidity expansion and strong Hedera adoption. Diversified strategies aim to capture upside across multiple tokens rather than betting exclusively on any single moon scenario. Not financial advice.

What's the risk/reward profile for HBAR?

Risk and reward span from $0.27 in the lowest bear case to $1.42 in the highest moon case. Downside risks include regulatory or infrastructure setbacks and competitive pressure, while upside drivers include improved liquidity and enterprise adoption. Concentrated positions amplify both tails, while diversified strategies smooth outcomes.  

Next Steps

Disclosure

Educational purposes only, not financial advice. Crypto is volatile, concentration amplifies risk, and diversification is a fundamental principle of prudent portfolio construction. Do your own research and manage risk appropriately.

Research

Predicting LEO Token Price in 2027: Scenario Analysis & On-Chain Scores

Token Metrics Team
5 min read

LEO Token Valuation Framework: Market Cap Scenarios

Exchange tokens desrive value from trading volume and platform revenue, creating linkage between crypto market activity and LEO price action. LEO Token delivers utility through reduced trading fees and enhanced platform services on Bitfinex and iFinex across Ethereum and EOS. Token Metrics scenarios below model LEO outcomes across different total crypto market cap environments.


Disclosure

Educational purposes only, not financial advice. Crypto is volatile, do your own research and manage risk.

How to read it: Each band blends cycle analogues and market-cap share math with TA guardrails. Base assumes steady adoption and neutral or positive macro. Moon layers in a liquidity boom. Bear assumes muted flows and tighter liquidity.

TM Agent baseline: Token Metrics probabilities favor a modest range between about $5 and $15, with a base case around current levels near $9, conditional on exchange token utility remaining steady, and downside risk if centralized exchange macro pressure increases.

Live details: Token Details 

Key Takeaways

  • Scenario driven, outcomes hinge on total crypto market cap, higher liquidity and adoption lift the bands.
  • TM Agent gist: 12-month horizon favors $5 to $15 range with base case near $9, contingent on stable exchange utility.
  • Education only, not financial advice.

Scenario Analysis

Token Metrics scenarios span four market cap tiers reflecting different crypto market maturity levels:

  • 8T: At 8 trillion total crypto market cap, LEO projects to $11.35 in bear conditions, $12.92 in the base case, and $14.48 in bullish scenarios.  
  • 16T: At 16 trillion total crypto market cap, LEO projects to $14.82 in bear conditions, $19.51 in the base case, and $24.20 in bullish scenarios.  
  • 23T: At 23 trillion total crypto market cap, LEO projects to $18.28 in bear conditions, $26.10 in the base case, and $33.92 in bullish scenarios.  
  • 31T: At 31 trillion total crypto market cap, LEO projects to $21.74 in bear conditions, $32.69 in the base case, and $43.63 in bullish scenarios.  

What Is LEO Token?

LEO Token is the native utility token of the Bitfinex and iFinex ecosystem, designed to provide benefits like reduced trading fees, enhanced lending and borrowing terms, and access to exclusive features on the platform. It operates on both Ethereum (ERC-20) and EOS blockchains, offering flexibility for users.

The primary role of LEO is to serve as a utility token within the exchange ecosystem, enabling fee discounts, participation in token sales, and other platform-specific advantages. Common usage patterns include holding LEO to reduce trading costs and utilizing it for enhanced platform services, positioning it primarily within the exchange token sector.

Catalysts That Skew Bullish

  • Institutional and retail access expands with ETFs, listings, and integrations.
  • Macro tailwinds from lower real rates and improving liquidity.
  • Product or roadmap milestones such as upgrades, scaling, or partnerships.

Risks That Skew Bearish

  • Macro risk-off from tightening or liquidity shocks.
  • Regulatory actions or infrastructure outages.
  • Concentration or validator economics and competitive displacement.

FAQs

What gives LEO value?

LEO accrues value through reduced trading fees and enhanced platform services within the Bitfinex and iFinex ecosystem. Demand drivers include exchange usage and access to platform features, while supply dynamics follow the token’s exchange utility design. Value realization depends on platform activity and user adoption.

What price could LEO reach in the moon case?

Moon case projections range from $14.48 at 8T to $43.63 at 31T. These scenarios require maximum market cap expansion and strong exchange activity. Not financial advice.  

Next Steps

Curious how these forecasts are made? Token Metrics delivers LEO on-chain grades, forecasts, and deep research on 6,000+ tokens. Instantly compare fundamentals, on-chain scores, and AI-powered predictions.

Disclosure

Educational purposes only, not financial advice. Crypto is volatile, do your own research and manage risk.

Research

Sui (SUI) 2027 Price Targets: Token Metrics Scenarios

Token Metrics Team
8 min read

Portfolio Context for Sui: Diversification in the 2027 Landscape

Layer 1 tokens like Sui represent bets on specific blockchain architectures winning developer and user mindshare. SUI carries both systematic crypto risk and unsystematic risk from Sui's technical roadmap execution and ecosystem growth. Multi-chain thesis suggests diversifying across several L1s rather than concentrating in one, since predicting which chains will dominate remains difficult.

The projections below show how SUI might perform under different market cap scenarios. While Sui may have strong fundamentals, prudent portfolio construction balances L1 exposure across Ethereum, competing smart contract platforms, and Bitcoin to capture the sector without overexposure to any single chain's fate.


Disclosure

Educational purposes only, not financial advice. Crypto is volatile, do your own research and manage risk.

Each band blends cycle analogues and market-cap share math with TA guardrails. Base assumes steady adoption and neutral or positive macro. Moon layers in a liquidity boom. Bear assumes muted flows and tighter liquidity.

TM Agent baseline: Token Metrics lead metric for Sui, cashtag $SUI, is a TM Grade of 67.4%, which maps to a Hold, and the trading signal is bearish, indicating short-term downward momentum. This suggests Token Metrics sees $SUI as having reasonable fundamentals but not yet strong conviction for substantial outperformance, while near-term momentum is negative and could limit rallies. Market context, brief: Bitcoin’s price direction is currently the primary market driver, and a risk-off Bitcoin environment increases downside pressure on layer-1 tokens like $SUI.

Live details: Token Details 

The Case for Diversified Index Exposure

Professional investors across asset classes prefer diversified exposure over concentrated bets for good reason. Sui faces numerous risks - technical vulnerabilities, competitive pressure, regulatory targeting, team execution failure - any of which could derail SUI performance independent of broader market conditions. Token Metrics Indices spread this risk across one hundred tokens, ensuring no single failure destroys your crypto portfolio.

Diversification becomes especially critical in crypto given the sector's nascency and rapid evolution. Technologies and narratives that dominate today may be obsolete within years as the space matures. By holding SUI exclusively, you're betting not only on crypto succeeding but on Sui specifically remaining relevant. Index approaches hedge against picking the wrong horse while maintaining full crypto exposure.

Early access to Token Metrics Indices

Key Takeaways

  • Scenario driven, outcomes hinge on total crypto market cap, higher liquidity and adoption lift the bands.
  • Single-asset concentration amplifies both upside and downside versus diversified approaches.
  • Fundamentals: Fundamental Grade 77.60% (Community 80%, Tokenomics 60%, Exchange 100%, VC 76%, DeFi Scanner 75%).
  • Technology: Technology Grade 79.06% (Activity 77%, Repository 72%, Collaboration 89%, Security N/A, DeFi Scanner 75%).
  • TM Agent gist: Hold grade, bearish trading signal, near-term negative momentum.
  • Education only, not financial advice.

Scenario Analysis

Token Metrics scenarios span four market cap tiers, each representing different levels of crypto market maturity and liquidity:

  • 8T: At a 8 trillion total crypto market cap, SUI projects to $4.64 in bear conditions, $6.29 in the base case, and $7.94 in bullish scenarios.  
  • 16T: At a 16 trillion total crypto market cap, SUI projects to $8.93 in bear conditions, $13.88 in the base case, and $18.83 in bullish scenarios.  
  • 23T: At a 23 trillion total crypto market cap, SUI projects to $13.22 in bear conditions, $21.47 in the base case, and $29.72 in bullish scenarios.  
  • 31T: At a 31 trillion total crypto market cap, SUI projects to $17.50 in bear conditions, $29.05 in the base case, and $40.61 in bullish scenarios.  

These ranges illustrate potential outcomes for concentrated SUI positions, but investors should weigh whether single-asset exposure matches their risk tolerance or whether diversified strategies better suit their objectives.

What Is Sui?

Sui is a layer-1 blockchain network designed for general-purpose smart contracts and scalable user experiences. It targets high throughput and fast settlement, aiming to support applications that need low-latency interactions and horizontal scaling.

SUI is the native token used for transaction fees and staking, aligning validator incentives and securing the network. It underpins activity across common crypto sectors such as NFTs and DeFi while the ecosystem builds developer tooling and integrations.

Token Metrics AI Analysis

Vision: Sui aims to create a highly scalable and low-latency blockchain platform that enables seamless user experiences for decentralized applications. Its vision centers on making blockchain technology accessible and efficient for mainstream applications by removing traditional bottlenecks in transaction speed and cost.

Problem: Many existing blockchains face trade-offs between scalability, security, and decentralization, often resulting in high fees and slow transaction finality during peak usage. This limits their effectiveness for applications requiring instant settlement, frequent interactions, or large user bases, such as games or social platforms. Sui addresses the need for a network that can scale horizontally without sacrificing speed or cost-efficiency.

Solution: Sui uses a unique object-centric blockchain model and the Move programming language to enable parallel transaction processing, allowing high throughput and instant finality for many operations. Its consensus mechanism, Narwhal and Tusk, is optimized for speed and scalability by decoupling transaction dissemination from ordering. The network supports smart contracts, NFTs, and decentralized applications, with an emphasis on developer ease and user experience. Staking is available for network security, aligning with common proof-of-stake utility patterns.

Market Analysis: Sui competes in the layer-1 blockchain space with platforms like Solana, Avalanche, and Aptos, all targeting high-performance decentralized applications. It differentiates itself through its object-based data model and parallel execution, aiming for superior scalability in specific workloads. Adoption drivers include developer tooling, ecosystem incentives, and integration with wallets and decentralized exchanges. The broader market for high-throughput blockchains is driven by demand for scalable Web3 applications, though it faces risks from technical complexity, regulatory uncertainty, and intense competition.

Fundamental and Technology Snapshot from Token Metrics

Fundamental Grade: 77.60% (Community 80%, Tokenomics 60%, Exchange 100%, VC 76%, DeFi Scanner 75%).  

Technology Grade: 79.06% (Activity 77%, Repository 72%, Collaboration 89%, Security N/A, DeFi Scanner 75%).  

Catalysts That Skew Bullish

  • Institutional and retail access expands with ETFs, listings, and integrations.
  • Macro tailwinds from lower real rates and improving liquidity.
  • Product or roadmap milestones such as upgrades, scaling, or partnerships.

Risks That Skew Bearish

  • Macro risk-off from tightening or liquidity shocks.
  • Regulatory actions or infrastructure outages.
  • Concentration or validator economics and competitive displacement.
  • Protocol-specific execution risk and competitive pressure from alternatives.

How Token Metrics Can Help

Token Metrics empowers you to analyze Sui and hundreds of digital assets with AI-driven ratings, on-chain and fundamental data, and index solutions to manage portfolio risk smartly in a rapidly evolving crypto market.

FAQs

What price could SUI reach in the moon case?

Moon case projections range from $7.94 at 8T to $40.61 at 31T. These scenarios assume maximum liquidity expansion and strong Sui adoption. Diversified strategies aim to capture upside across multiple tokens rather than betting exclusively on any single moon scenario. Not financial advice.

What's the risk/reward profile for SUI?

Risk/reward spans from $4.64 to $40.61. Downside risks include regulatory pressure and competitive displacement, while upside drivers include ecosystem growth and favorable liquidity. Concentrated positions amplify both tails, while diversified strategies smooth outcomes.

What are the biggest risks to SUI?

Key risks include regulatory actions, technical issues, competitive pressure from other L1s, and adverse market liquidity. Concentrated SUI positions magnify exposure to these risks. Diversified strategies spread risk across tokens with different profiles, reducing portfolio vulnerability to any single failure point.  

Next Steps

Disclosure
Educational purposes only, not financial advice. Crypto is volatile, concentration amplifies risk, and diversification is a fundamental principle of prudent portfolio construction. Do your own research and manage risk appropriately.

Choose from Platinum, Gold, and Silver packages
Reach with 25–30% open rates and 0.5–1% CTR
Craft your own custom ad—from banners to tailored copy
Perfect for Crypto Exchanges, SaaS Tools, DeFi, and AI Products