Back to blog
Research

What Are Limit Orders vs. Market Orders?

Learn the difference between limit orders and market orders, when to use each, and how Token Metrics’ AI tools help you trade smarter and reduce risk.
Token Metrics Team
8 min
Want Smarter Crypto Picks—Free?
See unbiased Token Metrics Ratings for BTC, ETH, and top alts.
Thank you! Your submission has been received!
Oops! Something went wrong while submitting the form.
 No credit card | 1-click unsubscribe

When you trade cryptocurrency, you’ll come across different types of orders—market orders and limit orders being the two most common. Understanding how they work is essential for controlling your entry and exit points, minimizing slippage, and making better trading decisions.

If you’ve ever wondered, “What’s the difference between limit orders and market orders?”, you’re in the right place. This guide will break it down in detail, explain when to use each, and show how Token Metrics helps you execute smarter trades with AI-powered insights.

What Is a Market Order?

A market order is the simplest type of trade. It tells an exchange:

“Buy or sell this cryptocurrency at the best available price right now.”

How It Works:

  • When you place a market order to buy, the system instantly matches you with sellers at the lowest available price.

  • When you place a market order to sell, it instantly matches you with buyers at the highest available price.

Advantages of Market Orders:

  1. Instant Execution: Your trade goes through immediately.

  2. Simplicity: Perfect for beginners who want fast transactions.

  3. Useful in High-Volatility Conditions: If you need to enter or exit a trade quickly, market orders are your best bet.

Disadvantages of Market Orders:

  1. Slippage: If liquidity is low or the market moves quickly, you might pay more (or receive less) than expected.

  2. No Price Control: You accept whatever price the market offers at that moment.

Example:
If Bitcoin is trading at $40,000 and you place a market order for 1 BTC, you may end up paying $40,050 if the price moves up in the milliseconds it takes to execute your trade.

What Is a Limit Order?

A limit order gives you more control. It tells an exchange:

“Buy or sell this cryptocurrency at this specific price (or better).”

How It Works:

  • When you place a buy limit order, you set the maximum price you’re willing to pay.

  • When you place a sell limit order, you set the minimum price you’re willing to accept.

  • The order stays open until the market reaches your price—or until you cancel it.

Advantages of Limit Orders:

  1. Price Control: You won’t pay more (or sell for less) than your chosen price.

  2. Better for Planning: Ideal for setting up trades without constantly watching the market.

  3. Lower Fees: Some exchanges offer lower “maker” fees for limit orders since they add liquidity.

Disadvantages of Limit Orders:

  1. No Guarantee of Execution: If the market doesn’t reach your price, your order won’t go through.

  2. Slower Execution: Not suitable for urgent trades in fast-moving markets.

Example:
If Bitcoin is trading at $40,000, you could set a buy limit order at $39,500. If the price dips to that level, your order fills. If it doesn’t, you won’t buy.

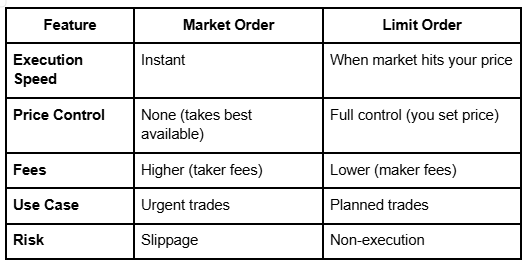
Limit Orders vs. Market Orders: Key Differences

When Should You Use Market Orders?

Market orders are best when:

  • You need speed: Entering or exiting a trade quickly.

  • The market is highly liquid: For large-cap coins like Bitcoin and Ethereum, slippage is minimal.

  • News-based trading: When reacting to breaking news or sudden price surges.

When Should You Use Limit Orders?

Limit orders are best when:

  • You want price control: Setting entries at discount levels or selling at specific profit targets.

  • You’re trading low-liquidity coins: Prevents overpaying due to slippage.

  • You’re building a strategy: Setting multiple entries and exits without active monitoring.

How Token Metrics Helps You Use Market & Limit Orders Effectively

Placing orders is one thing—placing them at the right time is what makes you profitable. That’s where Token Metrics helps.

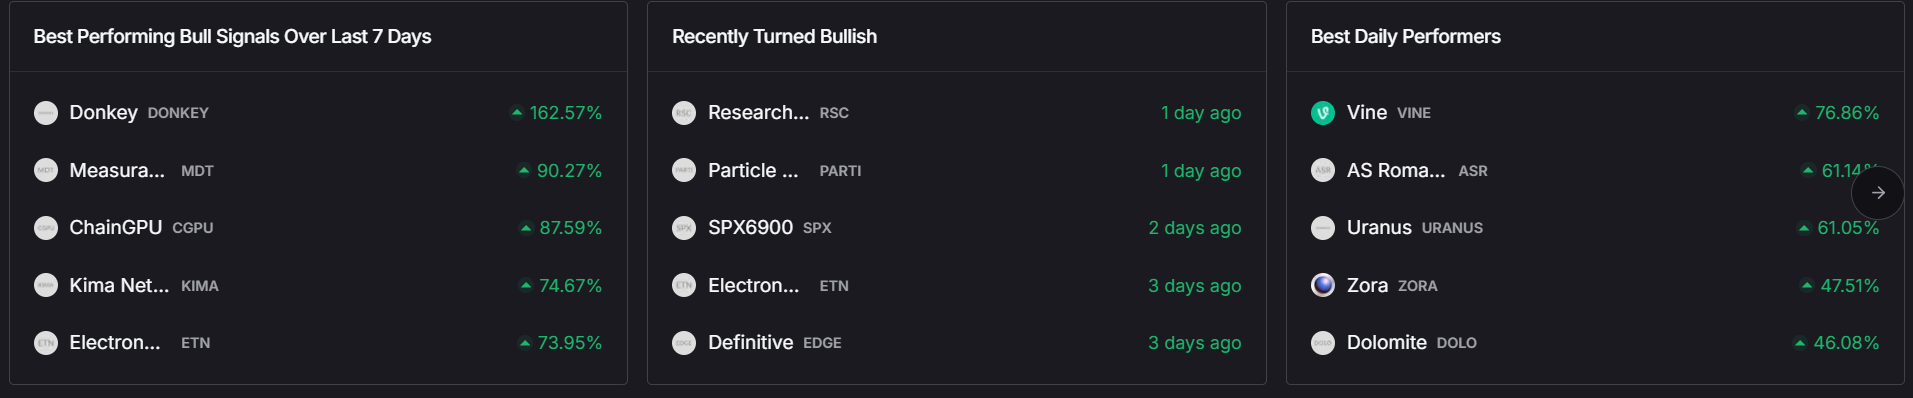
1. AI-Powered Trading Signals

Get real-time bullish and bearish alerts based on 80+ technical indicators, helping you know when to execute market or limit orders for maximum efficiency.

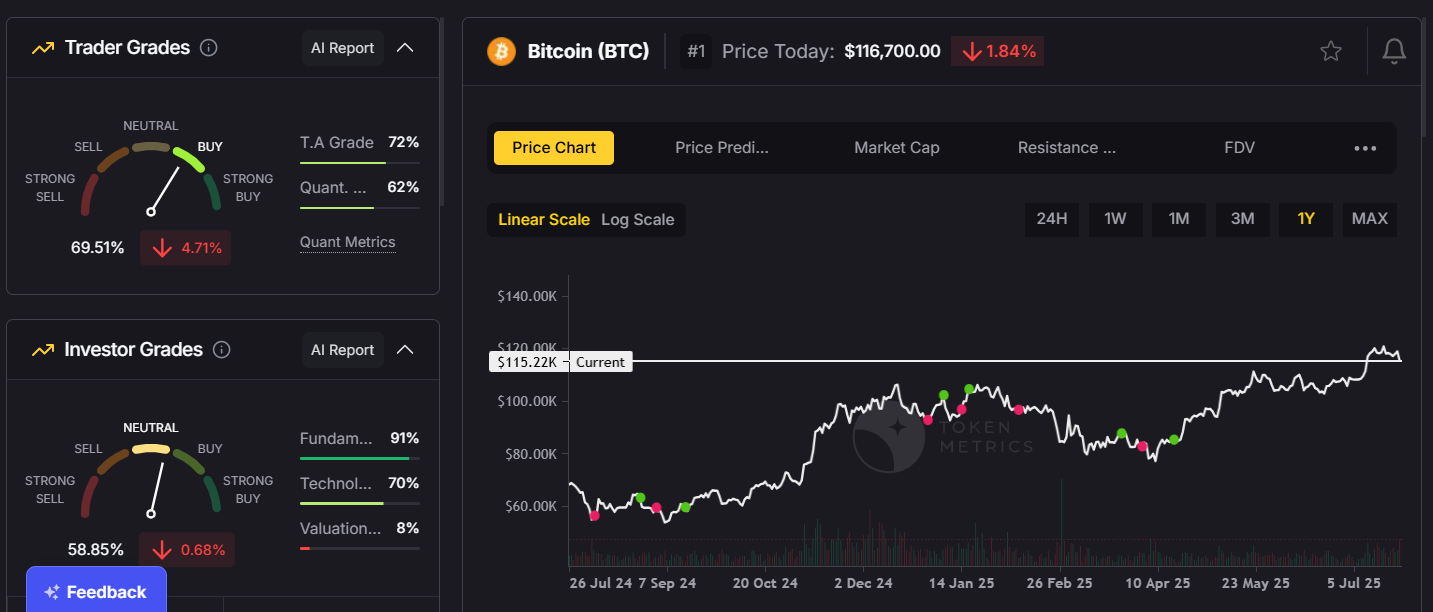
2. Trader & Investor Grades

Use Trader Grades for short-term trading opportunities (perfect for market orders) and Investor Grades for long-term accumulation (ideal for limit orders).

3. Narrative Tracking

Our AI identifies emerging narratives—like AI tokens or DeFi plays—so you can strategically place limit orders before trends take off.

4. AI-Managed Indices

Don’t want to place manual orders? Token Metrics’ AI-managed portfolios automatically rebalance based on market conditions, helping you avoid constant order management.

Practical Example: Combining Both Orders

Imagine you’re trading Ethereum (ETH):

  • Step 1: Token Metrics issues a bullish signal at $2,400, projecting a potential breakout.

  • Step 2: You place a market order to enter quickly at $2,400 to catch the momentum.

  • Step 3: You set a limit sell order at $2,700 to automatically secure profits without monitoring the chart.

This combination allows you to enter fast and exit smart—with less emotional stress.

Advanced Tips for Using Limit & Market Orders

  1. Use Stop-Limit Orders: Combine stop-loss and limit functions to protect against big losses.

  2. Layer Your Limit Orders: Place multiple buy/sell limits at different price levels for better cost averaging.

  3. Avoid Market Orders on Illiquid Coins: Slippage can cost you significantly.

  4. Use AI for Timing: Token Metrics helps you time entries and exits—so you’re not just placing random orders.

Final Thoughts

So, what’s the difference between limit orders and market orders?

  • Market orders are for speed—you get the trade done instantly at the best available price.

  • Limit orders are for control—you set the exact price you want to buy or sell.

The key is knowing when to use each—and using data-driven insights to make those decisions.

That’s where Token Metrics gives you an edge. With AI-powered trading signals, narrative tracking, and automated portfolio tools, Token Metrics helps you decide when to use market vs. limit orders, so you can trade confidently and profitably.

In crypto trading, timing is everything—and Token Metrics makes timing smarter.

Build Smarter Crypto Apps &
AI Agents in Minutes, Not Months
Real-time prices, trading signals, and on-chain insights all from one powerful API.
Grab a Free API Key
About Token Metrics
Token Metrics: AI-powered crypto research and ratings platform. We help investors make smarter decisions with unbiased Token Metrics Ratings, on-chain analytics, and editor-curated “Top 10” guides. Our platform distills thousands of data points into clear scores, trends, and alerts you can act on.
30 Employees
analysts, data scientists, and crypto engineers
30 Employees
analysts, data scientists, and crypto engineers
30 Employees
analysts, data scientists, and crypto engineers
Want Smarter Crypto Picks—Free?
See unbiased Token Metrics Ratings for BTC, ETH, and top alts.
Thank you! Your submission has been received!
Oops! Something went wrong while submitting the form.
 No credit card | 1-click unsubscribe
Token Metrics Team
Token Metrics Team

Recent Posts

Research

Moonshots API: Discover Breakout Tokens Before the Crowd

Token Metrics Team
5

The biggest gains in crypto rarely come from the majors. They come from Moonshots—fast-moving tokens with breakout potential. The Moonshots API surfaces these candidates programmatically so you can rank, alert, and act inside your product. In this guide, you’ll call /v2/moonshots, display a high-signal list with TM Grade and Bullish tags, and wire it into bots, dashboards, or screeners in minutes. Start by grabbing your key at Get API Key, then Run Hello-TM and Clone a Template to ship fast.

What You’ll Build in 2 Minutes

Why This Matters

Discovery that converts. Users want more than price tickers, they want a curated, explainable list of high-potential tokens. The Moonshots API encapsulates multiple signals into a short list designed for exploration, alerts, and watchlists you can monetize.

Built for builders. The endpoint returns a consistent schema with grade, signal, and context so you can immediately sort, badge, and trigger workflows. With predictable latency and clear filters, you can scale to dashboards, mobile apps, and headless bots without reinventing the discovery pipeline.

Where to Find The Moonshots API

The cURL request for the Moonshots endpoint is displayed in the top right of the API Reference. Grab it and start tapping into the potential!

How It Works (Under the Hood)

The Moonshots endpoint aggregates a set of evidence—often combining TM Grade, signal state, and momentum/volume context—into a shortlist of breakout candidates. Each row includes a symbol, grade, signal, and timestamp, plus optional reason tags for transparency.

For UX, a common pattern is: headline list → token detail where you render TM Grade (quality), Trading Signals (timing), Support/Resistance (risk placement), Quantmetrics (risk-adjusted performance), and Price Prediction scenarios. This enables users to understand why a token was flagged and how to act with risk controls.

Polling vs webhooks. Dashboards typically poll with short-TTL caching. Alerting flows use scheduled jobs or webhooks to smooth traffic and avoid duplicates. Always make notifications idempotent.

Production Checklist

Use Cases & Patterns

Next Steps

FAQs

1) What does the Moonshots API return?

A list of breakout candidates with fields such as symbol, tm_grade, signal (often Bullish/Bearish), optional reason tags, and updated_at. Use it to drive discover tabs, alerts, and watchlists.

2) How fresh is the list? What about latency/SLOs?

The endpoint targets predictable latency and timely updates for dashboards and alerts. Use short-TTL caching and queued jobs/webhooks to avoid bursty polling.

3) How do I use Moonshots in a trading workflow?

Common stack: Moonshots for discovery, Trading Signals for timing, Support/Resistance for SL/TP, Quantmetrics for sizing, and Price Prediction for scenario context. Always backtest and paper-trade first.

4) I saw results like “+241%” and a “7.5% average return.” Are these guaranteed?

No. Any historical results are illustrative and not guarantees of future performance. Markets are risky; use risk management and testing.

5) Can I filter the Moonshots list?

Yes—pass parameters like min_grade, signal, and limit (as supported) to tailor to your audience and keep pages fast.

6) Do you provide SDKs or examples?

REST works with JavaScript and Python snippets above. Docs include quickstarts, Postman collections, and templates—start with Run Hello-TM.

7) Pricing, limits, and enterprise SLAs?

Begin free and scale up. See API plans for rate limits and enterprise options.

Research

Support and Resistance API: Auto-Calculate Smart Levels for Better Trades

Token Metrics Team
4

Most traders still draw lines by hand in TradingView. The support and resistance API from Token Metrics auto-calculates clean support and resistance levels from one request, so your dashboard, bot, or alerts can react instantly. In minutes, you’ll call /v2/resistance-support, render actionable levels for any token, and wire them into stops, targets, or notifications. Start by grabbing your key on Get API Key, then Run Hello-TM and Clone a Template to ship a production-ready feature fast.

What You’ll Build in 2 Minutes

A minimal script that fetches Support/Resistance via /v2/resistance-support for a symbol (e.g., BTC, SOL).

  • A one-liner curl to smoke-test your key.
  • A UI pattern to display nearest support, nearest resistance, level strength, and last updated time.

Next Endpoints to add

  • /v2/trading-signals (entries/exits)
  • /v2/hourly-trading-signals (intraday updates)
  • /v2/tm-grade (single-score context)
  • /v2/quantmetrics (risk/return framing)

Why This Matters

Precision beats guesswork. Hand-drawn lines are subjective and slow. The support and resistance API standardizes levels across assets and timeframes, enabling deterministic stops and take-profits your users (and bots) can trust.

Production-ready by design. A simple REST shape, predictable latency, and clear semantics let you add levels to token pages, automate SL/TP alerts, and build rule-based execution with minimal glue code.

Where to Find

Need the Support and Resistance data? The cURL request for it is in the top right of the API Reference for quick access.

👉 Keep momentum: Get API KeyRun Hello-TMClone a Template

How It Works (Under the Hood)

The Support/Resistance endpoint analyzes recent price structure to produce discrete levels above and below current price, along with strength indicators you can use for priority and styling. Query /v2/resistance-support?symbol=<ASSET>&timeframe=<HORIZON> to receive arrays of level objects and timestamps.

Polling vs webhooks. For dashboards, short-TTL caching and batched fetches keep pages snappy. For bots and alerts, use queued jobs or webhooks (where applicable) to avoid noisy, bursty polling—especially around market opens and major events.

Production Checklist

  • Rate limits: Respect plan caps; add client-side throttling.
  • Retries/backoff: Exponential backoff with jitter for 429/5xx; log failures.
  • Idempotency: Make alerting and order logic idempotent to prevent duplicates.
  • Caching: Memory/Redis/KV with short TTLs; pre-warm top symbols.
  • Batching: Fetch multiple assets per cycle; parallelize within rate limits.
  • Threshold logic: Add %-of-price buffers (e.g., alert at 0.3–0.5% from level).
  • Error catalog: Map common 4xx/5xx to actionable user guidance; keep request IDs.
  • Observability: Track p95/p99; measure alert precision (touch vs approach).
  • Security: Store API keys in a secrets manager; rotate regularly.

Use Cases & Patterns

  • Bot Builder (Headless): Use nearest support for stop placement and nearest resistance for profit targets. Combine with /v2/trading-signals for entries/exits and size via Quantmetrics (volatility, drawdown).
  • Dashboard Builder (Product): Add a Levels widget to token pages; badge strength (e.g., High/Med/Low) and show last touch time. Color the price region (below support, between levels, above resistance) for instant context.
  • Screener Maker (Lightweight Tools): “Close to level” sort: highlight tokens within X% of a strong level. Toggle alerts for approach vs breakout events.
  • Risk Management: Create policy rules like “no new long if price is within 0.2% of strong resistance.” Export daily level snapshots for audit/compliance.

Next Steps

  • Get API Key — generate a key and start free.
  • Run Hello-TM — verify your first successful call.
  • Clone a Template — deploy a levels panel or alerts bot today.
  • Watch the demo: Compare plans: Scale confidently with API plans.

FAQs

1) What does the Support & Resistance API return?

A JSON payload with arrays of support and resistance levels for a symbol (and optional timeframe), each with a price and strength indicator, plus an update timestamp.

2) How timely are the levels? What are the latency/SLOs?

The endpoint targets predictable latency suitable for dashboards and alerts. Use short-TTL caching for UIs, and queued jobs or webhooks for alerting to smooth traffic.

3) How do I trigger alerts or trades from levels?

Common patterns: alert when price is within X% of a level, touches a level, or breaks beyond with confirmation. Always make downstream actions idempotent and respect rate limits.

4) Can I combine levels with other endpoints?

Yes—pair with /v2/trading-signals for timing, /v2/tm-grade for quality context, and /v2/quantmetrics for risk sizing. This yields a complete decide-plan-execute loop.

5) Which timeframe should I use?

Intraday bots prefer shorter horizons; swing/position dashboards use daily or higher-timeframe levels. Offer a timeframe toggle and cache results per setting.

6) Do you provide SDKs or examples?

Use the REST snippets above (JS/Python). The docs include quickstarts, Postman collections, and templates—start with Run Hello-TM.

7) Pricing, limits, and enterprise SLAs?

Begin free and scale as you grow. See API plans for rate limits and enterprise SLA options.

Disclaimer

This content is for educational purposes only and does not constitute financial advice. Always conduct your own research before making any trading decisions.

Research

Quantmetrics API: Measure Risk & Reward in One Call

Token Metrics Team
5

Most traders see price—quants see probabilities. The Quantmetrics API turns raw performance into risk-adjusted stats like Sharpe, Sortino, volatility, drawdown, and CAGR so you can compare tokens objectively and build smarter bots and dashboards. In minutes, you’ll query /v2/quantmetrics, render a clear performance snapshot, and ship a feature that customers trust. Start by grabbing your key at Get API Key, Run Hello-TM to verify your first call, then Clone a Template to go live fast.

What You’ll Build in 2 Minutes

  • A minimal script that fetches Quantmetrics for a token via /v2/quantmetrics (e.g., BTC, ETH, SOL).
  • A smoke-test curl you can paste into your terminal.
  • A UI pattern that displays Sharpe, Sortino, volatility, max drawdown, CAGR, and lookback window.

Next Endpoints to Add

  • /v2/tm-grade (one-score signal)
  • /v2/trading-signals
  • /v2/hourly-trading-signals (timing)
  • /v2/resistance-support (risk placement)
  • /v2/price-prediction (scenario planning)

Why This Matters

Risk-adjusted truth beats hype. Price alone hides tail risk and whipsaws. Quantmetrics compresses edge, risk, and consistency into metrics that travel across assets and timeframes—so you can rank universes, size positions, and communicate performance like a professional.

Built for dev speed

A clean REST schema, predictable latency, and easy auth mean you can plug Sharpe/Sortino into bots, dashboards, and screeners without maintaining your own analytics pipeline. Pair with caching and batching to serve fast pages at scale.

Where to Find

The Quant Metrics cURL request is located in the top right of the API Reference, allowing you to easily integrate it with your application.

Build Smarter Crypto Apps & AI Agents with Token Metrics

Token Metrics provides real-time prices, trading signals, and on-chain insights all from one powerful API. Grab a Free API Key

How It Works (Under the Hood)

Quantmetrics computes risk-adjusted performance over a chosen lookback (e.g., 30d, 90d, 1y). You’ll receive a JSON snapshot with core statistics:

  • Sharpe ratio: excess return per unit of total volatility.
  • Sortino ratio: penalizes downside volatility more than upside.
  • Volatility: standard deviation of returns over the window.
  • Max drawdown: worst peak-to-trough decline.
  • CAGR / performance snapshot: geometric growth rate and best/worst periods.

Call /v2/quantmetrics?symbol=<ASSET>&window=<LOOKBACK> to fetch the current snapshot. For dashboards spanning many tokens, batch symbols and apply short-TTL caching. If you generate alerts (e.g., “Sharpe crossed 1.5”), run a scheduled job and queue notifications to avoid bursty polling.

Production Checklist

  • Rate limits: Understand your tier caps; add client-side throttling and queues.
  • Retries & backoff: Exponential backoff with jitter; treat 429/5xx as transient.
  • Idempotency: Prevent duplicate downstream actions on retried jobs.
  • Caching: Memory/Redis/KV with short TTLs; pre-warm popular symbols and windows.
  • Batching: Fetch multiple symbols per cycle; parallelize carefully within limits.
  • Error catalog: Map 4xx/5xx to clear remediation; log request IDs for tracing.
  • Observability: Track p95/p99 latency and error rates; alert on drift.
  • Security: Store API keys in secrets managers; rotate regularly.

Use Cases & Patterns

  • Bot Builder (Headless): Gate entries by Sharpe ≥ threshold and drawdown ≤ limit, then trigger with /v2/trading-signals; size by inverse volatility.
  • Dashboard Builder (Product): Add a Quantmetrics panel to token pages; allow switching lookbacks (30d/90d/1y) and export CSV.
  • Screener Maker (Lightweight Tools): Top-N by Sortino with filters for volatility and sector; add alert toggles when thresholds cross.
  • Allocator/PM Tools: Blend CAGR, Sharpe, drawdown into a composite score to rank reallocations; show methodology for trust.
  • Research/Reporting: Weekly digest of tokens with Sharpe ↑, drawdown ↓, and volatility ↓.

Next Steps

  • Get API Key — start free and generate a key in seconds.
  • Run Hello-TM — verify your first successful call.
  • Clone a Template — deploy a screener or dashboard today.
  • Watch the demo: VIDEO_URL_HERE
  • Compare plans: Scale with API plans.

FAQs

1) What does the Quantmetrics API return?

A JSON snapshot of risk-adjusted metrics (e.g., Sharpe, Sortino, volatility, max drawdown, CAGR) for a symbol and lookback window—ideal for ranking, sizing, and dashboards.

2) How fresh are the stats? What about latency/SLOs?

Responses are engineered for predictable latency. For heavy UI usage, add short-TTL caching and batch requests; for alerts, use scheduled jobs or webhooks where available.

3) Can I use Quantmetrics to size positions in a live bot?

Yes—many quants size inversely to volatility or require Sharpe ≥ X to trade. Always backtest and paper-trade before going live; past results are illustrative, not guarantees.

4) Which lookback window should I choose?

Short windows (30–90d) adapt faster but are noisier; longer windows (6–12m) are steadier but slower to react. Offer users a toggle and cache each window.

5) Do you provide SDKs or examples?

REST is straightforward (JS/Python above). Docs include quickstarts, Postman collections, and templates—start with Run Hello-TM.

6) Polling vs webhooks for quant alerts?

Dashboards usually use cached polling. For threshold alerts (e.g., Sharpe crosses 1.0), run scheduled jobs and queue notifications to keep usage smooth and idempotent.

7) Pricing, limits, and enterprise SLAs?

Begin free and scale up. See API plans for rate limits and enterprise SLA options.

Disclaimer

All information provided in this blog is for educational purposes only. It is not intended as financial advice. Users should perform their own research and consult with licensed professionals before making any investment or trading decisions.

Choose from Platinum, Gold, and Silver packages
Reach with 25–30% open rates and 0.5–1% CTR
Craft your own custom ad—from banners to tailored copy
Perfect for Crypto Exchanges, SaaS Tools, DeFi, and AI Products