Back to blog
Research

What Are the Biggest Risks in Crypto Trading?

Discover the biggest risks in crypto trading—from volatility and scams to emotional mistakes—and learn how Token Metrics’ AI tools can help you trade smarter and safer.
Token Metrics Team
8 min
Want Smarter Crypto Picks—Free?
See unbiased Token Metrics Ratings for BTC, ETH, and top alts.
Thank you! Your submission has been received!
Oops! Something went wrong while submitting the form.
 No credit card | 1-click unsubscribe

Cryptocurrency trading can be highly rewarding, but it’s also one of the riskiest financial activities you can engage in. Prices can swing wildly within minutes, markets are largely unregulated, and scams remain rampant. Whether you’re a beginner investor or a seasoned trader, understanding these risks is critical for protecting your capital and making informed decisions.

In this guide, we’ll break down the biggest risks in crypto trading, how to recognize them, and how Token Metrics can help you minimize those risks using AI-driven insights.

1. Extreme Volatility

The crypto market is famous for its rapid price fluctuations. Unlike traditional stocks, which typically move in small percentages daily, cryptocurrencies can experience 10–50% swings in a single day.

  • Why it matters:

    • Quick price drops can wipe out profits or even your entire portfolio.
    • Leverage trading amplifies these risks, often leading to liquidations.

  • Example:
    In May 2021, Bitcoin fell from $64,000 to $30,000 in just weeks, catching many traders off guard.

How Token Metrics Helps:
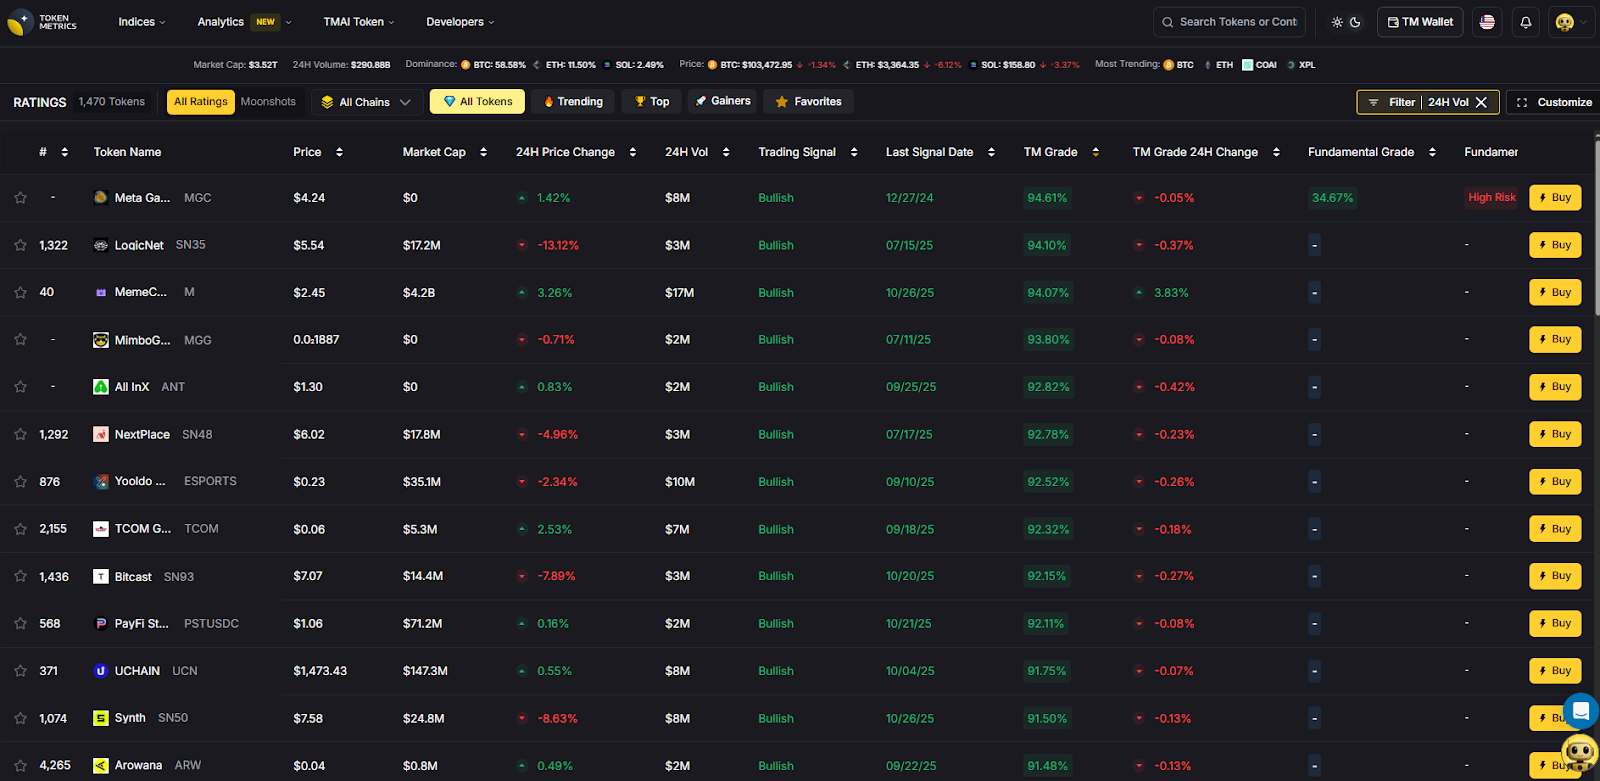
Token Metrics provides AI-powered trading signals and market trend analysis to help you avoid trading blindly. Our Trader Grades let you know when an asset is trending bullish or bearish, giving you data-driven entry and exit points.

2. Lack of Regulation

Unlike traditional finance, cryptocurrency operates in a largely unregulated space. This creates both opportunities and risks.

  • Key risks:

    • Exchanges can shut down or get hacked with little recourse.
    • Bad actors can manipulate prices (pump-and-dump schemes).
    • Regulatory crackdowns in certain regions can cause market crashes.

How Token Metrics Helps:
We track regulatory trends and narratives using AI-driven sentiment analysis, alerting you to shifts that could impact your holdings.

3. Security Risks & Hacking

Crypto traders often store their assets on exchanges or hot wallets—prime targets for hackers.

  • Risks include:

    • Exchange hacks leading to stolen funds.
    • Phishing scams that trick users into giving away private keys.
    • Rug pulls in DeFi projects that drain liquidity.

How Token Metrics Helps:
Token Metrics evaluates crypto projects with AI-based risk scoring, helping you avoid tokens and platforms with poor security practices or suspicious activity.

4. Scams & Fraud

From rug pulls to fake ICOs and Ponzi schemes, crypto has become a hotbed for scams targeting inexperienced traders.

  • Examples of common scams:

    • Pump-and-dump groups on Telegram.
    • Fake airdrops asking for wallet connections.
    • Impersonation scams on social media.

How Token Metrics Helps:
Our Moonshot Finder doesn’t just find hidden gem tokens—it uses AI-driven vetting to filter out high-risk projects, helping you spot potential scams before you invest.

5. Emotional Trading

The fear of missing out (FOMO) and panic selling are two of the biggest psychological pitfalls in crypto trading.

  • How it affects traders:

    • FOMO causes impulsive buying at peaks.
    • Panic selling during dips leads to unnecessary losses.
    • Overtrading erodes profits through excessive fees and bad timing.

How Token Metrics Helps:
By offering objective, AI-driven market insights, Token Metrics removes the emotional bias from trading. Our data-backed signals tell you when to hold, sell, or accumulate—reducing emotionally driven mistakes.

6. Liquidity Risks

Some cryptocurrencies—especially low-cap altcoins—have low liquidity, making it difficult to buy or sell without significantly impacting the price.

  • Why this matters:

    • You may be unable to exit a position when needed.
    • Large trades can cause slippage and losses.

How Token Metrics Helps:
Our platform tracks liquidity metrics for thousands of tokens, ensuring you know the trading conditions before entering or exiting a position.

7. Leverage & Margin Trading Dangers

While leverage trading can amplify profits, it can also wipe out your portfolio quickly.

  • Risks include:

    • Liquidation if prices move against your position.
    • Amplified emotional stress and poor decision-making.

How Token Metrics Helps:
Token Metrics identifies high-probability trades using AI-based technical analysis, reducing the guesswork in leveraged trading.

8. Narrative & Hype Cycles

Crypto prices are often driven by hype, social media trends, and narratives, which can be unpredictable and short-lived.

  • Example:
    The rapid rise and fall of meme tokens like Dogecoin and Shiba Inu, which surged based on social media buzz but saw massive corrections.

How Token Metrics Helps:
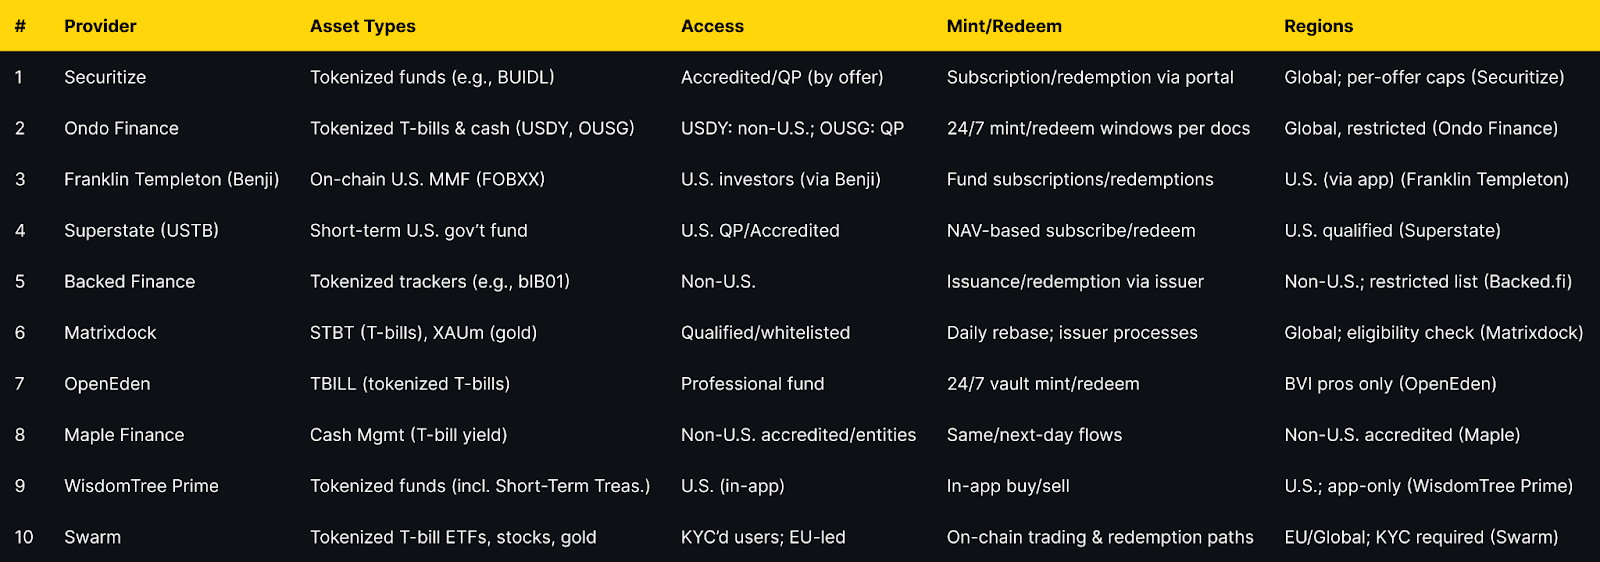
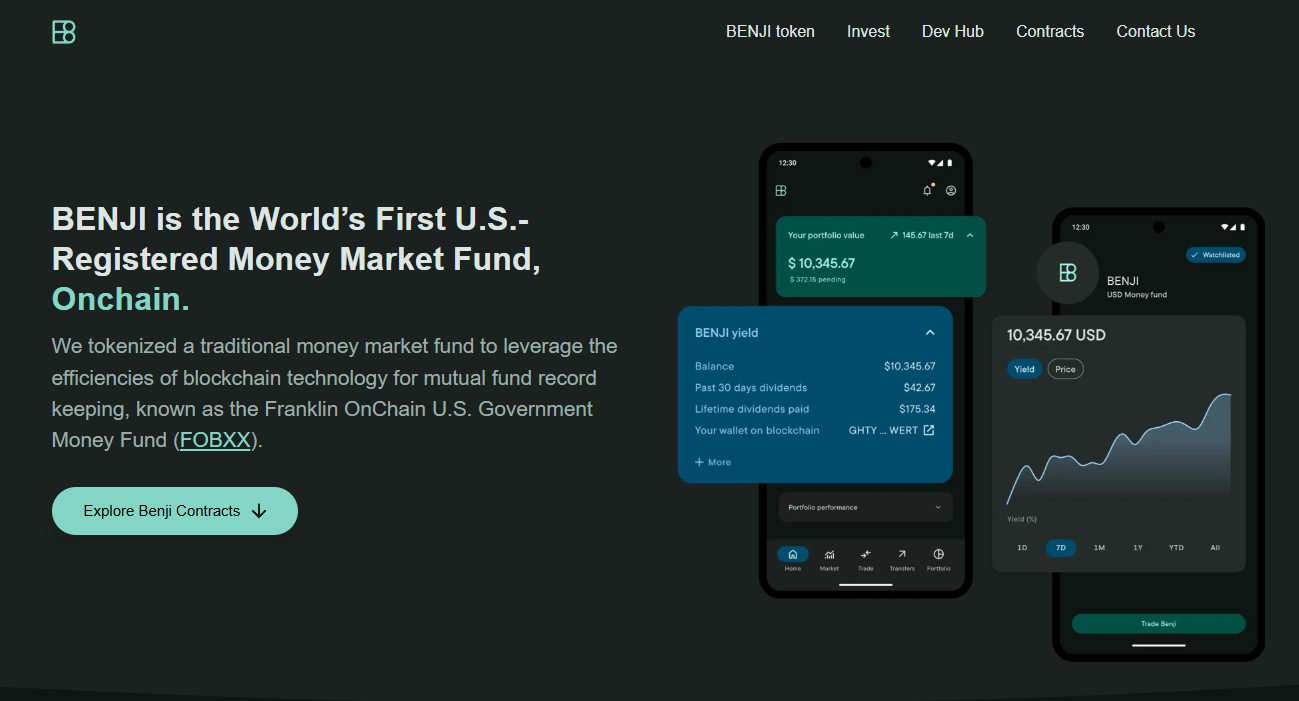
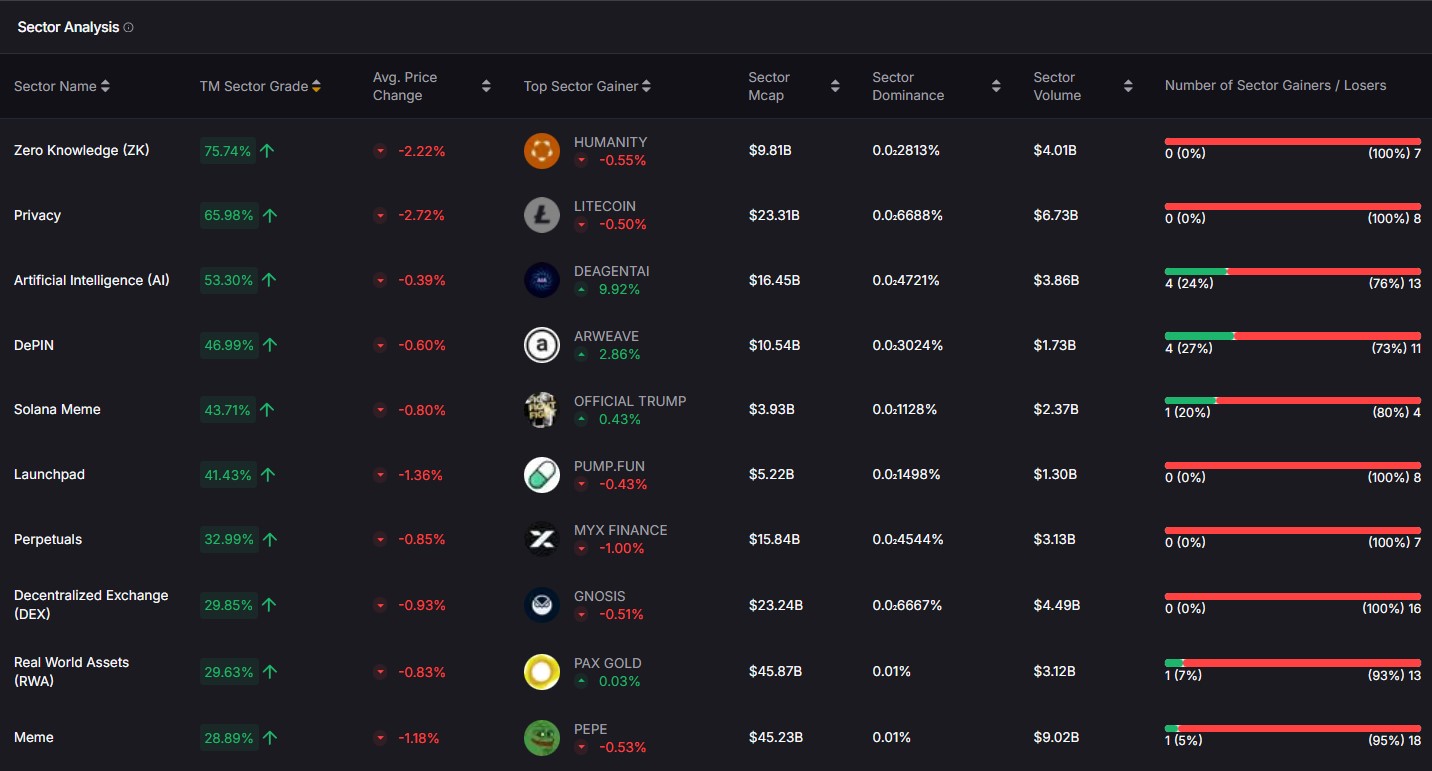
Our AI detects emerging narratives early—whether it’s AI tokens, DeFi, or RWA projects—so you can position yourself before the hype cycle peaks.

How to Mitigate These Risks

Here are some best practices for reducing crypto trading risks:

  1. Diversify your portfolio: Don’t put all your funds into one token.
  2. Use AI-powered tools like Token Metrics: Let data, not emotions, guide your trades.
  3. Practice good security hygiene: Use hardware wallets and enable two-factor authentication.
  4. Avoid leverage until experienced: Trade with spot assets before exploring margin.
  5. Stay updated: Monitor news and regulatory developments.

Why Token Metrics Is the Best Tool for Risk Management

Token Metrics is more than a research platform—it’s your AI-powered trading assistant. Here’s why traders trust it:

  • AI-Powered Signals: Get real-time bullish/bearish alerts for smarter trading.
  • Risk Scoring: Avoid scams and unsafe projects with our proprietary evaluations.
  • Moonshot Finder: Discover promising low-cap tokens with AI-vetted potential.
  • Trader & Investor Grades: Balance short-term trading with long-term investing.
  • AI Indices: Use auto-managed portfolios to reduce risk through diversification.


Whether you’re a beginner looking to avoid common pitfalls or an advanced trader seeking data-driven edge, Token Metrics helps you trade smarter and safer.

Final Thoughts

So, what are the biggest risks in crypto trading? From extreme volatility and scams to emotional decision-making and security threats, the dangers are real. But with the right strategies and tools, you can navigate the market with confidence.

By using Token Metrics’ AI-powered insights, you can reduce emotional bias, avoid high-risk tokens, and make smarter, data-driven trades—turning crypto’s volatility from a threat into an opportunity.

Build Smarter Crypto Apps &
AI Agents in Minutes, Not Months
Real-time prices, trading signals, and on-chain insights all from one powerful API.
Grab a Free API Key
About Token Metrics
Token Metrics: AI-powered crypto research and ratings platform. We help investors make smarter decisions with unbiased Token Metrics Ratings, on-chain analytics, and editor-curated “Top 10” guides. Our platform distills thousands of data points into clear scores, trends, and alerts you can act on.
30 Employees
analysts, data scientists, and crypto engineers
30 Employees
analysts, data scientists, and crypto engineers
30 Employees
analysts, data scientists, and crypto engineers
Want Smarter Crypto Picks—Free?
See unbiased Token Metrics Ratings for BTC, ETH, and top alts.
Thank you! Your submission has been received!
Oops! Something went wrong while submitting the form.
 No credit card | 1-click unsubscribe
Token Metrics Team
Token Metrics Team

Recent Posts

Research

Bitcoin Cash (BCH) 2028 Price Targets: Token Metrics Scenarios

Token Metrics Team
7 min read

Market Context for Bitcoin Cash: The Case for 2028

The Layer 1 landscape is consolidating as users and developers gravitate to chains with clear specialization. Bitcoin Cash positions itself as a payment-focused chain with low fees and quick settlement for everyday usage.

The scenario projections below map potential outcomes for BCH across different total crypto market sizes. Base cases assume steady usage and listings, while moon scenarios factor in stronger liquidity and accelerated adoption.


Disclosure

Educational purposes only, not financial advice. Crypto is volatile, do your own research and manage risk.

How to read it: Each band blends cycle analogues and market-cap share math with TA guardrails. Base assumes steady adoption and neutral or positive macro. Moon layers in a liquidity boom. Bear assumes muted flows and tighter liquidity.

TM Agent baseline:

Token Metrics lead metric for Bitcoin Cash, cashtag $BCH, is a TM Grade of 54.81%, which translates to Neutral, and the trading signal is bearish, indicating short-term downward momentum. This implies Token Metrics views $BCH as mixed value long term: fundamentals look strong, while valuation and technology scores are weak, so upside depends on improvements in adoption or technical development. Market context: Bitcoin has been setting market direction, and with broader risk-off moves altcoins face pressure, which increases downside risk for $BCH in the near term.

Live details:

Bitcoin Cash Token Details 

Buy BCH on MEXC

Affiliate Disclosure: We may earn a commission from qualifying purchases made via this link, at no extra cost to you.

Key Takeaways

  • Scenario driven, outcomes hinge on total crypto market cap, higher liquidity and adoption lift the bands.
  • Fundamentals: Fundamental Grade 80.41% (Community 62%, Tokenomics 100%, Exchange 100%, VC —, DeFi Scanner 72%).
  • Technology: Technology Grade 29.63% (Activity 22%, Repository 70%, Collaboration 48%, Security —, DeFi Scanner 72%).
  • TM Agent gist: Neutral grade, bearish momentum, adoption must improve.
  • Education only, not financial advice.

Scenario Analysis

Token Metrics scenarios span four market cap tiers, each representing different levels of crypto market maturity and liquidity:

  • 8T: At an 8t total crypto market cap, BCH projects to $910.79 in bear conditions, $1,025.20 in the base case, and $1,139.62 in bullish scenarios.  
  • 16T: Doubling the market to 16 trillion expands the range to $1,606.59 (bear), $1,949.83 (base), and $2,293.07 (moon).  
  • 23T: At 23 trillion, the scenarios show $2,302.38, $2,874.46, and $3,446.53 respectively.  
  • 31T: In the maximum liquidity scenario of 31 trillion, BCH could reach $2,998.18 (bear), $3,799.08 (base), or $4,599.99 (moon).  

Each tier assumes progressively stronger market conditions, with the base case reflecting steady growth and the moon case requiring sustained bull market dynamics.

Why Consider the Indices with Top-100 Exposure

Bitcoin Cash represents one opportunity among hundreds in crypto markets. Token Metrics Indices bundle BCH with top one hundred assets for systematic exposure to the strongest projects. Single tokens face idiosyncratic risks that diversified baskets mitigate.

Historical index performance demonstrates the value of systematic diversification versus concentrated positions.

Join the early access list

What Is Bitcoin Cash?

Bitcoin Cash is a peer-to-peer electronic cash network focused on fast confirmation and low fees. It launched in 2017 as a hard fork of Bitcoin with larger block capacity to prioritize payments. The chain secures value transfers using proof of work and aims to keep everyday transactions affordable.

BCH is used to pay transaction fees and settle transfers, and it is widely listed across major exchanges. Adoption centers on payments, micropayments, and remittances where low fees matter. It competes as a payment‑focused Layer 1 within the broader crypto market.

Token Metrics AI Analysis

Token Metrics AI provides comprehensive context on Bitcoin Cash's positioning and challenges.

Vision:

Bitcoin Cash (BCH) is a cryptocurrency that emerged from a 2017 hard fork of Bitcoin, aiming to function as a peer-to-peer electronic cash system with faster transactions and lower fees. It is known for prioritizing on-chain scalability by increasing block sizes, allowing more transactions per block compared to Bitcoin. This design choice supports its use in everyday payments, appealing to users seeking a digital cash alternative. Adoption has been driven by its utility in micropayments and remittances, particularly in regions with limited banking infrastructure. However, Bitcoin Cash faces challenges including lower network security due to reduced mining hash rate compared to Bitcoin, and ongoing competition from both Bitcoin and other scalable blockchains. Its value proposition centers on accessibility and transaction efficiency, but it operates in a crowded space with evolving technological and regulatory risks.

Problem:

The project addresses scalability limitations in Bitcoin, where rising transaction fees and slow confirmation times hinder its use for small, frequent payments. As Bitcoin evolved into a store of value, a gap emerged for a blockchain-based currency optimized for fast, low-cost transactions accessible to the general public.

Solution:

Bitcoin Cash increases block size limits from 1 MB to 32 MB, enabling more transactions per block and reducing congestion. This on-chain scaling approach allows for faster confirmations and lower fees, making microtransactions feasible. The network supports basic smart contract functionality and replay protection, maintaining compatibility with Bitcoin's core architecture while prioritizing payment utility.

Market Analysis:

Bitcoin Cash operates in the digital currency segment, competing with Bitcoin, Litecoin, and stablecoins for use in payments and remittances. While not the market leader, it occupies a niche focused on on-chain scalability for transactional use. Its adoption is influenced by merchant acceptance, exchange liquidity, and narratives around digital cash. Key risks include competition from layer-2 solutions on other blockchains, regulatory scrutiny of cryptocurrencies, and lower developer and miner activity compared to larger networks. Price movements are often tied to broader crypto market trends and internal protocol developments. Despite its established presence, long-term growth depends on sustained utility, network security, and differentiation in a market increasingly dominated by high-throughput smart contract platforms.

Fundamental and Technology Snapshot from Token Metrics

Fundamental Grade: 80.41% (Community 62%, Tokenomics 100%, Exchange 100%, VC —, DeFi Scanner 72%).  

Technology Grade: 29.63% (Activity 22%, Repository 70%, Collaboration 48%, Security —, DeFi Scanner 72%).  

Catalysts That Skew Bullish

  • Institutional and retail access expands with ETFs, listings, and integrations.
  • Macro tailwinds from lower real rates and improving liquidity.
  • Product or roadmap milestones such as upgrades, scaling, or partnerships.

Risks That Skew Bearish

  • Macro risk-off from tightening or liquidity shocks.
  • Regulatory actions or infrastructure outages.
  • Concentration or validator economics and competitive displacement.

FAQs

Can BCH reach $3,000?

Based on the scenarios, BCH could reach $3,000 in the 23T moon case and 31T base case. The 23T tier projects $3,446.53 in the moon case. Not financial advice.

Can BCH 10x from current levels?

At current price of $553.54, a 10x would reach $5,535.40. This falls within the 31T base and moon cases. Bear in mind that 10x returns require substantial market cap expansion. Not financial advice.

Should I buy BCH now or wait?

Timing depends on your risk tolerance and macro outlook. Current price of $553.54 sits below the 8T bear case in our scenarios. Dollar-cost averaging may reduce timing risk. Not financial advice.  

Next Steps

Track live grades and signals

Join Indices Early Access

Want exposure? Buy BCH on MEXC

Disclosure

Educational purposes only, not financial advice. Crypto is volatile, do your own research and manage risk.

Research

Chainlink (LINK) 2027 Price Targets: Token Metrics Scenarios

Token Metrics Team
8 min read

Understanding LINK's 2027 Potential

Infrastructure protocols become more valuable as the crypto ecosystem scales and relies on robust middleware. Chainlink provides critical oracle infrastructure where proven utility and deep integrations drive long-term value over retail speculation. Increasing institutional adoption raises demand for professional-grade data delivery and security.

Token Metrics projections for LINK below span multiple total market cap scenarios from conservative to aggressive. Each tier assumes different levels of infrastructure demand as crypto evolves from speculative markets to institutional-grade systems. These bands frame LINK's potential outcomes into 2027.


Disclosure

Educational purposes only, not financial advice. Crypto is volatile, do your own research and manage risk.

How to read it: Each band blends cycle analogues and market-cap share math with TA guardrails. Base assumes steady adoption and neutral or positive macro. Moon layers in a liquidity boom. Bear assumes muted flows and tighter liquidity.

TM Agent baseline: Token Metrics lead metric for Chainlink, cashtag $LINK, is a TM Grade of 23.31%, which translates to a Sell, and the trading signal is bearish, indicating short-term downward momentum. This means Token Metrics currently does not endorse $LINK as a long-term buy at current conditions.

Live details: Chainlink Token Details

Access: Buy LINK on MEXC

Affiliate Disclosure: We may earn a commission from qualifying purchases made via this link, at no extra cost to you.

Key Takeaways

  • Scenario driven, outcomes hinge on total crypto market cap, higher liquidity and adoption lift the bands.
  • Fundamentals: Fundamental Grade 74.58% (Community 81%, Tokenomics 100%, Exchange 100%, VC —, DeFi Scanner 17%).
  • Technology: Technology Grade 88.50% (Activity 81%, Repository 72%, Collaboration 100%, Security 86%, DeFi Scanner 17%).
  • TM Agent gist: bearish signal with limited upside unless fundamentals or market regime change.
  • Education only, not financial advice.

Scenario Analysis

Token Metrics scenarios span four market cap tiers, each representing different levels of crypto market maturity and liquidity:

8T: At an 8 trillion dollar total crypto market cap, LINK projects to $26.10 in bear conditions, $30.65 in the base case, and $35.20 in bullish scenarios.  

16T: Doubling the market to 16 trillion expands the range to $42.64 (bear), $56.29 (base), and $69.95 (moon).  

23T: At 23 trillion, the scenarios show $59.18, $81.94, and $104.70 respectively.  

31T: In the maximum liquidity scenario of 31 trillion, LINK could reach $75.71 (bear), $107.58 (base), or $139.44 (moon).  

Why Consider the Indices with Top-100 Exposure

Chainlink represents one opportunity among hundreds in crypto markets. Token Metrics Indices bundle LINK with top one hundred assets for systematic exposure to the strongest projects. Single tokens face idiosyncratic risks that diversified baskets mitigate.

Historical index performance demonstrates the value of systematic diversification versus concentrated positions.

Join the early access list

What Is Chainlink?

Chainlink is a decentralized oracle network that connects smart contracts to real-world data and systems. It enables secure retrieval and verification of off-chain information, supports computation, and integrates across multiple blockchains. As adoption grows, Chainlink serves as critical infrastructure for reliable data feeds and automation.

The LINK token is used to pay node operators and secure the network’s services. Common use cases include DeFi price feeds, insurance, and enterprise integrations, with CCIP extending cross-chain messaging and token transfers.

Token Metrics AI Analysis

Vision: Chainlink aims to create a decentralized, secure, and reliable network for connecting smart contracts with real-world data and systems. Its vision is to become the standard for how blockchains interact with external environments, enabling trust-minimized automation across industries.

Problem: Smart contracts cannot natively access data outside their blockchain, limiting their functionality. Relying on centralized oracles introduces single points of failure and undermines the security and decentralization of blockchain applications. This creates a critical need for a trustless, tamper-proof way to bring real-world information onto blockchains.

Solution: Chainlink solves this by operating a decentralized network of node operators that fetch, aggregate, and deliver data from off-chain sources to smart contracts. It uses cryptographic proofs, reputation systems, and economic incentives to ensure data integrity. The network supports various data types and computation tasks, allowing developers to build complex, data-driven decentralized applications.

Market Analysis: Chainlink is a market leader in the oracle space and a key infrastructure component in the broader blockchain ecosystem, particularly within Ethereum and other smart contract platforms. It faces competition from emerging oracle networks like Band Protocol and API3, but maintains a strong first-mover advantage and widespread integration across DeFi, NFTs, and enterprise blockchain solutions. Adoption is driven by developer activity, partnerships with major blockchain projects, and demand for secure data feeds. Key risks include technological shifts, regulatory scrutiny on data providers, and execution challenges in scaling decentralized oracle networks. As smart contract usage grows, so does the potential for oracle services, positioning Chainlink at the center of a critical niche, though its success depends on maintaining security and decentralization over time.

Fundamental and Technology Snapshot from Token Metrics

Fundamental Grade: 74.58% (Community 81%, Tokenomics 100%, Exchange 100%, VC —, DeFi Scanner 17%).  

Technology Grade: 88.50% (Activity 81%, Repository 72%, Collaboration 100%, Security 86%, DeFi Scanner 17%).  

Catalysts That Skew Bullish

  • Institutional and retail access expands with ETFs, listings, and integrations.
  • Macro tailwinds from lower real rates and improving liquidity.
  • Product or roadmap milestones such as upgrades, scaling, or partnerships.

Risks That Skew Bearish

  • Macro risk-off from tightening or liquidity shocks.
  • Regulatory actions or infrastructure outages.
  • Concentration or validator economics and competitive displacement.

FAQs

Can LINK reach $100?

Yes. Based on the scenarios, LINK could reach $100+ in the 23T moon case. The 23T tier projects $104.70 in the moon case. Not financial advice.

What price could LINK reach in the moon case?

Moon case projections range from $35.20 at 8T to $139.44 at 31T. These scenarios assume maximum liquidity expansion and strong Chainlink adoption. Not financial advice.  

Should I buy LINK now or wait?

Timing depends on risk tolerance and macro outlook. Current price of $18.09 sits below the 8T bear case in the scenarios. Dollar-cost averaging may reduce timing risk. Not financial advice.

Next Steps

Track live grades and signals: Token Details

Join Indices Early Access 

Want exposure? Buy LINK on MEXC 

Disclosure

Educational purposes only, not financial advice. Crypto is volatile, do your own research and manage risk.

Why Token Metrics Ratings Matter

Discover the full potential of your crypto research and portfolio management with Token Metrics. Our ratings combine AI-driven analytics, on-chain data, and decades of investing expertise—giving you the edge to navigate fast-changing markets. Try our platform to access scenario-based price targets, token grades, indices, and more for institutional and individual investors. Token Metrics is your research partner through every crypto market cycle.

Research

Hyperliquid (HYPE) Price Prediction to 2028: Scenario Ranges, Scores and Key Drivers

Token Metrics Team
7 min read

Why 2026 Looks Bullish, And What It Could Mean for HYPE

The crypto market is tilting bullish into 2026 as liquidity, infrastructure, and participation improve across the board. Clearer rules and standards are reshaping the classic four-year cycle, flows can arrive earlier, and strength can persist longer than in prior expansions.

Institutional access is widening through ETFs and custody, while L2 scaling and real-world integrations help sustain on‑chain activity. This healthier backdrop frames our scenario work for HYPE. The ranges below reflect different total crypto market sizes and the share Hyperliquid could capture under each regime.


Disclosure

Educational purposes only, not financial advice. Crypto is volatile, do your own research and manage risk.

How to read it: Each band blends cycle analogues and market-cap share math with TA guardrails. Base assumes steady adoption and neutral or positive macro. Moon layers in a liquidity boom. Bear assumes muted flows and tighter liquidity.

TM Agent baseline: Token Metrics TM Grade is 73.9%, a Buy, and the trading signal is bearish, indicating short-term downward momentum. This means Token Metrics judges HYPE as fundamentally attractive over the long term, while near-term momentum is negative and may limit rallies.

Live details: Hyperliquid Token Details

Buy HYPE

Affiliate Disclosure: We may earn a commission from qualifying purchases made via this link, at no extra cost to you.

Key Takeaways

  • Scenario driven, outcomes hinge on total crypto market cap. Higher liquidity and adoption lift the bands.
  • Fundamentals: Fundamental Grade 76.73% (Community 68%, Tokenomics 60%, Exchange 100%, VC —, DeFi Scanner 92%).
  • Technology: Technology Grade N/A (Activity —, Repository —, Collaboration —, Security —, DeFi Scanner 92%).
  • TM Agent gist: Long-term attractive on fundamentals, near-term momentum is negative and may limit rallies.

Scenario Analysis

Token Metrics scenarios span four market cap tiers, each representing different levels of crypto market maturity and liquidity:

8T: At an 8 trillion dollar total crypto market cap, HYPE projects to $48.81 in bear conditions, $49.92 in the base case, and $51.03 in bullish scenarios.  


16T: Doubling the market to 16 trillion expands the range to $50.72 (bear), $54.05 (base), and $57.38 (moon).  

23T: At 23 trillion, the scenarios show $52.62, $58.17, and $63.72 respectively.  

31T: In the maximum liquidity scenario of 31 trillion, HYPE could reach $54.52 (bear), $62.29 (base), or $70.07 (moon).

Each tier assumes progressively stronger market conditions, with the base case reflecting steady growth and the moon case requiring sustained bull market dynamics.

Why Consider the Indices with Top-100 Exposure

Diversification matters. HYPE is compelling, yet concentrated bets can be volatile. Token Metrics Indices hold HYPE alongside the top one hundred tokens for broad exposure to leaders and emerging winners.

Our backtests indicate that owning the full market with diversified indices has historically outperformed both the total market and Bitcoin in many regimes due to diversification and rotation.

Get early access

What Is Hyperliquid?

Hyperliquid is a decentralized exchange focused on perpetual futures with a high-performance order book architecture. The project emphasizes low-latency trading, risk controls, and capital efficiency aimed at professional and retail derivatives traders. Its token, HYPE, is used for ecosystem incentives and governance-related utilities.

Catalysts That Skew Bullish

  • Institutional and retail access expands with ETFs, listings, and integrations.
  • Macro tailwinds from lower real rates and improving liquidity.
  • Product or roadmap milestones such as upgrades, scaling, or partnerships.

Risks That Skew Bearish

  • Macro risk-off from tightening or liquidity shocks.
  • Regulatory actions or infrastructure outages.
  • Concentration or validator economics and competitive displacement.

FAQs

Can HYPE reach $60?

Yes, the 23T and 31T tiers imply ranges above $60 in the Base and Moon bands, though outcomes depend on liquidity and adoption. Not financial advice.

Is HYPE a good long-term investment?

Outcome depends on adoption, liquidity regime, competition, and supply dynamics. Diversify and size positions responsibly.  

Next Steps

Disclosure

Educational purposes only, not financial advice. Crypto is volatile, do your own research and manage risk.

Your Edge: Powered by Token Metrics

Token Metrics delivers AI-based crypto ratings, scenario projections, and portfolio tools so you can make smarter decisions. Discover real-time analytics on Token Metrics.

Choose from Platinum, Gold, and Silver packages
Reach with 25–30% open rates and 0.5–1% CTR
Craft your own custom ad—from banners to tailored copy
Perfect for Crypto Exchanges, SaaS Tools, DeFi, and AI Products