Crypto Basics

What Indicators Should I Use for Technical Crypto Analysis?

Discover the top indicators for crypto technical analysis—RSI, MACD, moving averages, and more. Learn how Token Metrics uses AI to combine indicators for smarter trading.
Token Metrics Team
8 min
MIN

If you’re serious about trading cryptocurrency, technical analysis (TA) is an essential skill. It helps you understand price movements, predict trends, and identify high-probability entry and exit points.

But with hundreds of technical indicators available, one common question is: “Which indicators should I use for technical analysis?”

In this guide, we’ll break down the most effective indicators for crypto trading, explain how they work, and show you how Token Metrics combines them with AI-driven insights to help you trade smarter.

Why Use Technical Indicators in Crypto?

Unlike traditional stocks, cryptocurrency markets trade 24/7, are more volatile, and are largely driven by sentiment and speculation.

Technical indicators help you:

  • Identify trends (bullish or bearish).

  • Pinpoint support and resistance levels.

  • Detect overbought or oversold conditions.

  • Find entry and exit points with better timing.

The key is not using one indicator in isolation but combining multiple tools for confirmation—which is exactly what Token Metrics does with its AI-driven trading signals.

The Most Important Indicators for Technical Analysis

Here are the must-know indicators for crypto traders:

1. Moving Averages (MA & EMA)

What they do:
Moving averages smooth out price data to help you identify overall market direction.

  • Simple Moving Average (SMA): Calculates the average closing price over a set period (e.g., 50-day, 200-day).

  • Exponential Moving Average (EMA): Gives more weight to recent prices, making it more responsive.

How to use them:

  • Golden Cross: When the 50-day MA crosses above the 200-day MA → bullish signal.

  • Death Cross: When the 50-day MA crosses below the 200-day MA → bearish signal.

Best for:
Spotting long-term trends and momentum.

2. Relative Strength Index (RSI)

What it does:
RSI measures price momentum and identifies overbought (70+) or oversold (30-) conditions.

How to use it:

  • Above 70: Asset may be overbought → possible pullback.

  • Below 30: Asset may be oversold → potential bounce.

Best for:
Finding reversal points and confirming trend strength.

3. Moving Average Convergence Divergence (MACD)

What it does:
MACD measures the relationship between two EMAs (usually 12-day and 26-day) and generates buy/sell signals based on crossovers.

How to use it:

  • Bullish crossover: MACD line crosses above the signal line.

  • Bearish crossover: MACD line crosses below the signal line.

Best for:
Spotting trend changes early.

4. Bollinger Bands

What they do:
Bollinger Bands create a price channel around an asset using a moving average plus/minus two standard deviations.

How to use them:

  • Price near upper band: Potential overbought condition.

  • Price near lower band: Potential oversold condition.

  • Band squeeze: Indicates upcoming volatility.

Best for:
Predicting volatility and identifying breakout opportunities.

5. Volume Indicators (OBV & VWAP)

What they do:
Volume indicators confirm price movements and help spot trend strength.

  • On-Balance Volume (OBV): Tracks buying/selling pressure.

  • VWAP (Volume-Weighted Average Price): Shows average price relative to volume.

Best for:
Confirming whether a trend is supported by strong trading volume.

6. Fibonacci Retracement

What it does:
Identifies key support and resistance levels based on Fibonacci ratios (23.6%, 38.2%, 50%, 61.8%, etc.).

How to use it:

  • Place retracement levels between swing highs and lows to find potential pullback or breakout zones.

Best for:
Setting targets and identifying price zones for entries/exits.

7. Stochastic Oscillator

What it does:
Measures price momentum by comparing closing prices to recent price ranges.

How to use it:

  • Above 80: Overbought.

  • Below 20: Oversold.

  • Use crossovers for potential buy/sell signals.

Best for:
Short-term traders looking for momentum shifts.

8. Ichimoku Cloud

What it does:
Provides a complete view of trend, momentum, and support/resistance levels in one indicator.

How to use it:

  • Price above cloud: Bullish.

  • Price below cloud: Bearish.

  • Cloud crossovers: Signal trend reversals.

Best for:
Swing traders who need multi-factor confirmation in one tool.

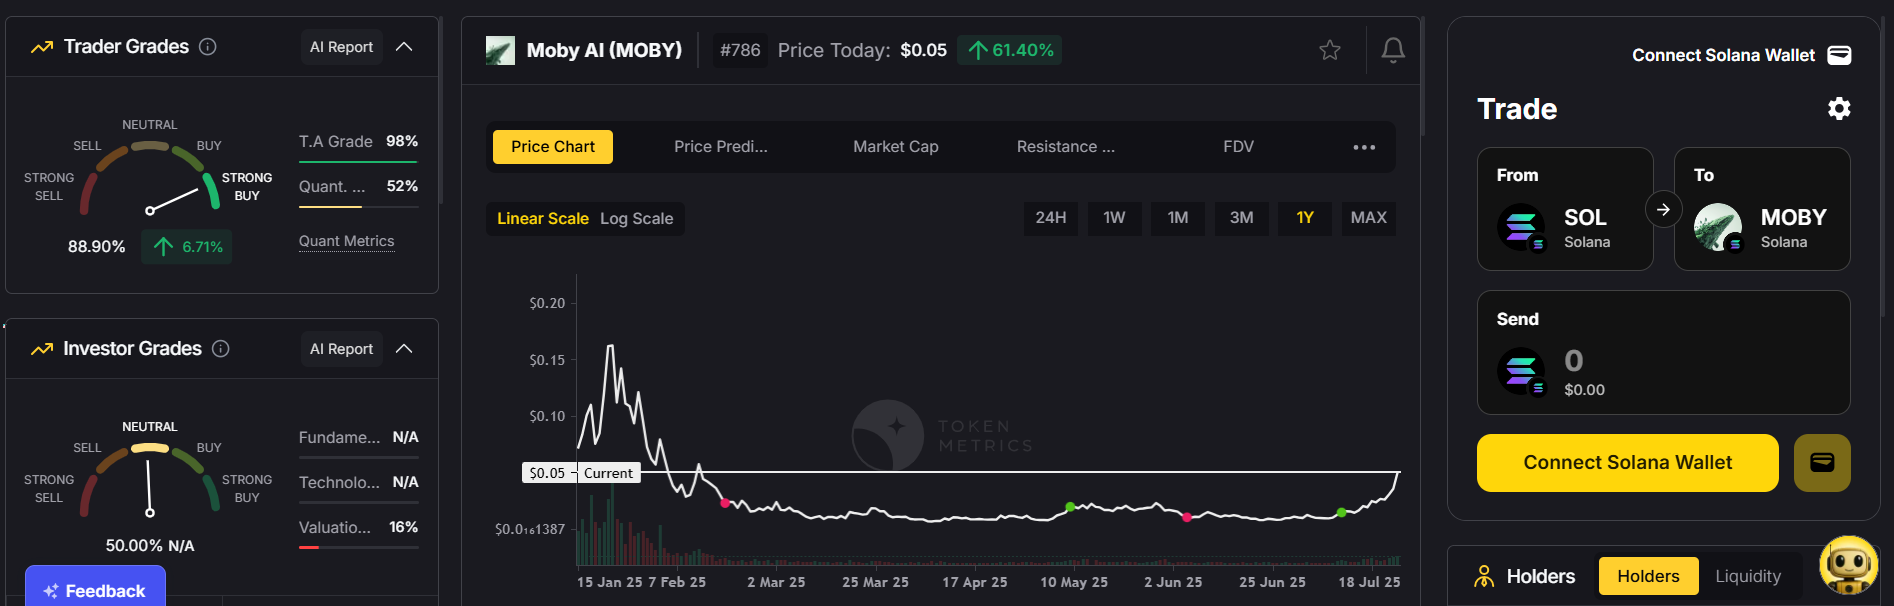
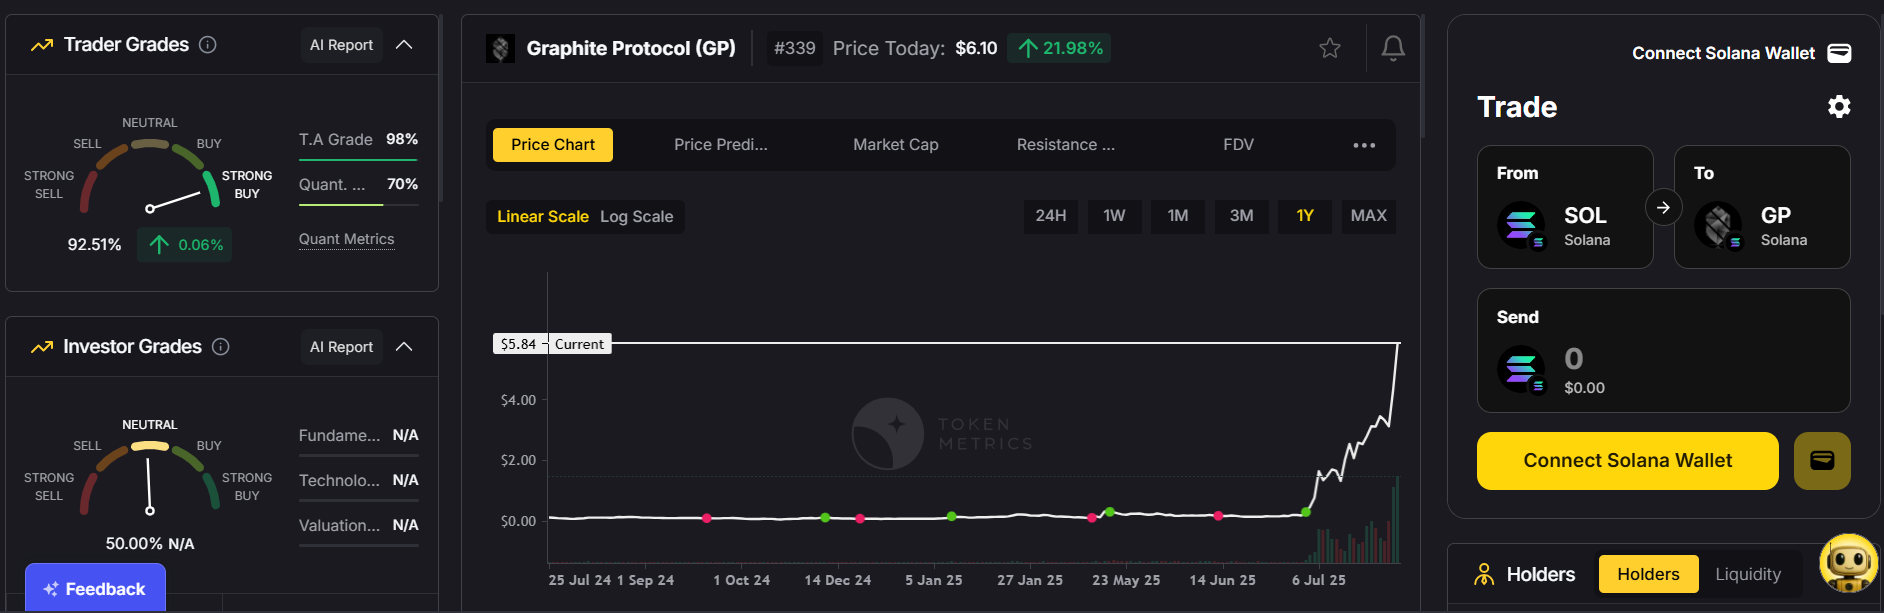
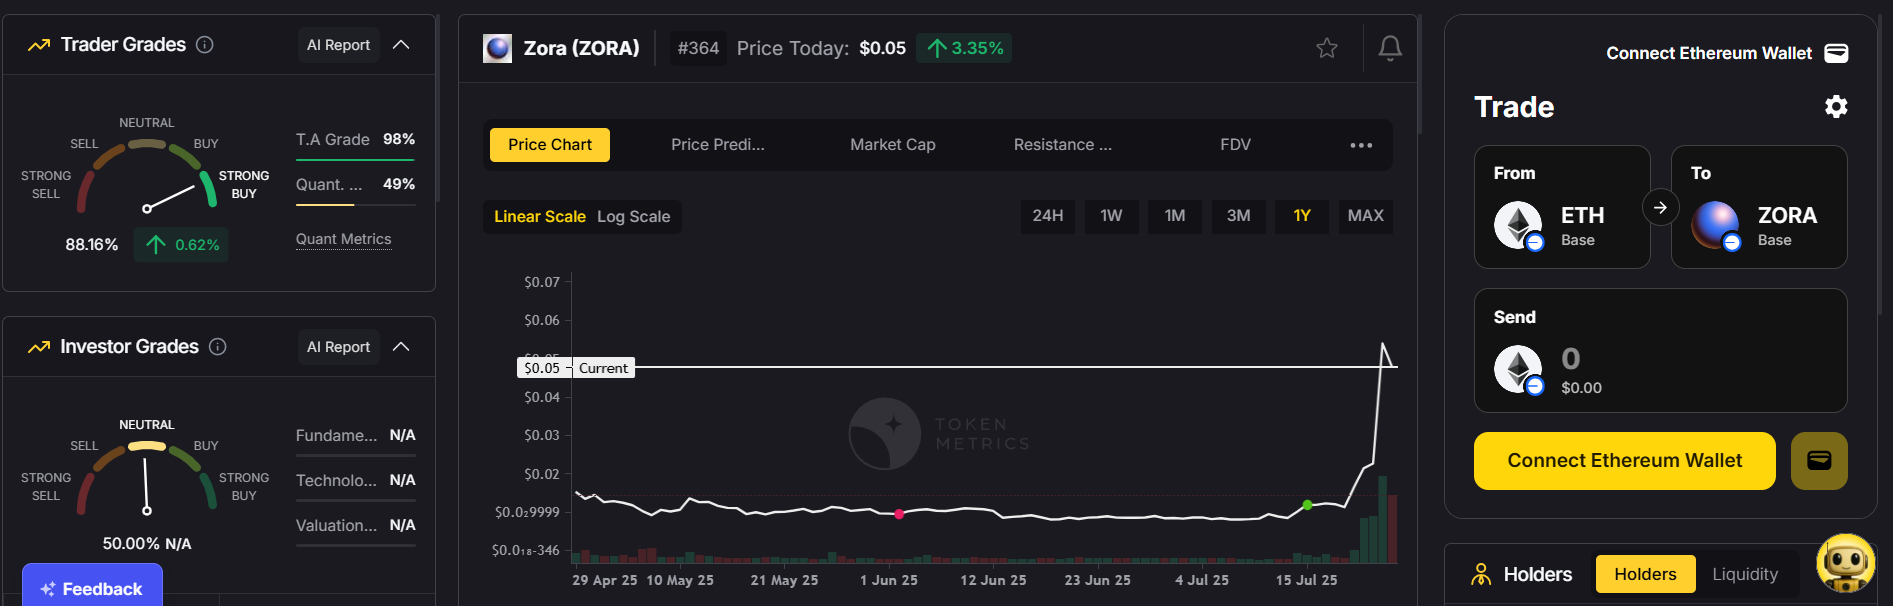
How Token Metrics Combines Indicators with AI

Instead of manually tracking dozens of indicators, Token Metrics uses AI to analyze 80+ technical, fundamental, and sentiment-based data points for each asset—giving you actionable insights without the guesswork.

Here’s how:

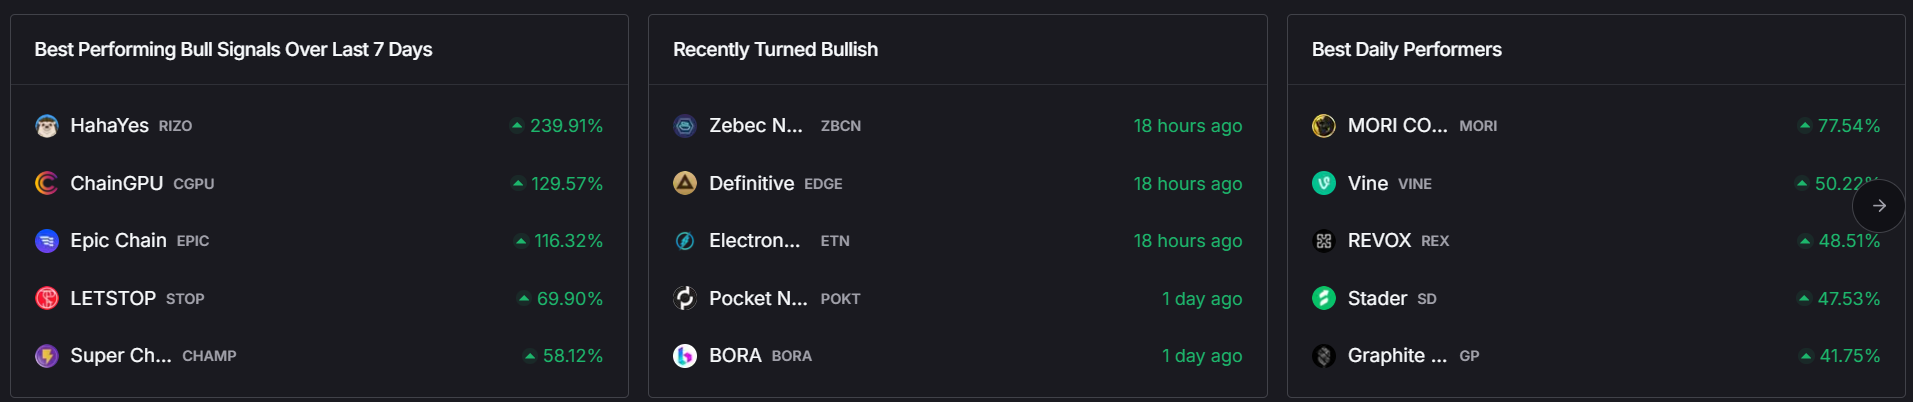
1. AI-Powered Bullish & Bearish Signals

Our system combines RSI, MACD, MAs, and more to generate real-time buy/sell signals.

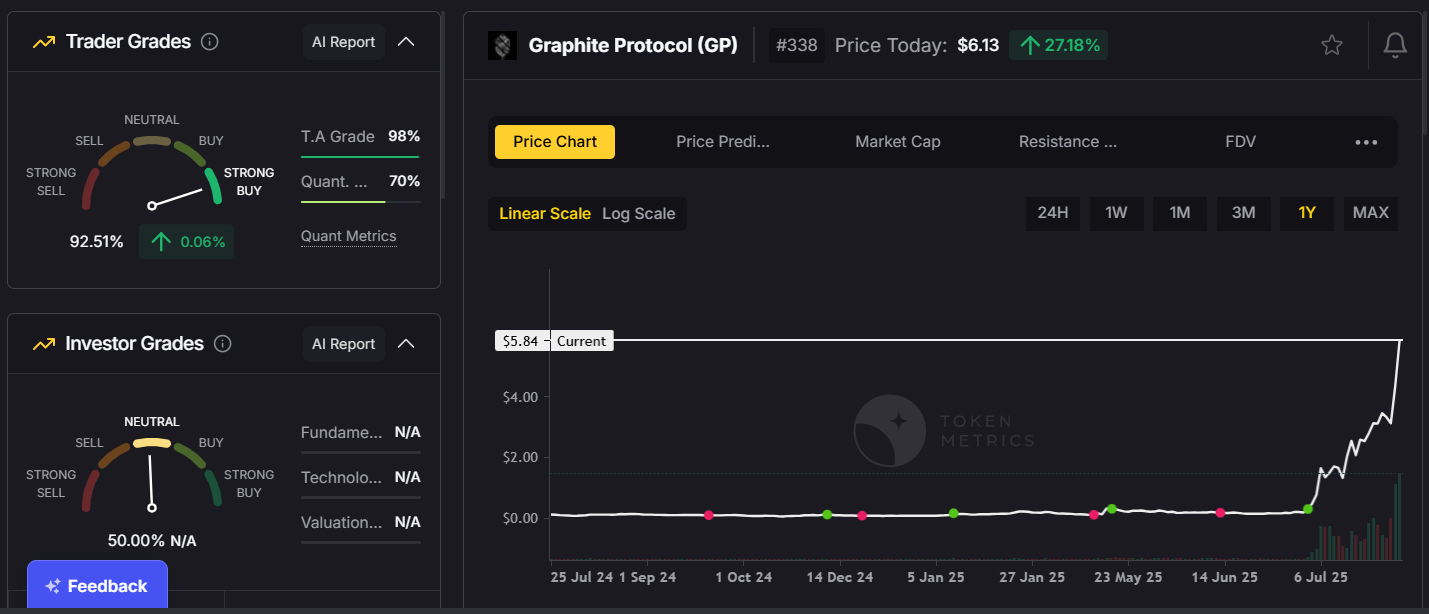
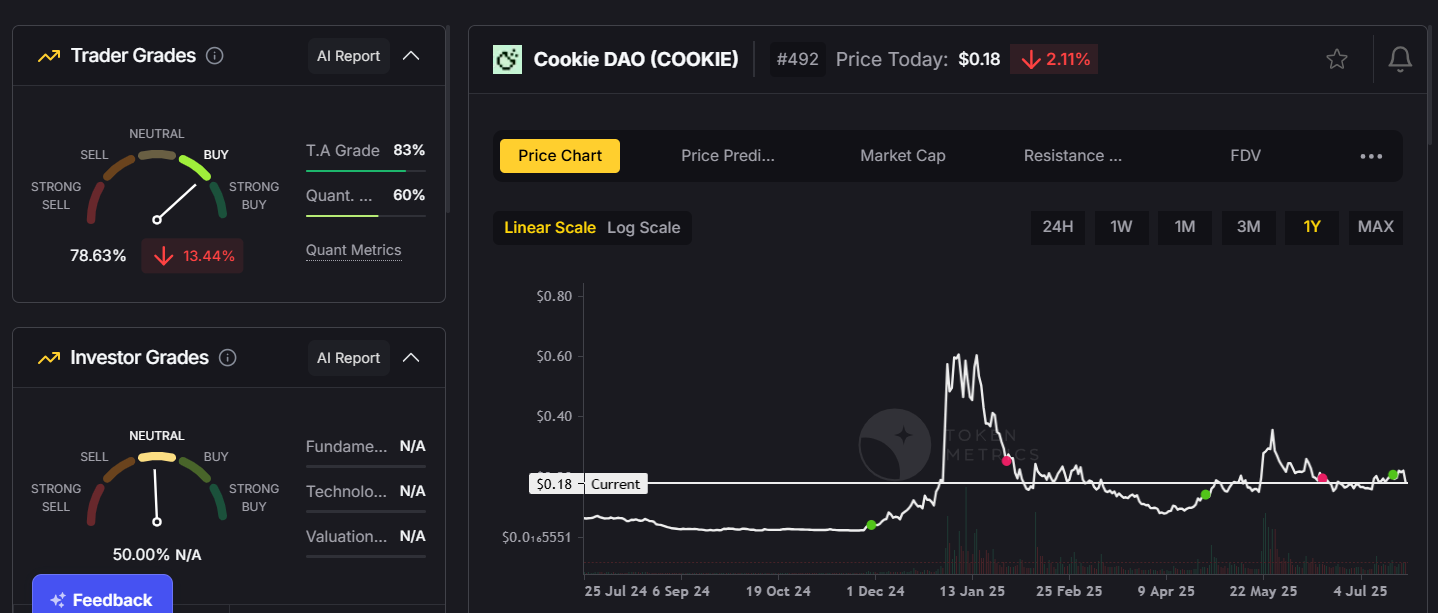
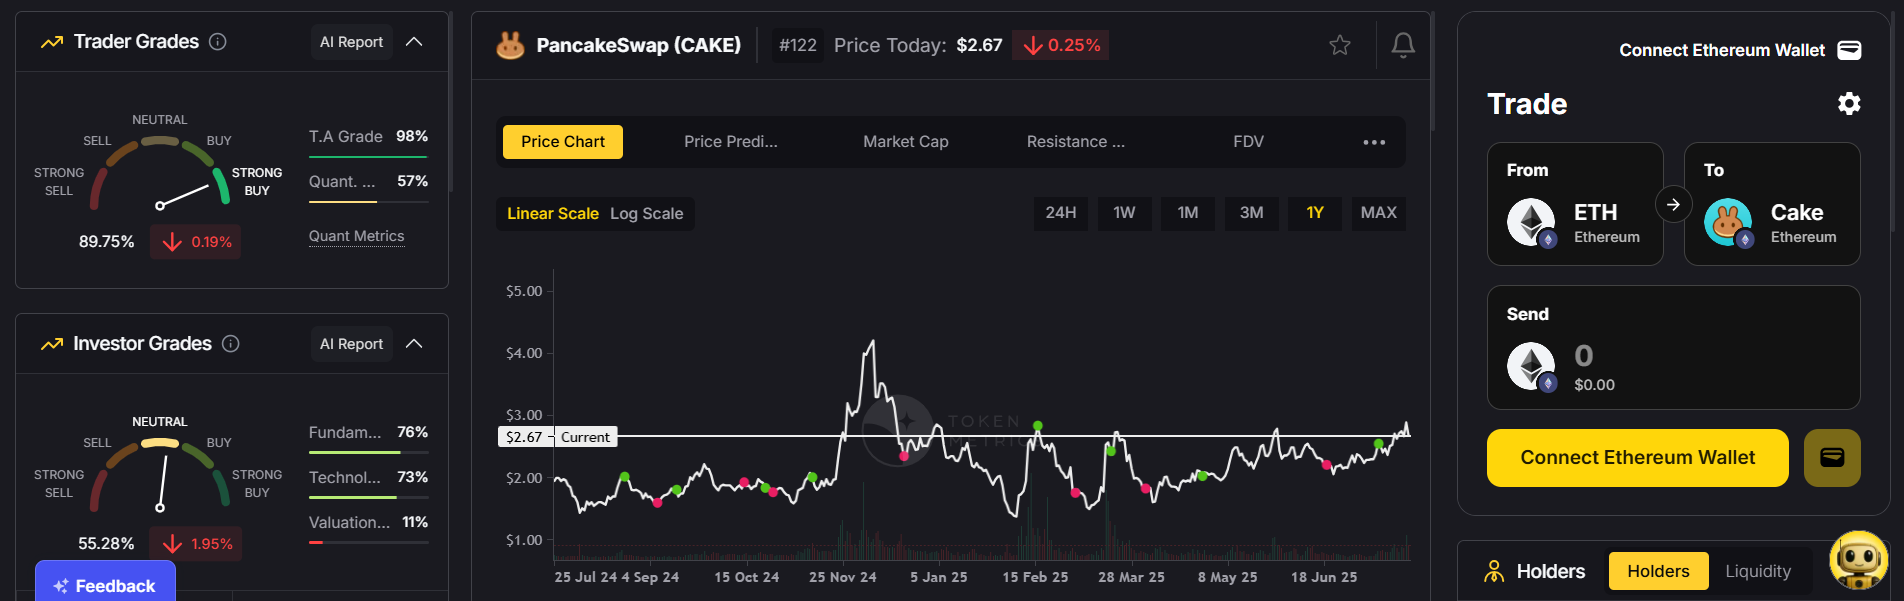
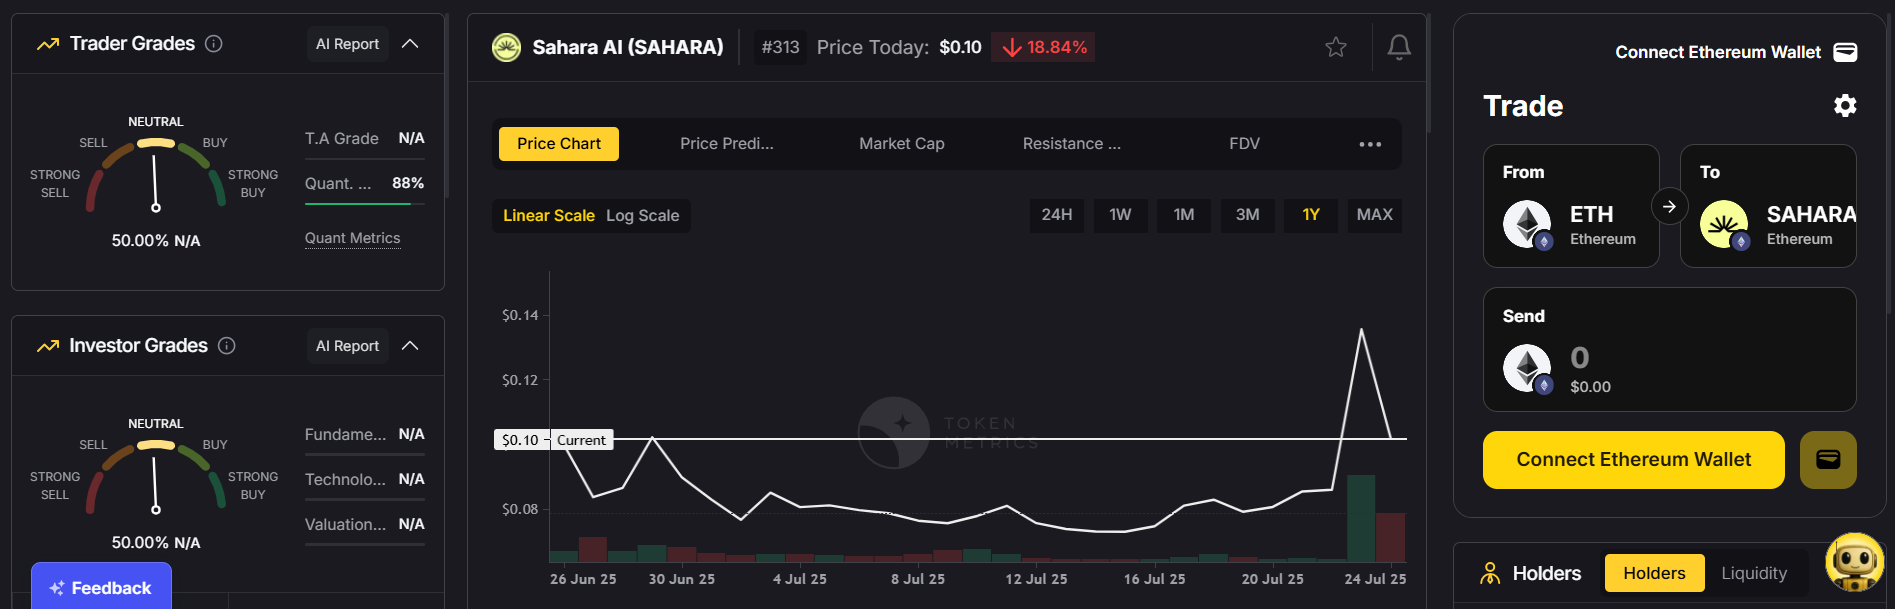
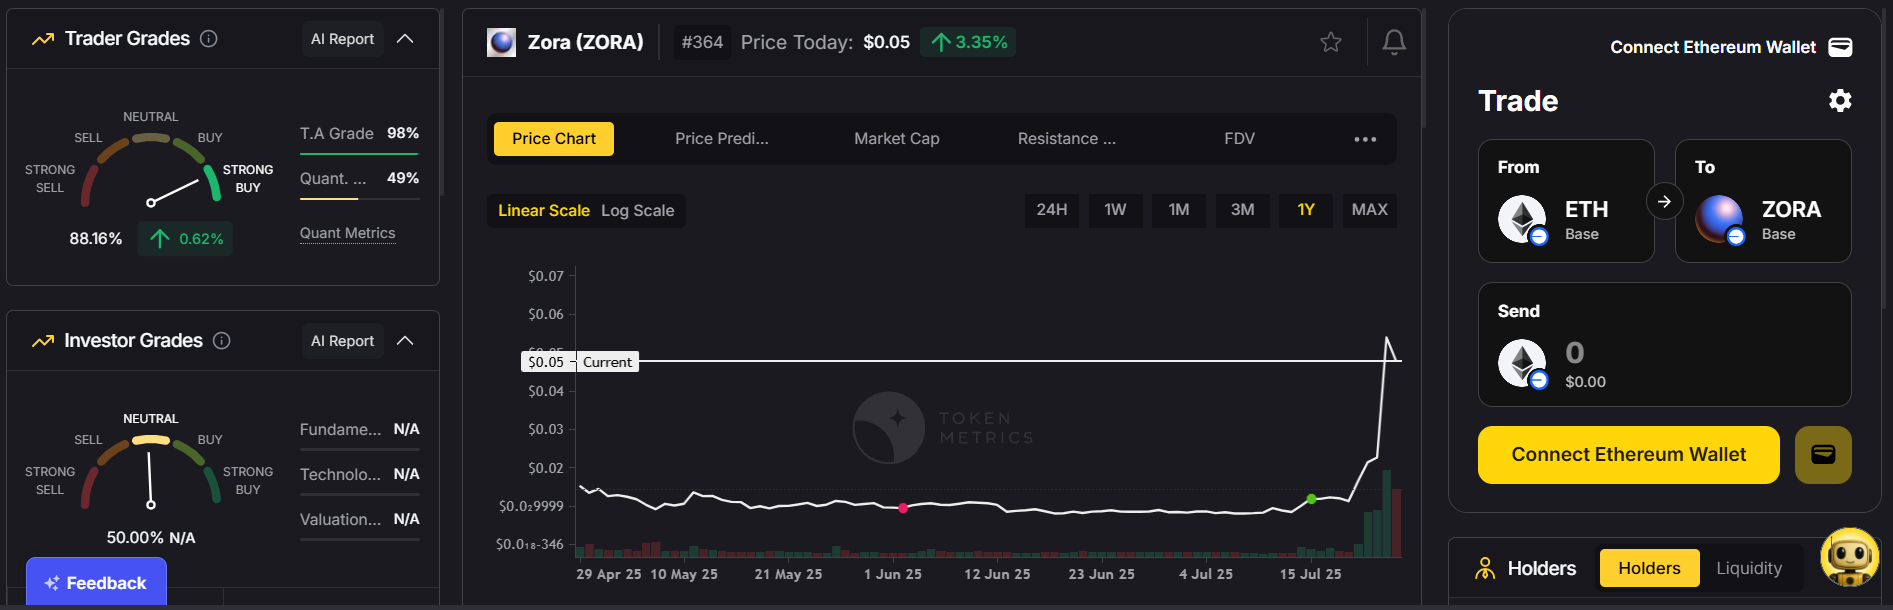
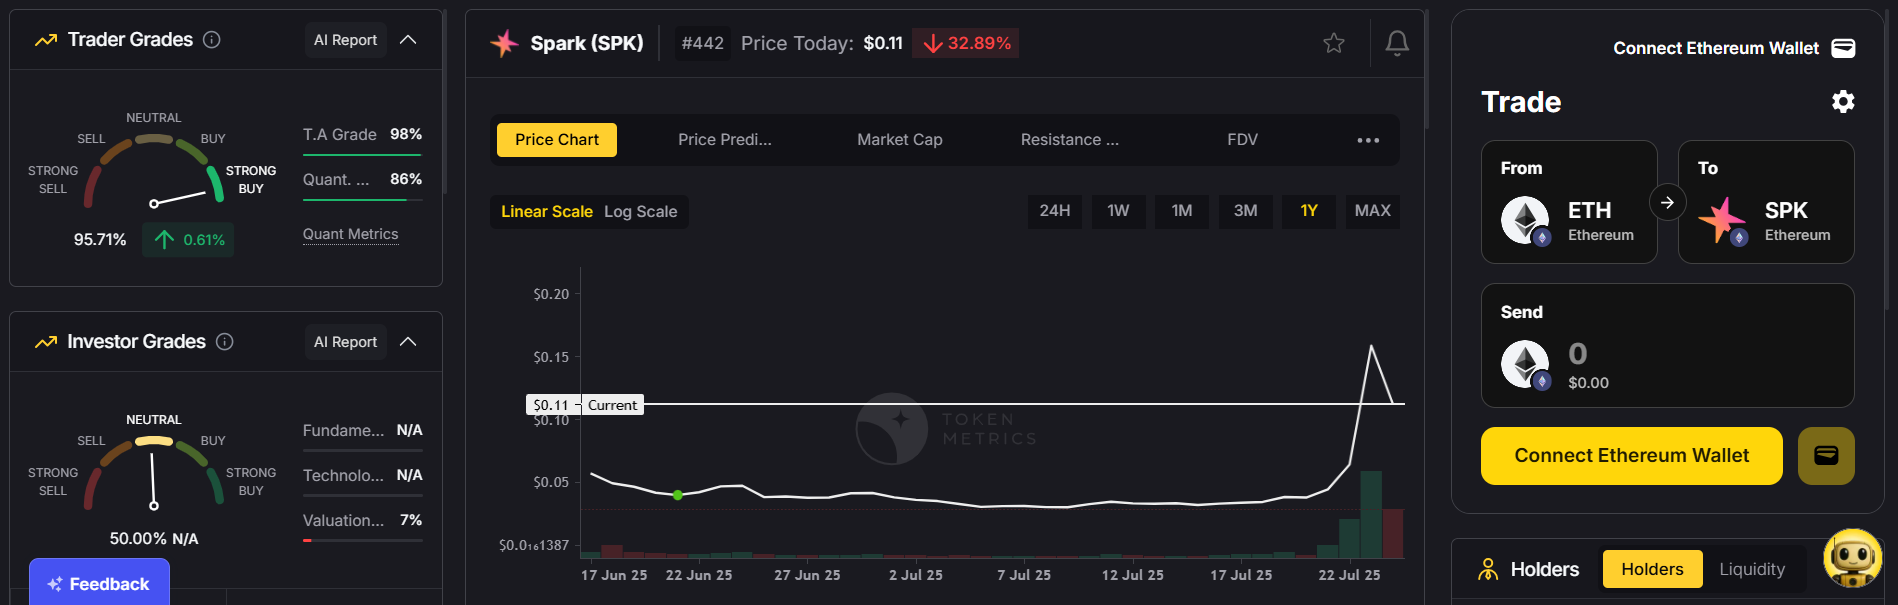
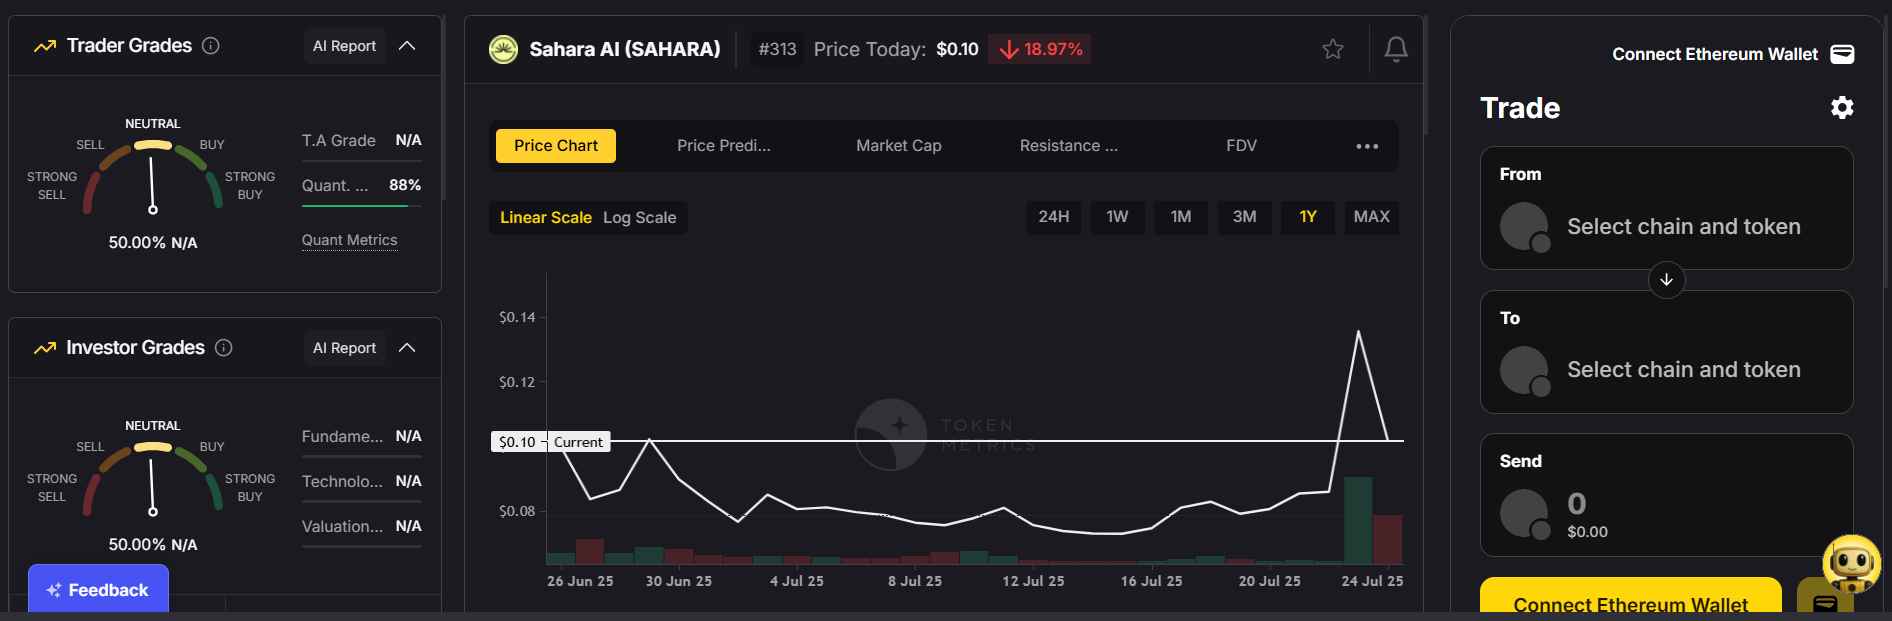
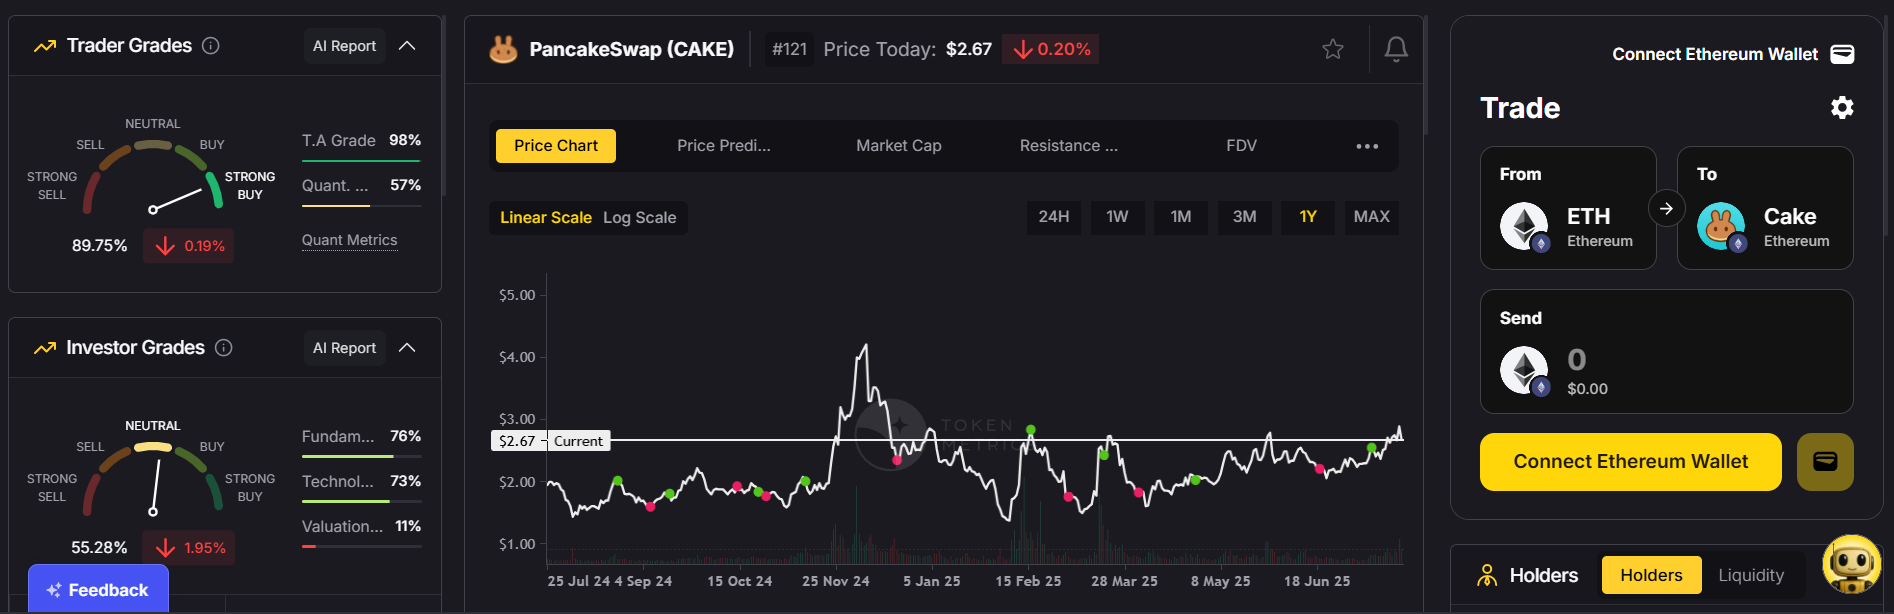
2. Trader & Investor Grades

  • Trader Grade: Helps short-term traders focus on cryptos with strong technical setups.

  • Investor Grade: Identifies long-term investment opportunities with strong fundamentals.

3. Narrative Detection

Token Metrics tracks emerging narratives (AI tokens, DeFi, etc.) so you can spot trends before they explode.

4. AI-Managed Indices

Don’t want to analyze charts? Our AI-driven indices automatically rebalance portfolios using technical indicators and market conditions.

How to Combine Indicators Effectively

The most successful traders don’t rely on one indicator. Instead, they combine them for confirmation.

Example:

  • Use RSI to spot oversold conditions.

  • Confirm with MACD bullish crossover.

  • Check volume to ensure strong buying pressure.

When multiple indicators align, your trade has a higher probability of success—and Token Metrics does this automatically.

Advanced Tips for Using Indicators

  1. Don’t Overload: Use 3–5 indicators for clarity.

  2. Adjust for Volatility: Crypto is more volatile than stocks—shorten timeframes for faster signals.

  3. Combine With Fundamentals: Use Token Metrics Investor Grades to pair TA with project fundamentals.

  4. Practice Risk Management: Even the best indicators fail—always use stop-loss orders.

Final Thoughts

So, what indicators should you use for technical analysis?

Start with moving averages, RSI, MACD, Bollinger Bands, and Fibonacci levels—then add volume indicators and advanced tools like the Ichimoku Cloud as you gain experience.

But here’s the truth: indicators are only as good as the trader using them. That’s why Token Metrics simplifies the process by combining dozens of technical indicators with AI-powered analysis, giving you clear, actionable insights for smarter trades.

Whether you’re a day trader or a long-term investor, Token Metrics helps you use technical indicators strategically—not emotionally.

Build Smarter Crypto Apps &
AI Agents in Minutes, Not Months
Real-time prices, trading signals, and on-chain insights all from one powerful API.
Grab a Free API Key
Token Metrics Team
Token Metrics Team

Recent Posts

Research

Moonshot Tokens in 2025: High-Risk, High-Reward Plays in the Crypto Market

Token Metrics Team
6 min
MIN

Introduction

The crypto market has always been fertile ground for high-risk, high-reward opportunities. While blue-chip assets like Bitcoin and Ethereum dominate headlines, the real thrill — and sometimes the highest returns — often comes from what the industry calls moonshots.”

These are small-cap tokens, often under $50 million in market cap, with explosive potential and equally high volatility. In 2025, moonshots remain a core part of speculative trading strategies. But what exactly are they? How do you find them? And most importantly, how can you manage the outsized risks they carry?

Let’s dive into the world of moonshots, drawing insights from recent market trends and real-world data.

What Are Moonshot Tokens?

Moonshot tokens are early-stage, low-cap cryptocurrencies that carry massive upside potential. They often represent experimental ideas or emerging narratives — think AI integration, meme culture, or social tokens — that haven’t yet been fully recognized by the broader market.

Because they trade at relatively low valuations, even small inflows of capital can cause outsized price swings. It’s not uncommon for a moonshot to deliver 10x or even 50x gains within a short time. But the flip side is brutal: these same tokens can plummet to zero just as quickly.

Key characteristics of moonshots:

  • Market cap: Typically under $50 million.
  • Narrative-driven: Often tied to strong trends like AI, gaming, or DeFi experiments.
  • Volatility: Sharp, frequent price swings.
  • Liquidity: Thin order books, making large trades difficult without impacting price.

Why Are Moonshots Gaining Traction in 2025?

The current market environment — with crypto market capitalization hovering around $4 trillion — has created room for risk-taking. Investors who missed early gains on Bitcoin or Ethereum are now searching for the next big thing, leading to renewed interest in small-cap tokens.

Emerging narratives also fuel the fire:

  • AI-Crypto Fusion: Projects like Sahara AI and Mobi AI are proving that the AI narrative isn’t slowing down.
  • Social Tokens & Web3 Platforms: Zora’s creator-focused token model demonstrates how social media and crypto can intersect.
  • Community-First DeFi: Protocols like Blackhole DEX show the power of grassroots tokenomics.

These narratives often spill over into the moonshot arena, as smaller projects attempt to replicate the success of these headline-grabbing platforms.

How to Identify Promising Moonshots

Identifying moonshots is part research, part intuition, and part risk tolerance. Here’s what to look for:

1. Strong Narrative Alignment

The most successful moonshots ride on current narratives. In this cycle, AI agents, decentralized social platforms, and community-owned DeFi projects are leading themes. Projects in these categories often experience rapid hype-driven adoption.

2. On-Chain Data

Tools like Dune Analytics and on-chain scanners can reveal whale accumulation, new liquidity pools, or spikes in active addresses — all early indicators of growing interest.

3. Tokenomics

Evaluate supply schedules:

  • How many tokens are in circulation?
  • Are there large unlocks coming soon?
  • Does the project have mechanisms like buybacks or burns to support price stability?

4. Developer & Investor Backing

While many moonshots are grassroots projects, strong teams or backing from reputable funds (e.g., Polychain, Binance Labs) can boost credibility.

Case Studies: Recent Moonshots to Watch

1. Vine (Meme Token):
A meme coin leveraging the Vine brand, this token has gained traction despite limited documentation. Its appeal lies largely in nostalgia and speculative hype.

2. Moby AI: What started as an AI-driven whale-tracking agent has evolved into Mobi Screener, a Dexscreener competitor with integrated social features. The token model ties platform usage to token value — a promising experiment in utility-driven moonshots.

3. Graphite Protocol:
Developers behind Bonk Fun (a leading meme token platform), Graphite has created a buyback and burn model linked to Bonk’s success, aligning token value directly with ecosystem growth.

4. CookieDAO:
Initially positioned as an AI agent platform, CookieDAO is now expanding into proof-of-belief systems, adding new utilities and campaign features for Web3 projects.

The Risk Side: Why Moonshots Can Go to Zero

Moonshots are inherently speculative. Common pitfalls include:

  • Team Abandonment or Rug Pulls: Some projects vanish overnight.
  • Unsustainable Hype: Many moonshots rely on short-term narratives that fade.
  • Low Liquidity: Thin markets make it difficult to enter or exit without significant slippage.

A recent example is SpaceMesh, once hyped as a “next Bitcoin.” Despite strong tech, internal disputes and poor execution led to a near-total collapse — a stark reminder that good code doesn’t always equal good investment.

Managing Risk: A Practical Approach

If you’re trading moonshots, risk management is everything.

1. Position Sizing:
Never allocate more than 1% of your portfolio to any single moonshot. Spreading capital across multiple small positions reduces the impact of one token collapsing.

2. Diversification:
Balance moonshots with higher-cap tokens to stabilize overall portfolio performance.

3. Predefined Exits:
Set clear take-profit and stop-loss levels before entering a trade. Emotional decisions often lead to losses.

4. Time Your Entries:
Consider entering after initial hype cools but before major announcements or roadmap milestones.

The Future of Moonshots: Are They Worth It?

While moonshots can be risky, they remain an integral part of crypto’s DNA. For many traders, they serve as lottery tickets in a market where early discovery can lead to life-changing gains.

In 2025, moonshots are evolving. They’re no longer just meme-driven gambles. Increasingly, they represent experimental innovation — blending DeFi models, AI integrations, and community governance in ways that push the boundaries of blockchain technology.

Conclusion

Moonshots are not for the faint-hearted. They require research, timing, and above all, discipline. In 2025, with themes like AI-driven platforms, decentralized social networks, and community-focused DeFi reshaping the market, the next breakout token could be hiding in plain sight.

Whether you’re a seasoned trader or a curious newcomer, understanding the dynamics of moonshots — and respecting their risks — is essential for navigating this volatile but potentially rewarding segment of crypto.

Research

DeFi and AI Tokens Dominate as Crypto Market Nears $4 Trillion

Token Metrics Team
6 min
MIN

The cryptocurrency market continues to show resilience, with total market capitalization maintaining a strong foothold near $4 trillion. While Bitcoin remains the cornerstone of this cycle, the spotlight is shifting toward altcoins — especially those at the forefront of decentralized finance (DeFi) and artificial intelligence (AI) integration.

In this blog, we’ll explore the top narratives shaping today’s market, focusing on DeFi protocols like Blackhole DEX and PancakeSwap, alongside emerging AI projects such as Sahara AI and Moby AI.

Why DeFi Is Surging Again

DeFi has staged an impressive comeback in 2025. After a period of stagnation, several protocols have redefined their models to prioritize community engagement and sustainable growth.

Black Hole DEX:
Launched on Avalanche, Blackhole DEX has quickly become the network’s largest decentralized exchange, overtaking Trader Joe. The platform uses a community-first approach: no team allocation, weekly token emissions to liquidity providers, and a bribe-based voting mechanism for rewards distribution.

Impact:
This design has created a powerful flywheel effect. As token prices rise, APYs increase, attracting more liquidity, which in turn boosts trading volume and revenue. Within days, Blackhole DEX grew its TVL from $7 million to $193 million — a staggering feat.

PancakeSwap: A Sleeping Giant?

PancakeSwap, the dominant DEX on Binance Smart Chain (BSC), has been quietly outperforming its competitors in trading volumes and fee generation. Recent data shows PancakeSwap generating more than 4x the daily fees of Uniswap, yet its fully diluted valuation remains significantly lower.

Growth Catalysts:

  • Integration with the Binance Wallet ecosystem.
  • Expansion into other ecosystems like Solana.
  • All-time-high trading volumes despite broader market corrections.

For investors seeking a large-cap DeFi protocol with strong fundamentals and potential upside, PancakeSwap’s metrics warrant attention.

AI Meets Crypto: The Next Frontier

Artificial intelligence continues to transform multiple industries, and crypto is no exception.

Sahara AI:
Sahara AI is building a full-stack AI infrastructure for decentralized applications. Backed by heavyweights like Binance and Polychain, its mission is to bridge Web3 and AI — a theme that’s likely to dominate innovation cycles in the coming years.

Moby AI:
Initially launched as an AI trading agent, Moby AI has expanded into building tools like Moby Screener, a competitor to Dexscreener. Its unique tokenomics link user engagement directly to the platform’s utility, making it an experiment worth watching.

The Broader Altcoin Landscape

Beyond DeFi and AI, other notable projects are also gaining ground:

  • Graphite Protocol: The developer behind LetsBonk.Fun, sharing revenue with its ecosystem tokens through buyback strategies.


  • Zora: A social media-meets-crypto platform allowing creators to monetize their content directly on-chain.


  • Project X: A cross-chain DEX on Hyperliquid, amassing $28 million in TVL within 24 hours of launch.

These projects underscore the diversity of innovation happening outside Bitcoin’s shadow.

Risk Management in a Volatile Market

The excitement around DeFi and AI tokens comes with elevated risk. Here are some best practices:

  • Allocate wisely: Keep high-risk allocations (like low-cap “moonshots”) small — no more than 1% per trade.
  • Monitor narratives: Rapid shifts in market sentiment can create both opportunities and pitfalls.
  • Stay updated: Protocol changes, tokenomics adjustments, and ecosystem partnerships can significantly impact valuations.

Conclusion

As the crypto market edges closer to $4 trillion, the narratives driving growth are evolving. DeFi is proving its staying power with innovative models like Black Hole DEX, while AI-focused projects like Sahara AI are pushing the boundaries of what blockchain can achieve.

For market participants, the challenge lies in identifying which of these trends have lasting potential — and positioning themselves accordingly.

Research

Altcoins on the Rise: How Bitcoin’s Stability Is Fueling the Next Market Wave

Token Metrics Team
6 min
MIN

As Bitcoin stabilizes near its recent highs, the crypto market is witnessing a familiar pattern — altcoins are beginning to surge. While Bitcoin often leads during the early phases of a bullish cycle, history shows that capital tends to flow into altcoins as confidence builds. In the past two weeks, this transition has become increasingly evident, with several promising projects capturing significant market attention.

Bitcoin’s Stabilization and What It Means

Since early July, Bitcoin has managed to hold above key resistance levels, cementing its role as the market’s anchor. At the time of writing, total crypto market capitalization hovers near $4 trillion — a level that hasn’t been seen since the previous cycle’s peaks. Historically, when Bitcoin consolidates above its former highs, capital begins rotating into altcoins. This shift often marks the start of a broader rally across the market.

Key takeaway: The current market appears to be in the early stages of this altcoin rotation.

Altcoins Leading the Charge

Several altcoins have emerged as strong contenders in recent weeks.

1. Zora: The Social Token Platform
Zora, an on-chain social platform that allows creators to tokenize posts and earn from their content, has seen exponential growth following its integration into the Base App (Coinbase’s rebranded wallet). Creator activity and transaction volumes have surged, driving up demand for the Zora token. With each creator post paired to the Zora token, this integration has created a direct link between platform usage and token utility.

Why it matters: The combination of Web3 social media and creator monetization is a powerful narrative, and Zora appears well-positioned to capitalize on this trend.

2. Spark: A MakerDAO-Connected Lending Platform
Spark, a DeFi lending protocol linked to Sky Protocol, has also been a standout performer. It recently experienced a sharp increase in liquidity and price action, fueled by its integration with CookieDAO’s campaign and ongoing airdrop programs.

Why it matters: With DeFi gaining renewed interest, protocols offering sustainable yields through established ecosystems like Sky Protocol (formerly MakerDAO) are likely to remain attractive to both retail and institutional participants.

3. Sahara AI: Building the AI-Crypto Intersection
Sahara AI has positioned itself at the intersection of AI and blockchain. Backed by Binance, Polychain, and Foresight Ventures, this project offers a full-stack AI solution tailored for decentralized applications. Its long-term vision of creating AI-enabled Web3 services is attracting both developers and investors.

Why it matters: AI and crypto remain two of the most dominant narratives in tech, and projects combining these sectors could drive the next wave of innovation.

4. PancakeSwap: Undervalued Giant?
Despite being one of the largest DEXs by trading volume and daily fee generation, PancakeSwap appears significantly undervalued compared to peers like Uniswap. The platform recently expanded its operations to other chains, including Solana, and benefits from strong integration with the Binance Wallet ecosystem.

Why it matters: Fundamentals suggest PancakeSwap has room for growth if the market re-rates its value relative to competitors.

Market Themes to Watch

Bitcoin vs. Altcoin Season:
Our analysis shows we are still in a Bitcoin-dominant phase. Historically, altcoins outperform when Bitcoin consolidates or cools off. This implies that the current rotation into altcoins could continue as capital flows down the risk curve.

DeFi Revival:
Protocols like Blackhole DEX on Avalanche — which has grown its TVL from $7 million to $193 million in less than 2 weeks — highlight a renewed interest in decentralized finance. Unlike VC-backed models, Blackhole’s community-first tokenomics have resonated with users seeking fairer distribution.

Social Tokens & AI Integration:
Platforms like Zora and Sahara AI are tapping into major growth narratives: decentralized social media and artificial intelligence. Both sectors are likely to see continued experimentation and adoption.

Managing Risk in Altcoin Investing

While the upside potential in altcoins is high, so is the volatility. For high-risk trades, such as “moonshots” (low-cap tokens under $50 million market cap), we recommend:

  • Position sizing: Limit exposure to 1% per trade.
  • Diversification: Spread investments across multiple projects to reduce single-token risk.
  • Exit planning: Pre-define take-profit and stop-loss levels.

Conclusion

The crypto market is entering an exciting phase. Bitcoin’s consolidation above key levels suggests a healthy backdrop for risk assets, and altcoins are beginning to benefit. From creator monetization platforms like Zora to cross-chain DeFi protocols like Spark and Black Hole, this new wave of projects represents the diversity and innovation driving the next cycle.

As always, measured participation and disciplined risk management remain essential.

Choose from Platinum, Gold, and Silver packages
Reach with 25–30% open rates and 0.5–1% CTR
Craft your own custom ad—from banners to tailored copy
Perfect for Crypto Exchanges, SaaS Tools, DeFi, and AI Products