Back to blog
Crypto Basics

What Is a Bitcoin ETF? A Beginner’s Guide to Understanding Bitcoin Exchange-Traded Funds in 2025

Learn what a Bitcoin ETF is, how it works, and why it matters for investors in 2025. Discover the benefits, risks, and how Token Metrics helps you analyze Bitcoin ETFs with AI.
Token Metrics Team
8 min
Want Smarter Crypto Picks—Free?
See unbiased Token Metrics Ratings for BTC, ETH, and top alts.
Thank you! Your submission has been received!
Oops! Something went wrong while submitting the form.
 No credit card | 1-click unsubscribe

The cryptocurrency world continues to evolve rapidly, and one of the most significant milestones in recent years has been the approval and rise of Bitcoin ETFs. If you’ve ever wondered, “What is a Bitcoin ETF and why is it important?” — this guide breaks it down in simple terms.

In this highly informative blog, we’ll explore:

  • What a Bitcoin ETF is
  • Types of Bitcoin ETFs
  • Benefits and risks
  • Why Bitcoin ETFs matter for crypto adoption
  • How to analyze Bitcoin ETFs using Token Metrics tools

📈 What Is a Bitcoin ETF?

A Bitcoin ETF (Exchange-Traded Fund) is a financial product that allows investors to gain exposure to the price movements of Bitcoin without having to own or manage actual Bitcoin.

Just like buying a stock, investors can purchase shares of a Bitcoin ETF through traditional brokerage accounts. These shares represent ownership in a fund that tracks the price of Bitcoin.

In essence, a Bitcoin ETF bridges the gap between traditional finance and crypto investing.

🔄 How Does a Bitcoin ETF Work?

Bitcoin ETFs are created and managed by large financial institutions or asset managers. These funds:

  1. Buy Bitcoin directly (in spot ETFs), or
  2. Invest in Bitcoin futures contracts (in futures ETFs)
  3. Issue ETF shares that track the price performance of Bitcoin

These shares are then listed on stock exchanges like the NYSE, Nasdaq, or CBOE, where they can be bought or sold just like regular stocks.

🔍 Types of Bitcoin ETFs

There are two main types of Bitcoin ETFs:

1. Spot Bitcoin ETFs

  • Hold actual Bitcoin in custody
  • Track the real-time market price of Bitcoin
  • Provide direct exposure to Bitcoin’s price
  • Approved in the U.S. starting in early 2024 (e.g., BlackRock’s iShares Bitcoin Trust)

2. Futures-Based Bitcoin ETFs

  • Track Bitcoin futures contracts (derivatives)
  • Do not hold actual Bitcoin
  • Subject to contango and tracking errors
  • Were the first type approved (e.g., ProShares BITO)

In 2025, spot ETFs are considered superior due to their more accurate and direct exposure.

✅ Benefits of Bitcoin ETFs

Bitcoin ETFs offer several key advantages:

1. Accessibility

Investors can buy Bitcoin exposure through traditional brokerage platforms like Fidelity, Schwab, or Robinhood—no need for crypto wallets or private keys.

2. Regulation and Security

ETFs are regulated by institutions like the SEC and are managed by trusted financial firms, offering greater transparency and investor protection.

3. Tax Efficiency

Buying and selling ETFs may provide more favorable tax treatment compared to transacting in physical Bitcoin directly.

4. Institutional Adoption

Bitcoin ETFs enable pension funds, hedge funds, and banks to legally and easily gain exposure to BTC. Inflows from these entities have driven billions into Bitcoin in 2024 and 2025.

⚠️ Risks of Bitcoin ETFs

Despite their benefits, Bitcoin ETFs come with a few risks:

1. Price Tracking Errors

Futures ETFs may deviate from Bitcoin’s spot price due to volatility and contract rollover costs.

2. Management Fees

ETF providers charge an annual fee (0.20%–1.00%), which can reduce long-term returns.

3. Lack of Custody Control

You don’t actually own Bitcoin when you hold an ETF—so you can’t transfer it or use it for DeFi or crypto payments.

4. Market Volatility

Bitcoin remains a highly volatile asset. ETF shares may still experience massive price swings.

🏛️ Why Bitcoin ETFs Matter in 2025

The approval and adoption of Bitcoin ETFs mark a turning point in mainstream crypto acceptance. Here’s why:

  • Over $60 billion has flowed into U.S.-listed Bitcoin ETFs since January 2024
  • Institutions like BlackRock, Fidelity, and ARK Invest now actively manage Bitcoin exposure
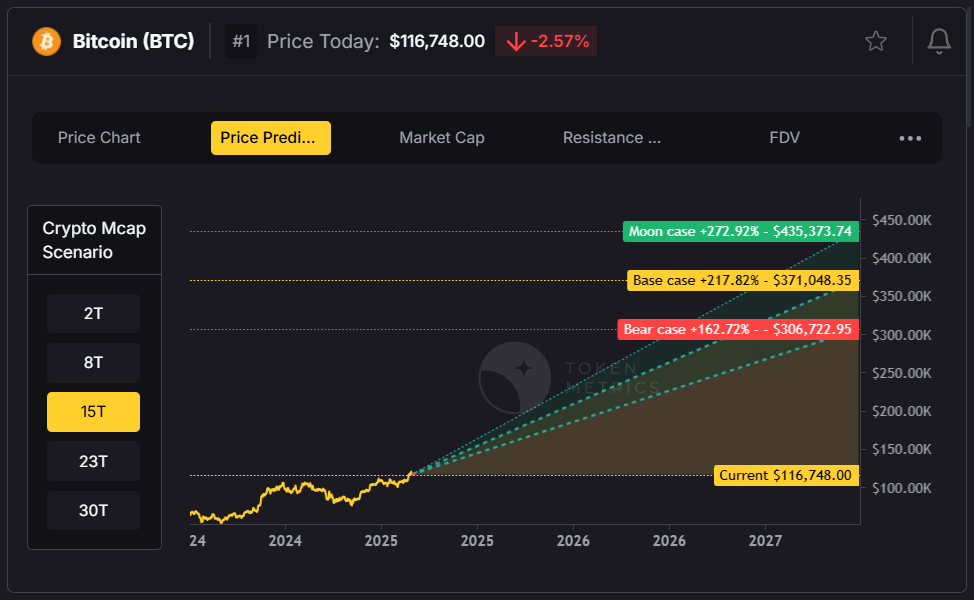
  • Bitcoin ETF holdings reduce circulating supply, contributing to BTC’s price surge past $118,000 in mid-2025
  • Countries outside the U.S., including Canada and Hong Kong, are expanding their Bitcoin ETF offerings

🤖 How Token Metrics Helps You Analyze Bitcoin ETFs

While traditional investors focus on ETF tickers, smart crypto investors turn to platforms like Token Metrics to get deeper insights.

🔹 AI-Powered Bitcoin Forecasts

Token Metrics uses machine learning to predict short- and long-term Bitcoin price trends. As of June 28, the AI turned bullish, signaling BTC's breakout past $110,000.

🔹 Exchange Reserve Monitoring

The platform tracks Bitcoin’s exchange reserves, showing a drop from 3.25M to 2.55M BTC—a bullish signal due to reduced sell-side pressure.

🔹 ETF Flow Analysis

Token Metrics integrates on-chain data and fund inflows to measure:

  • How much BTC ETFs are buying
  • Impact on liquidity and price
  • Sentiment shifts among institutional investors

🔹 Alerts and Grades

You can set up custom price alerts for Bitcoin and receive Trader and Investor Grades based on 80+ real-time metrics.

These tools allow you to react faster than ETF investors relying on traditional media or quarterly reports.

📈 Bitcoin ETF Performance So Far

As of July 2025:

  • BlackRock’s iShares Bitcoin Trust (IBIT) holds over $18B in BTC
  • Fidelity’s ETF surpassed $12B in AUM
  • ETF buying pressure is one of the main drivers behind Bitcoin’s 2025 bull run

💡 Pro Tips Before Investing in a Bitcoin ETF

  1. Compare fees across ETFs (lower = better for long-term holdings)
  2. Choose spot ETFs over futures ETFs for more accurate performance
  3. Use Token Metrics to track BTC signals and time your entry
  4. Understand your goals—ETFs are great for passive exposure but not for on-chain crypto utility

🧠 Final Thoughts

A Bitcoin ETF is one of the easiest ways to gain exposure to Bitcoin in 2025. Whether you’re a traditional investor looking to diversify or a crypto-native looking for a regulated option, ETFs offer accessibility, safety, and legitimacy.

But don’t stop at just buying shares—pair your ETF exposure with real-time intelligence from Token Metrics.

With institutional momentum accelerating, regulatory clarity improving, and AI tools like Token Metrics giving you an edge, there’s never been a better time to understand and invest in Bitcoin ETFs.

Build Smarter Crypto Apps &
AI Agents in Minutes, Not Months
Real-time prices, trading signals, and on-chain insights all from one powerful API.
Grab a Free API Key
About Token Metrics
Token Metrics: AI-powered crypto research and ratings platform. We help investors make smarter decisions with unbiased Token Metrics Ratings, on-chain analytics, and editor-curated “Top 10” guides. Our platform distills thousands of data points into clear scores, trends, and alerts you can act on.
30 Employees
analysts, data scientists, and crypto engineers
30 Employees
analysts, data scientists, and crypto engineers
30 Employees
analysts, data scientists, and crypto engineers
Want Smarter Crypto Picks—Free?
See unbiased Token Metrics Ratings for BTC, ETH, and top alts.
Thank you! Your submission has been received!
Oops! Something went wrong while submitting the form.
 No credit card | 1-click unsubscribe
Token Metrics Team
Token Metrics Team

Recent Posts

Research

Cronos Long-Term Price Prediction: 2027 Targets & Token Metrics Analysis

Token Metrics Team
9 min read

Portfolio Context for Cronos: Diversification in the 2027 Landscape

Layer 1 tokens like Cronos represent bets on specific blockchain architectures winning developer and user mindshare. CRO carries both systematic crypto risk and unsystematic risk from Cronos's technical roadmap execution and ecosystem growth. Multi-chain thesis suggests diversifying across several L1s rather than concentrating in one, since predicting which chains will dominate remains difficult.

The projections below show how CRO might perform under different market cap scenarios. While Cronos may have strong fundamentals, prudent portfolio construction balances L1 exposure across Ethereum, competing smart contract platforms, and Bitcoin to capture the sector without overexposure to any single chain's fate.


Disclosure

Educational purposes only, not financial advice. Crypto is volatile, do your own research and manage risk.

How to read it: Each band blends cycle analogues and market-cap share math with TA guardrails. Base assumes steady adoption and neutral or positive macro. Moon layers in a liquidity boom. Bear assumes muted flows and tighter liquidity.

TM Agent baseline: Token Metrics scenarios center roughly between $0.03 and $0.28, with a base case near $0.10, assuming steady ecosystem growth, continued cross-chain demand, and no major security incidents.

Live details: Token Details 

The Case for Diversified Index Exposure

Portfolio theory teaches that diversification is the only free lunch in investing. CRO concentration violates this principle by tying your crypto returns to one protocol's fate. Token Metrics Indices blend Cronos with the top one hundred tokens, providing broad exposure to crypto's growth while smoothing volatility through cross-asset diversification. This approach captures market-wide tailwinds without overweighting any single point of failure.

Systematic rebalancing within index strategies creates an additional return source that concentrated positions lack. As some tokens outperform and others lag, regular rebalancing mechanically sells winners and buys laggards, exploiting mean reversion and volatility. Single-token holders miss this rebalancing alpha and often watch concentrated gains evaporate during corrections while index strategies preserve more gains through automated profit-taking.

Beyond returns, diversified indices improve the investor experience by reducing emotional decision-making. Concentrated CRO positions subject you to severe drawdowns that trigger panic selling at bottoms. Indices smooth the ride through natural diversification, making it easier to maintain exposure through full market cycles.

Get early access

What Is Cronos?

Cronos is an EVM-compatible blockchain built to support decentralized applications with high throughput and low transaction costs. The network is designed to bridge the gap between crypto and traditional finance, offering interoperability with Ethereum and Cosmos ecosystems. Its focus on scalability and developer-friendly infrastructure aims to attract DeFi, NFT, and gaming projects.

CRO serves as the native utility token of the Cronos ecosystem, used for transaction fees, staking, and governance. It enables users to participate in network security, pay for smart contract execution, and access services within the Cronos DeFi ecosystem. Common usage patterns include staking for rewards, providing liquidity in DeFi protocols, and facilitating cross-chain transfers.

Key Takeaways

  • Scenario driven, outcomes hinge on total crypto market cap, higher liquidity and adoption lift the bands.
  • Single-asset concentration amplifies both upside and downside versus diversified approaches.
  • Fundamentals: Fundamental Grade 72.71% (Community 55%, Tokenomics 60%, Exchange 100%, VC N/A, DeFi Scanner 83%).
  • Technology: Technology Grade 81.41% (Activity 64%, Repository 74%, Collaboration 82%, Security N/A, DeFi Scanner 83%).
  • TM Agent gist: Base near $0.10 amid steady growth.
  • Education only, not financial advice.

Scenario Analysis

At an 8 trillion dollar total crypto market cap, CRO projects to $0.14 in bear conditions, $0.29 in the base case, and $0.34 in bullish scenarios.  

Doubling the market to 16 trillion expands the range to $0.43 (bear), $0.57 (base), and $0.71 (moon).  

At 23 trillion, the scenarios show $0.62, $0.85, and $1.09 respectively.  

In the maximum liquidity scenario of 31 trillion, CRO could reach $0.81 (bear), $1.13 (base), or $1.46 (moon).  

These ranges illustrate potential outcomes for concentrated CRO positions, but investors should weigh whether single-asset exposure matches their risk tolerance or whether diversified strategies better suit their objectives.

Fundamental and Technology Snapshot from Token Metrics

Fundamental Grade: 72.71% (Community 55%, Tokenomics 60%, Exchange 100%, VC N/A, DeFi Scanner 83%).  

Technology Grade: 81.41% (Activity 64%, Repository 74%, Collaboration 82%, Security N/A, DeFi Scanner 83%).  

Catalysts That Skew Bullish

  • Institutional and retail access expands with ETFs, listings, and integrations.
  • Macro tailwinds from lower real rates and improving liquidity.
  • Product or roadmap milestones such as upgrades, scaling, or partnerships.

Risks That Skew Bearish

  • Macro risk-off from tightening or liquidity shocks.
  • Regulatory actions or infrastructure outages.
  • Concentration or validator economics and competitive displacement.
  • Protocol-specific execution risk and competitive pressure from alternatives.

FAQs

Can CRO reach $1?

Based on the scenarios, CRO could reach $1 in the 23T moon case where it projects to $1.09, and in the 31T scenarios where the base case is $1.13 and the moon case is $1.46. These outcomes require both broad market cap expansion and Cronos maintaining competitive position. Not financial advice.

What's the risk/reward profile for CRO?

Risk/reward spans from $0.14 in the lowest bear case to $1.46 in the highest moon case. Downside risks include regulatory or infrastructure shocks and competitive displacement, while upside drivers include liquidity expansion and roadmap execution. Concentrated positions amplify both tails, while diversified strategies smooth outcomes.

What gives CRO value?

CRO accrues value through transaction fees, staking, and governance utility across the Cronos ecosystem. Demand drivers include DeFi activity, cross-chain usage, and network services. While these fundamentals matter, diversified portfolios capture value accrual across multiple tokens rather than betting on one protocol's success.  

Next Steps

Disclosure
Educational purposes only, not financial advice. Crypto is volatile, concentration amplifies risk, and diversification is a fundamental principle of prudent portfolio construction. Do your own research and manage risk appropriately.

Research

How High Can Shiba Inu Go by 2027? Scenario-Based Forecast

Token Metrics Team
6 min read

Understanding Shiba Inu's Speculative Nature

Shiba Inu operates as a community-driven meme token where price action stems primarily from social sentiment, attention cycles, and speculative trading rather than fundamental value drivers. SHIB exhibits extreme volatility with no defensive characteristics or revenue-generating mechanisms typical of utility tokens. Token Metrics scenarios below provide technical Price Predictions across different market cap environments, though meme tokens correlate more strongly with viral trends and community engagement than systematic market cap models. Positions in SHIB should be sized as high-risk speculative bets with potential for total loss.


Disclosure

Educational purposes only, not financial advice. Crypto is volatile, do your own research and manage risk.

How to read it: Each band blends cycle analogues and market-cap share math with TA guardrails. Base assumes steady adoption and neutral or positive macro. Moon layers in a liquidity boom. Bear assumes muted flows and tighter liquidity. For meme tokens, actual outcomes depend heavily on social trends and community momentum beyond what market cap models capture.

TM Agent baseline: Token Metrics TM Grade is 24.1%, Sell, with a bearish trading signal. The concise 12‑month numeric view centers between

TM Agent numeric view: scenarios center roughly between $0.000005 and $0.000035, with a base case near $0.000012.

Live details: Token Details 

Key Takeaways

  • Highly speculative asset driven by sentiment and attention rather than fundamentals.
  • Scenario driven, outcomes hinge on total crypto market cap and viral momentum.
  • Extreme volatility characteristic - SHIB can experience double-digit percentage moves daily.
  • TM Agent gist: Bearish short term, $0.000005–$0.000035 range.
  • Entertainment risk only, not financial advice.

Scenario Analysis

Token Metrics scenarios provide technical price bands across market cap tiers:

8T: At 8 trillion total crypto market cap, SHIB projects to $0.041998 (bear), $0.042366 (base), and $0.042734 (moon).  

16T: At 16 trillion total crypto market cap, SHIB projects to $0.043973 (bear), $0.045077 (base), and $0.046182 (moon).  

23T: At 23 trillion total crypto market cap, SHIB projects to $0.045948 (bear), $0.047789 (base), and $0.049629 (moon).  

31T: At 31 trillion total crypto market cap, SHIB projects to $0.047923 (bear), $0.051050 (base), and $0.051307 (moon).  

These technical ranges assume meme tokens maintain market cap share proportional to overall crypto growth. Actual outcomes for speculative tokens typically exhibit higher variance and stronger correlation to social trends than these models predict.

What Is Shiba Inu?

Shiba Inu is a meme-born crypto project that centers on community and speculative culture. Unlike utility tokens with specific use cases, SHIB operates primarily as a speculative asset and community symbol. The project focuses on community engagement and entertainment value.

SHIB has demonstrated viral moments and community loyalty within the broader meme token category. The token trades on community sentiment and attention cycles more than fundamentals. Market performance depends heavily on social media attention and broader meme coin cycles.

Risks That Skew Bearish

  • Extreme volatility from pure sentiment-driven price action with no fundamental support.
  • Attention cycles shift rapidly, leaving early viral tokens abandoned as new memes emerge.
  • Liquidity can evaporate quickly during downturns, creating severe slippage and exit difficulty.
  • Regulatory scrutiny may target meme tokens as securities or gambling instruments.
  • Macro risk-off environments hit speculative assets hardest, with meme coins showing largest drawdowns.
  • Community fragmentation or developer abandonment can eliminate remaining narrative support.

Make Your Next Move with Token Metrics

Token Metrics provides technical analysis, scenario math, and rigorous risk evaluation for hundreds of crypto tokens. Want to dig deeper? Explore our powerful AI-powered ratings and scenario tools here.

FAQs

Will SHIB 10x from here?

Answer: At current price of $0.041027, a 10x reaches $0.41027. This level does not appear in any of the listed bear, base, or moon scenarios across 8T, 16T, 23T, or 31T tiers. Meme tokens can 10x rapidly during viral moments but can also lose 90%+ just as quickly. Position sizing for potential total loss is critical. Not financial advice.

What are the biggest risks to SHIB?

Answer: Primary risks include attention shifting to newer memes, community fragmentation, developer abandonment, regulatory crackdowns, and liquidity collapse during downturns. Unlike utility tokens with defensive characteristics, SHIB has zero fundamental floor. Price can approach zero if community interest disappears. Total loss is a realistic outcome. Not financial advice.  

Next Steps

Disclosure

Educational purposes only, not financial advice. SHIB is a highly speculative asset with extreme volatility and high risk of total loss. Meme tokens operate as entertainment and gambling instruments rather than investments. Only allocate capital you can afford to lose entirely. Do your own research and manage risk appropriately.

Research

WhiteBIT Coin (WBT) 2028 Price Predictions: Token Metrics Scenarios

Token Metrics Team
7 min read

Portfolio Context for WhiteBIT Coin: Diversification in the 2028 Landscape

Exchange tokens like WhiteBIT Coin offer leveraged exposure to overall market activity, creating concentration risk around a single platform's success. While WBT can deliver outsized returns during bull markets with high trading volumes, platform-specific risks like regulatory action, security breaches, or competitive displacement amplify downside exposure. Portfolio theory suggests balancing such concentrated bets with broader sector exposure.

The scenarios below show how WBT might perform across different crypto market cap environments. Rather than betting entirely on WhiteBIT Coin's exchange succeeding, diversified strategies blend exchange tokens with L1s, DeFi protocols, and infrastructure plays to capture crypto market growth while mitigating single-platform risk.

The Case for Diversified Index Exposure

Portfolio theory teaches that diversification is the only free lunch in investing. WBT concentration violates this principle by tying your crypto returns to one protocol's fate. Token Metrics Indices blend WhiteBIT Coin with the top one hundred tokens, providing broad exposure to crypto's growth while smoothing volatility through cross-asset diversification. This approach captures market-wide tailwinds without overweighting any single point of failure.

Systematic rebalancing within index strategies creates an additional return source that concentrated positions lack. As some tokens outperform and others lag, regular rebalancing mechanically sells winners and buys laggards, exploiting mean reversion and volatility. Single-token holders miss this rebalancing alpha and often watch concentrated gains evaporate during corrections while index strategies preserve more gains through automated profit-taking.

Beyond returns, diversified indices improve the investor experience by reducing emotional decision-making. Concentrated WBT positions subject you to severe drawdowns that trigger panic selling at bottoms. Indices smooth the ride through natural diversification, making it easier to maintain exposure through full market cycles. Get early access: https://docs.google.com/forms/d/1AnJr8hn51ita6654sRGiiW1K6sE10F1JX-plqTUssXk/preview.


Disclosure

Educational purposes only, not financial advice. Crypto is volatile, do your own research and manage risk.

How to read it: Each band blends cycle analogues and market-cap share math with TA guardrails. Base assumes steady adoption and neutral or positive macro. Moon layers in a liquidity boom. Bear assumes muted flows and tighter liquidity.

TM Agent baseline: Token Metrics long term view for WhiteBIT Coin, cashtag $WBT. Lead metric first, Token Metrics TM Grade is 52.5%, Hold, and the trading signal is bearish, indicating short-term downward momentum. Concise 12-month numeric view: Token Metrics scenarios center roughly between $10 and $85, with a base case near $40.

Live details: Token Details

Key Takeaways

  • Scenario driven, outcomes hinge on total crypto market cap, higher liquidity and adoption lift the bands.
  • Single-asset concentration amplifies both upside and downside versus diversified approaches.
  • Fundamentals: Fundamental Grade 52.35% (Community 82%, Tokenomics 60%, Exchange 50%, VC —, DeFi Scanner N/A).
  • TM Agent gist: Bearish momentum, 12-month range $10 to $85.
  • Education only, not financial advice.

Scenario Analysis

Token Metrics scenarios span four market cap tiers, each representing different levels of crypto market maturity and liquidity:

8T: At an 8 trillion dollar total crypto market cap, WBT projects to $54.50 in bear conditions, $64.88 in the base case, and $75.26 in bullish scenarios.  

16T: Doubling the market to 16 trillion expands the range to $78.61 (bear), $109.75 (base), and $140.89 (moon).  

23T: At 23 trillion, the scenarios show $102.71, $154.61, and $206.51 respectively.  

31T: In the maximum liquidity scenario of 31 trillion, WBT could reach $126.81 (bear), $199.47 (base), or $272.13 (moon).  

These ranges illustrate potential outcomes for concentrated WBT positions, but investors should weigh whether single-asset exposure matches their risk tolerance or whether diversified strategies better suit their objectives.

What Is WhiteBIT Coin?

WhiteBIT Coin is the native exchange token associated with the WhiteBIT ecosystem. It is designed to support utility on the platform and related services.

WBT typically provides fee discounts and ecosystem benefits where supported. Usage depends on exchange activity and partner integrations.

Token Metrics AI Analysis

Token Metrics AI provides comprehensive context on WhiteBIT Coin's positioning and challenges.

Vision: The stated vision for WhiteBIT Coin centers on enhancing user experience within the WhiteBIT exchange ecosystem by providing tangible benefits such as reduced trading fees, access to exclusive features, and participation in platform governance or rewards programs. It aims to strengthen user loyalty and engagement by aligning token holders’ interests with the exchange’s long-term success. While not positioned as a decentralized protocol token, its vision reflects a broader trend of exchanges leveraging tokens to build sustainable, incentivized communities.

Problem: Centralized exchanges often face challenges in retaining active users and differentiating themselves in a competitive market. Users may be deterred by high trading fees, limited reward mechanisms, or lack of influence over platform developments. WhiteBIT Coin aims to address these frictions by introducing a native incentive layer that rewards participation, encourages platform loyalty, and offers cost-saving benefits. This model seeks to improve user engagement and create a more dynamic trading environment on the WhiteBIT platform.

Solution: WhiteBIT Coin serves as a utility token within the WhiteBIT exchange, offering users reduced trading fees, staking opportunities, and access to special events such as token sales or airdrops. It functions as an economic lever to incentivize platform activity and user retention. While specific governance features are not widely documented, such tokens often enable voting on platform upgrades or listing decisions. The solution relies on integrating the token deeply into the exchange’s operational model to ensure consistent demand and utility for holders.

Market Analysis: Exchange tokens like WhiteBIT Coin operate in a competitive landscape led by established players such as Binance Coin (BNB) and KuCoin Token (KCS). While BNB benefits from a vast ecosystem including a launchpad, decentralized exchange, and payment network, WBT focuses on utility within its native exchange. Adoption drivers include the exchange’s trading volume, security track record, and the attractiveness of fee discounts and staking yields. Key risks involve regulatory pressure on centralized exchanges and competition from other exchange tokens that offer similar benefits.

Fundamental Snapshot from Token Metrics

Fundamental Grade: 52.35% (Community 82%, Tokenomics 60%, Exchange 50%, VC —, DeFi Scanner N/A).  

Catalysts That Skew Bullish

  • Institutional and retail access expands with ETFs, listings, and integrations.
  • Macro tailwinds from lower real rates and improving liquidity.
  • Product or roadmap milestones such as upgrades, scaling, or partnerships.

Risks That Skew Bearish

  • Macro risk-off from tightening or liquidity shocks.
  • Regulatory actions or infrastructure outages.
  • Concentration or validator economics and competitive displacement.
  • Protocol-specific execution risk and competitive pressure from alternatives.

FAQs

Can WBT reach $100?

Answer: Based on the scenarios, WBT could reach $100 in the 16T base case. The 16T tier projects $109.75 in the base case. Achieving this requires both broad market cap expansion and WhiteBIT Coin maintaining competitive position. Not financial advice.

What's the risk/reward profile for WBT?

Answer: Risk and reward span from $54.50 in the lowest bear case to $272.13 in the highest moon case. Downside risks include regulatory actions and competitive displacement, while upside drivers include expanding access and favorable macro liquidity. Concentrated positions amplify both tails, while diversified strategies smooth outcomes.

What gives WBT value?

Answer: WBT accrues value through fee discounts, staking rewards, access to special events, and potential participation in platform programs. Demand drivers include exchange activity, user growth, and security reputation. While these fundamentals matter, diversified portfolios capture value accrual across multiple tokens rather than betting on one protocol's success.  

Next Steps

Disclosure

Educational purposes only, not financial advice. Crypto is volatile, concentration amplifies risk, and diversification is a fundamental principle of prudent portfolio construction. Do your own research and manage risk appropriately.

Choose from Platinum, Gold, and Silver packages
Reach with 25–30% open rates and 0.5–1% CTR
Craft your own custom ad—from banners to tailored copy
Perfect for Crypto Exchanges, SaaS Tools, DeFi, and AI Products