Crypto Basics

What Is a Moonshot? The Ultimate Guide to High-Risk, High-Reward Gems in Crypto (2025)

Learn what a moonshot is in crypto, how to find the next 100x token, and how to manage risk. Discover top moonshot tools like Token Metrics and key trends for 2025
Token Metrics Team
6 min
MIN

The term “moonshot” is everywhere in the crypto world—but what does it really mean? In 2025, as the search for the next 100x token intensifies, understanding the concept of a crypto moonshot is more important than ever. Moonshots offer massive upside potential, but they also come with high risk. So how do you find them, and more importantly, how do you separate hype from real opportunity?

In this guide, we’ll break down what a moonshot is, why it matters, how to identify one, and how tools like Token Metrics are helping investors discover the next big thing in crypto—before it takes off.

🚀 What Is a Moonshot in Crypto?

In crypto, a moonshot refers to a low-cap, high-potential cryptocurrency that could deliver outsized returns, typically 10x, 50x, or even 100x your initial investment. The term comes from the idea that a token is going “to the moon”—crypto slang for an explosive price increase.

Unlike established cryptocurrencies like Bitcoin and Ethereum, moonshots are usually early-stage projects with small market caps, limited trading volume, and a high level of speculation. These tokens often sit under the radar, only gaining traction once a specific narrative, innovation, or market trend brings them into the spotlight.

🧠 Characteristics of a Moonshot Token

While no one can guarantee a moonshot, successful ones often share several key traits:

1. Low Market Cap

Most moonshots start with a market cap under $50 million, sometimes even under $10 million. This gives them room to grow exponentially as adoption increases.

2. Strong Narrative or Trend Alignment

Moonshots usually align with emerging crypto narratives, such as:

  • AI in crypto (e.g., TMAI)
  • Real-world assets (RWA)
  • Decentralized infrastructure (DePIN)
  • ZK rollups and Layer-2s
  • On-chain gaming and modular blockchains


3. Innovative Technology or Unique Use Case

They bring new ideas or solve real problems, giving them the potential to disrupt existing models.

4. Early Community Traction

Even if small, moonshots typically have loyal, vocal communities that drive awareness and support adoption.

5. Token Utility

Tokens that play a critical role in a product’s functionality (staking, access, governance) are more likely to gain value as adoption grows.

6. Exchange Listings

Getting listed on a major CEX (centralized exchange) or DEX (decentralized exchange) often serves as a catalyst for price surges.

⚠️ Moonshot = High Risk, High Reward

While the upside is massive, moonshots come with serious risks:

  • Volatility: Prices can swing wildly in hours or minutes.
  • Scams and rug pulls: Many low-cap tokens are created with malicious intent.
  • Illiquidity: It may be hard to buy or sell large amounts.
  • Overhype: Narratives can fizzle out quickly, leaving bag holders behind.
  • Lack of product-market fit: Many projects never deliver a working product.

Risk management is essential. Only allocate a small portion of your portfolio to moonshots and always do your own research.

🔍 How to Identify Crypto Moonshots

Finding true moonshots is part art, part science. Here are practical steps to help spot them:

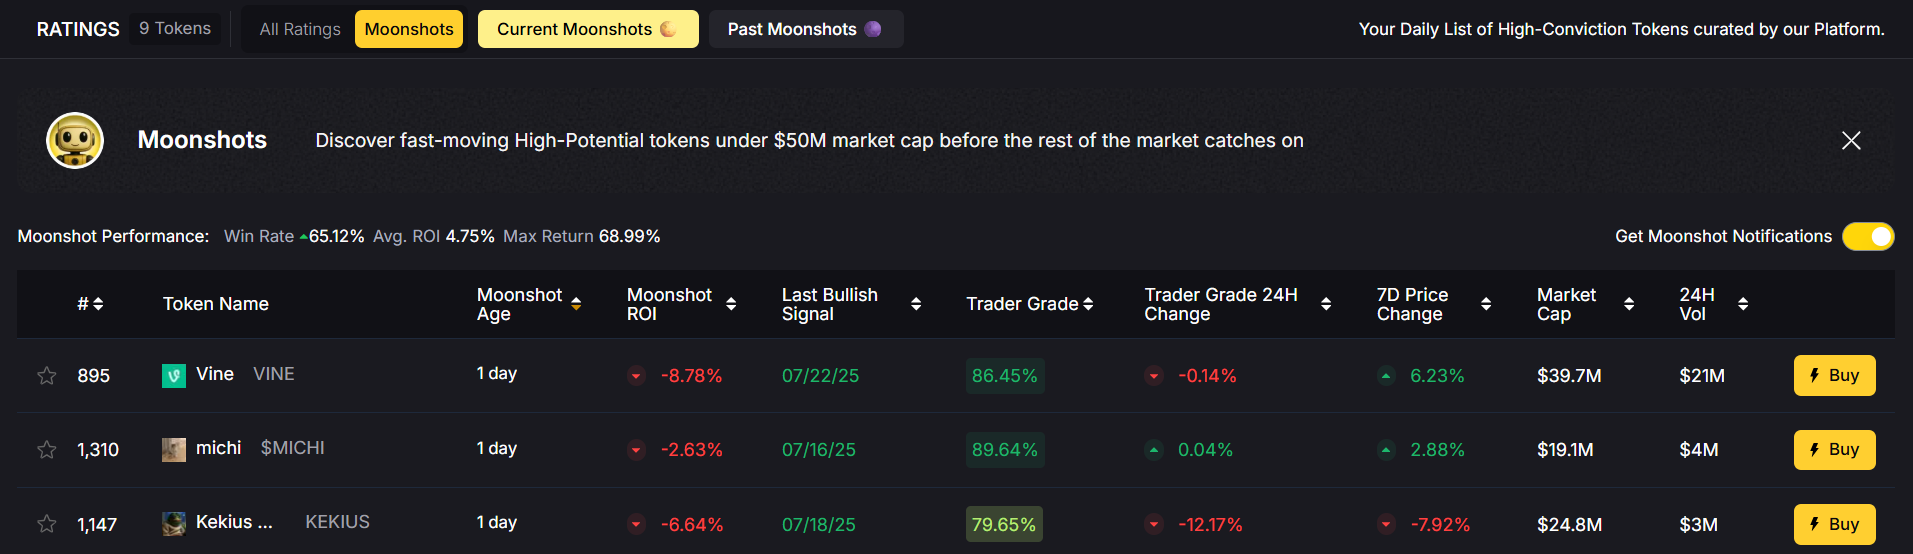
1. Use Token Metrics Moonshots Feature

Token Metrics, the leading AI-powered crypto research platform, features a dedicated Moonshots tab that helps users discover early-stage altcoins with massive potential.

Token Metrics uses AI models to:

  • Scan over 6,000+ tokens
  • Analyze 80+ on-chain and off-chain data points
  • Score tokens based on Investor Grade (long-term) and Trader Grade (short-term)
  • Highlight tokens before they hit mainstream radar

2. Follow Emerging Narratives

Pay attention to sectors gaining momentum—AI, DePIN, L2s, gaming, and RWA are hot in 2025. Moonshots often emerge at the intersection of narrative and innovation.

3. Explore Crypto Twitter and Discord

Many early-stage gems are discussed by small communities, KOLs (key opinion leaders), and early investors before any mainstream media coverage.

4. Check Tokenomics

A great idea can’t succeed with poor tokenomics. Look for:

  • Fair initial distribution
  • Deflationary or limited supply
  • Lock-up periods for team/investors
  • Strong incentive alignment with users

5. Monitor DEX Launchpads and On-Chain Metrics

Platforms like Uniswap, Camelot, or Base-native DEXs are where most moonshots launch first. Analyze:

  • Wallet distribution (whale vs retail)
  • Volume and liquidity
  • Holder growth

🔬 How Token Metrics Helps You Find the Next Moonshot

Token Metrics is the ultimate tool for discovering and validating moonshot opportunities. Here’s how:

🧠 AI-Driven Token Ratings

Get real-time Investor Grade and Trader Grade scores, generated by AI models trained on historical altcoin performance.

📈 Bullish & Bearish Signals

Get alerts when a token shows strong upside or downside momentum based on quantitative signals.

🚀 Moonshots Section

A curated feed of low-cap, high-potential tokens filtered by market cap, sector, risk level, and on-chain traction.

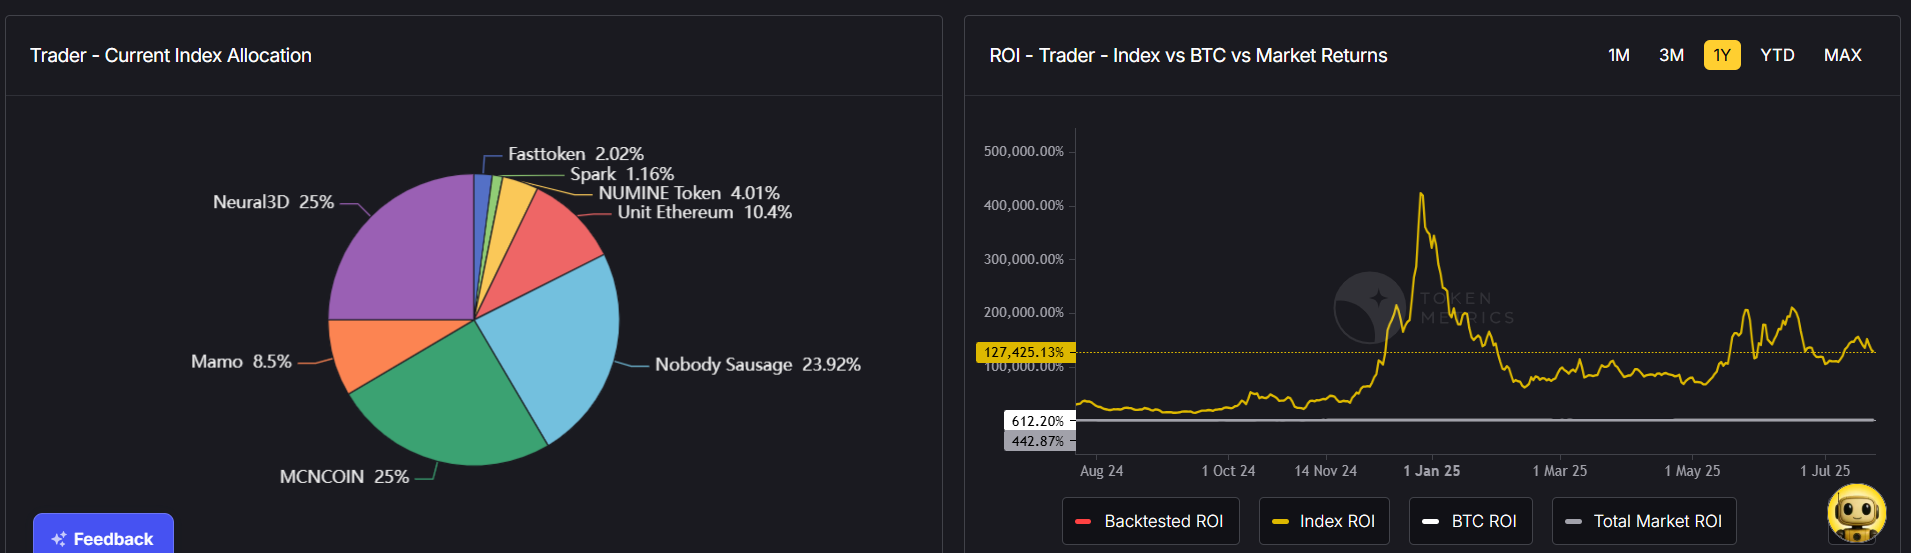
📊 Backtesting & Risk Analysis

Use simulation tools to see how a moonshot would have performed in different market conditions, helping you gauge timing and position sizing.

👉 Try Token Metrics with a 7-day free trial and start exploring moonshots with data, not just hype.

✅ Examples of Real Moonshots

In previous years, several tokens started as moonshots and delivered massive gains:

  • Polygon (MATIC) – Launched below $0.01, surged to over $2.50 at peak

  • Axie Infinity (AXS) – Went from cents to $165 during the 2021 gaming boom

  • Pepe (PEPE) – Meme coin that turned thousands into millions in 2023

  • VIRTUAL (SPX6900) – Token Metrics alerted this 55x trade before the crowd

In 2025, emerging moonshots include AI-powered tokens like $TMAI (Token Metrics AI)—positioned at the forefront of AI + crypto convergence.

🛡️ Tips for Safely Investing in Moonshots

  • Only use risk capital (money you can afford to lose)
  • Start small and scale positions after traction
  • Set profit targets and stop-losses
  • Diversify across 5–10 moonshot tokens
  • Use non-custodial wallets and keep private keys secure
  • Don’t chase pumps—enter early or not at all

Moonshot investing isn’t about certainty—it’s about asymmetrical bets with defined downside and massive upside.

Final Thoughts

Moonshots are the heartbeat of crypto innovation. They represent the bold, risky, and visionary projects that could reshape entire industries—or fade into obscurity.

In 2025, the opportunity to find the next Solana, MATIC, or PEPE still exists—but success comes from informed decisions, not hype-driven FOMO. That’s why platforms like Token Metrics are critical. With AI-powered research, curated moonshot lists, and real-time trading signals, Token Metrics helps you spot the gems before they moon.

So, what’s your next moonshot?

Build Smarter Crypto Apps &
AI Agents in Minutes, Not Months
Real-time prices, trading signals, and on-chain insights all from one powerful API.
Grab a Free API Key
Token Metrics Team
Token Metrics Team

Recent Posts

Research

Trader vs. Investor Grade: How to Use Both for Smarter Crypto Bets

Token Metrics Team
4 min
MIN

Crypto trading success often boils down to timing. But how do you know when to enter — and when to stay long? Token Metrics solves this dilemma with a dual-grade system: Trader Grade and Investor Grade. Each grade serves a different investment goal, and together, they help you make more confident decisions, whether you’re day trading or holding for the long run.

What is the Trader Grade?
The Trader Grade measures short-term momentum. It uses AI to analyze price action, volume trends, technical indicators, and recent sentiment shifts. Scores range from 0 to 100, and a score above 80 signals strong short-term potential.

Use Case:

  • Perfect for swing traders and short-term opportunists.
  • Look for tokens with Trader Grade > 80 for potential breakout trades.
  • Example: Launchcoin had a Trader Grade above 90 before its 35x rally began.

What is the Investor Grade?
The Investor Grade focuses on long-term fundamentals. It’s designed for those who want to hold tokens for months or even years. This grade considers tokenomics, development activity, ecosystem strength, narrative alignment, and long-term price structure.

Use Case:

  • Ideal for long-term portfolio builders.
  • A token with Investor Grade > 80 is a strong candidate for accumulation.
  • AI infrastructure tokens and modular blockchains often rank high here.

Why Use Both?
Most traders fail by only looking at hype or short-term charts. Token Metrics lets you blend data:

  • High Trader Grade + Low Investor Grade? Consider a short-term trade, not a long hold.
  • High Investor Grade + Low Trader Grade? Consider waiting for a better entry point.
  • Both High? Green light for confidence in both entry and long-term performance.

Case Study: Balancing Your Portfolio with Grades
Users can use the dual-grade approach for smarter allocation:

  • 30% of capital to high Trader Grade tokens (short-term plays)
  • 70% to high Investor Grade tokens (long-term holds)

This method helps mitigate risk and improve overall ROI.

Where to Find the Grades
Both grades are displayed prominently across:

  • Token Detail Pages – Real-time grade updates with historical data
  • Market Page Filters – Sort tokens by grade thresholds
  • Portfolio Builder Tool – Automatically selects tokens with strong grades

Tips for Grade-Based Trading

  1. Use Trader Grade for volatile markets or when prices are accelerating.
  2. Use Investor Grade when building positions in strong narratives like AI, DeFi, or infrastructure.
  3. Avoid tokens with both grades below 60 unless you’re making a speculative bet.

Conclusion
Trading without context is gambling. Token Metrics’ Trader and Investor Grades give you a proven framework for assessing both momentum and fundamentals. Whether you’re here for a quick flip or a long-term bet, using the dual-grade system can level up your crypto strategy.

Announcements

Inside the Dashboard: How to Monitor API Key Activity and Monthly Usage in Real Time

Token Metrics Team
5 min
MIN

The power of any great API isn’t just in the data it provides — it’s also in the control, visibility, and accountability it gives developers. That’s why the Token Metrics API Dashboard is more than just a place to generate keys — it’s your real-time command center for monitoring API key usage, managing access, and optimizing performance.

In this article, we’ll explore how to use the Token Metrics API Dashboard to stay in control of your app’s data usage, track request history, and ensure your integrations remain secure and efficient.

📍 Where to Find It

To access the dashboard:

  1. Log in to your Token Metrics account.
  2. Go to: https://app.tokenmetrics.com/en/api
  3. Navigate to the API Keys and API Usage sections.

🔐 View and Manage API Keys

The API Keys section gives you a complete overview of every active key associated with your account. For each key, you’ll see:

  • Key Name: Descriptive labels like "Bot A" or "Staging Server"
  • Created Date: When the key was generated
  • Last Used: Timestamp of the most recent request
  • Status: Active or inactive toggle
  • Actions: Trash icon to instantly delete a key

💡 Why It Matters:

  • Spot unused or stale keys that may pose a security risk
  • Instantly disable or delete a key if it’s compromised
  • Monitor which app or environment is making the most requests

📊 Monitor API Usage in Real-Time

In the Usage Dashboard, Token Metrics gives you deep insights into how your API credits are being used.

Key metrics include:

  • API Calls Graph
    A daily call volume chart so you can identify peaks in usage, anomalies, or unexpected surges.

  • Total Monthly API Calls
    Example:
    8,750 / 20,000
    See how much of your monthly quota you’ve used — and when it resets.

  • Remaining API Credits
    Know exactly how many calls you have left in your current cycle.

  • API Call Statistics Table
    Each row includes:

    • Endpoint accessed (e.g., /trader-grade)
    • Timestamp of the request
    • Status code (200 = success, 401 = unauthorized, etc.)
    • Originating IP address
    • Success/failure response

🔄 Debugging & Insights Made Easy

This dashboard doesn’t just monitor—it helps you debug and optimize.

  • Quickly identify if your integration is repeatedly hitting 400 or 403 errors
  • Check whether a specific key is being overused or underused
  • Pinpoint spikes in usage that may indicate unauthorized access
  • See which endpoints are called most often — and consider caching results

⚠️ Avoid Rate Limit Surprises

If you’re on a Basic or Advanced plan, you’ll have a rate limit (e.g., 1 req/min for free users, up to 600 req/min for VIPs). The dashboard helps ensure you stay within your limits — and scale appropriately when needed.

🚀 Build Better with Transparency

In a production environment, visibility into API activity is critical. With Token Metrics, you’re never flying blind. You always know:

  • Which app is using which key
  • How many credits you’re using
  • When to optimize or upgrade

From security to scaling, the Token Metrics API Dashboard gives you the insight you need to build with clarity and control.

👉 Launch Your API Dashboard Now → tokenmetrics.com/api

Research

Is the Crypto Market Bullish or Bearish? Why 2025 Is the Year of Neutral Momentum

Token Metrics Team
3 min
MIN

The crypto market isn't clearly bullish or bearish in mid-2025 — it's neutral. This article explores why this 'in-between' momentum could signal a maturing market cycle, and what investors should watch for as signals normalize after a sharp $1T rebound in total market cap.

As we navigate through the midpoint of 2025, one question dominates trading desks and Telegram groups alike: Is the crypto market bullish or bearish? Surprisingly, the answer might be neither. Current indicators suggest that we are in a neutral zone — an ambiguous space where the market is no longer surging with euphoric gains but isn’t plunging into panic either.

From January through mid-May, the total crypto market cap has grown from $1 trillion to $2 trillion. This swift rebound signals recovery, but not full-blown optimism. Instead, many analysts — ourselves included — interpret this as a healthy correction and stabilization following intense early-year volatility.

This kind of environment often marks the early stages of a maturing cycle. Unlike the sharp swings we saw in previous bull and bear markets, 2025’s trend suggests more measured growth, driven by fundamentals rather than hype. In other words, the market might finally be learning from its past.

That doesn’t mean the space lacks activity. Sectors like DeFi lending and AI-related tokens continue to gain traction, with significant TVL inflows. Retail interest in meme coins also remains high in select regions. But overall, what we’re seeing is consolidation — not chaos.

In this neutral setting, strategy matters more than sentiment. It's no longer about jumping into trending narratives or panic-selling on dips. Instead, identifying projects with real use cases, sustainable economics, and strong communities has become the foundation of long-term success.

For traders and builders alike, the current landscape offers both challenges and opportunities. Risk-adjusted returns are key, and disciplined portfolio rebalancing could be one of the most underrated strategies right now.

As we continue monitoring market signals, we remain committed to surfacing actionable insights backed by real-time data, not just narratives. Whether the next breakout is weeks or months away, staying informed — and unemotional — may prove to be your best edge.

How Token Metrics Helps in a Neutral Market Environment:

In times of neutral momentum, making profitable crypto decisions becomes more complex — and that's where Token Metrics shines:

  1. Actionable AI Signals:
    Token Metrics scans thousands of tokens daily, using over 80 data points to identify bullish and bearish trends even when market sentiment is flat. This helps users cut through noise and act on real opportunities.
  2. Investor & Trader Grades:
    When hype fades, fundamentals matter. Our proprietary grades evaluate both short-term momentum and long-term viability, helping users discover tokens with staying power — not just temporary pumps.
  3. Smart Rebalancing Alerts:
    In a consolidating market, maintaining the right portfolio mix is crucial. Token Metrics' indices and alerts help users rebalance regularly to lock in gains and minimize downside risks.
  4. Sector-Based Insights:
    With DeFi, AI, and meme coins behaving differently, Token Metrics allows users to dive deep into sector-specific analytics — so you can position ahead of capital flows.
  5. Sentiment & Volume Monitoring:
    Our platform tracks shifts in on-chain activity, social sentiment, and volume trends to spot early signs of market reversals — especially useful when traditional signals stall.

In a market where being early beats being emotional, Token Metrics equips you with the clarity and tools to trade with confidence.

Choose from Platinum, Gold, and Silver packages
Reach with 25–30% open rates and 0.5–1% CTR
Craft your own custom ad—from banners to tailored copy
Perfect for Crypto Exchanges, SaaS Tools, DeFi, and AI Products