Back to blog
Research

What Is Ether? A Complete Guide to Ethereum’s Native Token in 2025

Learn what Ether (ETH) is, how it works, its role in the Ethereum ecosystem, and why it’s a must‑have crypto asset for investors in 2025.
Token Metrics Team
6 min
Want Smarter Crypto Picks—Free?
See unbiased Token Metrics Ratings for BTC, ETH, and top alts.
Thank you! Your submission has been received!
Oops! Something went wrong while submitting the form.
 No credit card | 1-click unsubscribe

Introduction: Understanding Ether (ETH)

Ether (ETH) is the native cryptocurrency of the Ethereum blockchain, powering one of the most influential ecosystems in the crypto world. Since its launch in 2015, Ethereum has evolved from a simple smart contract platform into a global hub for decentralized finance (DeFi), NFTs, real‑world asset tokenization (RWA), and blockchain‑based applications.

In 2025, Ether remains a cornerstone of crypto portfolios, offering not only investment potential but also utility within Ethereum’s constantly expanding network. This article breaks down what Ether is, how it works, why it’s valuable, and how platforms like Token Metrics help investors analyze ETH effectively.

What Is Ether?

Ether (ETH) is the cryptocurrency used to pay for transactions, smart contract execution, and services on the Ethereum network. While Bitcoin is often referred to as “digital gold,” Ether functions as both a digital asset and a fuel (commonly called “gas”) for running decentralized applications (dApps).

Key roles of Ether:

  • Transaction Fees (Gas): Users pay ETH to interact with the blockchain.
  • Smart Contract Execution: Developers use ETH to deploy and run decentralized applications.
  • Staking & Security: ETH powers Ethereum’s Proof of Stake (PoS) consensus, rewarding validators who secure the network.
  • Store of Value: Like Bitcoin, ETH is also held as a long‑term investment by institutions and retail investors.

How Ethereum Works

Ethereum is a decentralized, programmable blockchain that allows developers to create and deploy dApps. It introduced smart contracts—self‑executing agreements that operate without intermediaries.

In 2022, Ethereum completed The Merge, transitioning from Proof of Work (PoW) to Proof of Stake (PoS). This shift reduced energy consumption by over 99% and enabled ETH holders to stake their tokens to earn passive rewards.

Why Ether Matters in 2025

Ether remains one of the most versatile and valuable cryptocurrencies in the market:

  1. DeFi Dominance:
    Ethereum powers most decentralized finance protocols, with billions of dollars locked in apps for lending, borrowing, and yield farming.

  2. NFT Ecosystem:
    Ethereum remains the leading blockchain for non‑fungible tokens (NFTs), supporting major marketplaces and artists.

  3. Enterprise Adoption:
    Businesses use Ethereum for tokenizing real‑world assets, executing private smart contracts, and building blockchain‑based supply chains.

  4. Investment Potential:
    ETH continues to be a top‑performing asset, appealing to long‑term HODLers and institutional investors.

The Role of Ether in DeFi

In 2025, Ethereum continues to dominate the decentralized finance (DeFi) space. DeFi protocols like Uniswap, Aave, and MakerDAO run on Ethereum, using Ether as collateral or for gas fees.

Why this matters for investors:

  • ETH demand grows as DeFi expands.
  • Holding ETH grants access to liquidity pools, lending platforms, and yield farming opportunities.

How to Buy and Store Ether

1. Buying ETH:
Ether is available on major crypto exchanges such as Coinbase, Binance, and decentralized platforms like Uniswap.

2. Storing ETH:
Use:

  • Hot Wallets: Convenient for frequent transactions (e.g., MetaMask).
  • Cold Wallets: Hardware wallets like Ledger or Trezor for secure long‑term storage.

3. Staking ETH:
Stake ETH directly through Ethereum validators or staking platforms to earn rewards while supporting the network.

Ether vs. Bitcoin

While Bitcoin and Ether are both top cryptocurrencies, they serve different purposes:

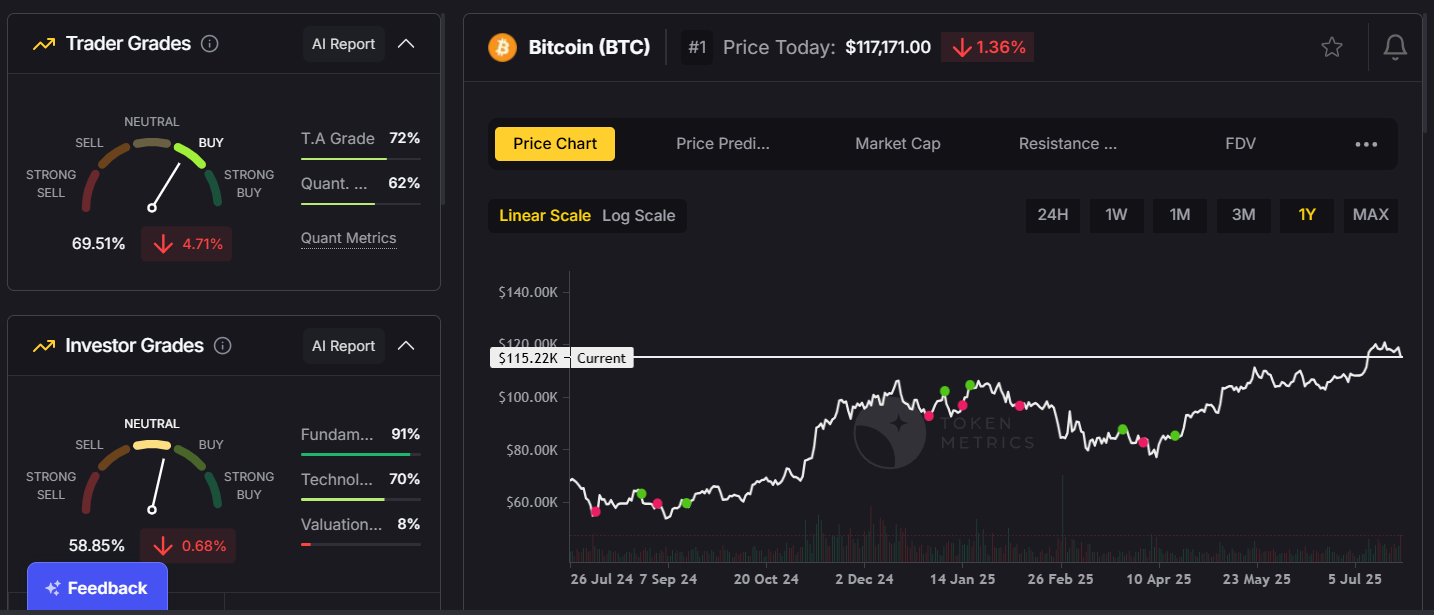
  • Bitcoin: Primarily a store of value and payment network.
  • Ether: A multi‑purpose token for smart contracts, dApps, and staking.

In 2025, ETH has positioned itself as a growth‑driven crypto asset, while Bitcoin remains the ultimate store of value.

Price Outlook and Market Potential

With Ethereum’s upgrades and institutional adoption, many analysts expect ETH to outperform in the coming cycle. Key growth drivers include:

  • Layer 2 Scaling Solutions: Projects like Polygon (MATIC) reduce gas fees and improve transaction speed.
  • Real‑World Asset Tokenization: Expanding Ethereum’s use in traditional finance.
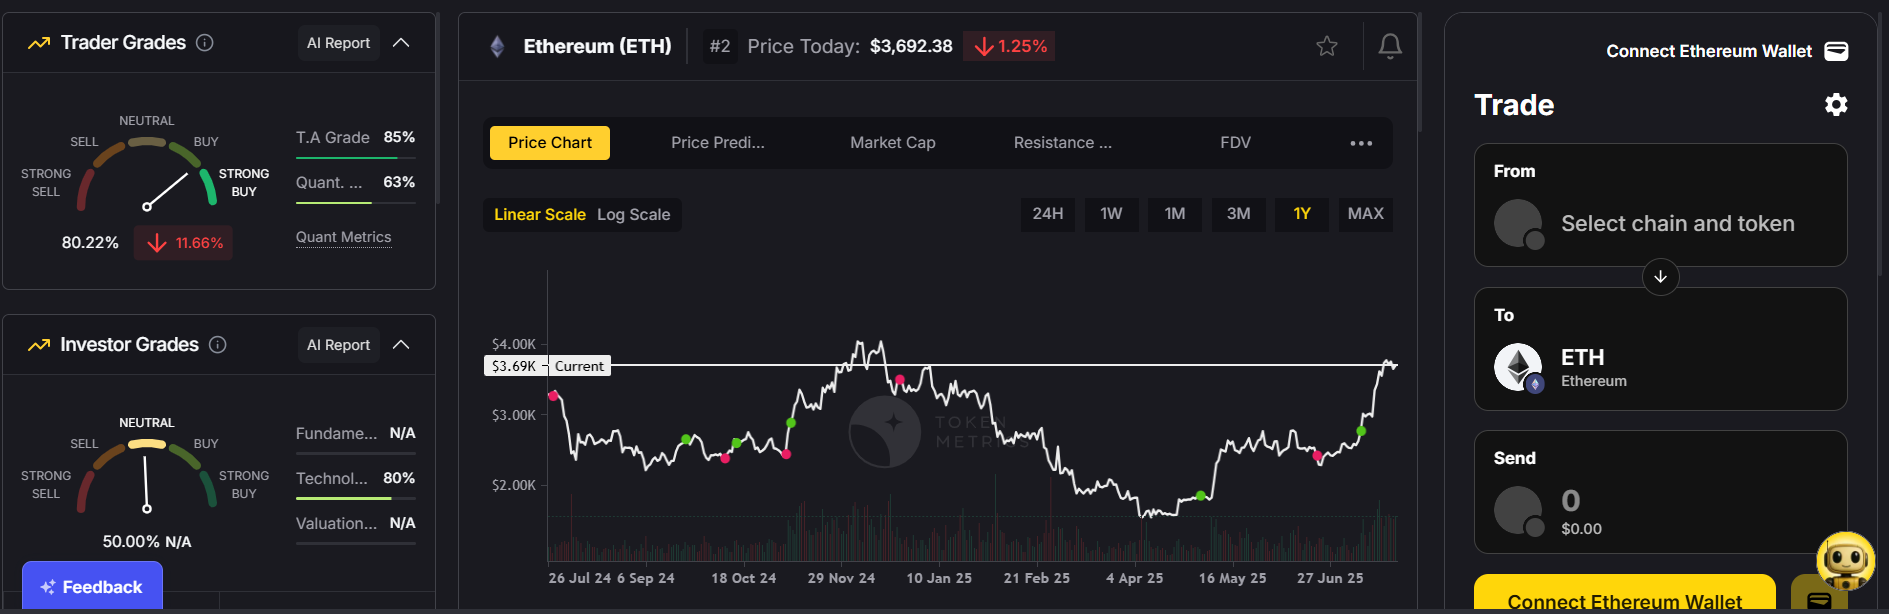
  • AI‑Driven Analytics: Platforms like Token Metrics help investors identify optimal entry and exit points for ETH.

Using Token Metrics for ETH Analysis

Token Metrics offers AI‑powered tools that make investing in ETH smarter:

  • AI‑Generated Ratings: Evaluating ETH based on over 80 data points.
  • On‑Chain Analytics: Tracking active wallets, staking trends, and developer activity.
  • Portfolio Optimization: Helping investors balance ETH exposure with other assets.
  • Market Timing Alerts: AI‑driven signals for buying or taking profits at the right time.

This gives ETH investors a competitive edge in volatile markets.

Risks of Investing in Ether

While ETH has strong fundamentals, risks remain:

  • Network Congestion: Despite Layer 2 solutions, high demand can still lead to expensive gas fees.
  • Regulatory Uncertainty: Ongoing debates about whether ETH could be classified as a security.
  • Competition: Emerging smart contract platforms like Solana and Avalanche challenge Ethereum’s dominance.

Using Token Metrics helps mitigate these risks by providing real‑time analytics and portfolio insights.

Practical Tips for ETH Investors

  1. Stake Your ETH: Earn passive income while contributing to network security.
  2. Diversify Holdings: Balance ETH with other high‑potential altcoins and stablecoins.
  3. Monitor Upgrades: Follow Ethereum roadmap updates (e.g., sharding, scalability improvements).
  4. Use Analytics Tools: Leverage Token Metrics to stay ahead of market trends.

Conclusion

Ether is more than just another cryptocurrency—it’s the lifeblood of the Ethereum ecosystem, powering decentralized applications, DeFi, NFTs, and enterprise solutions.

In 2025, holding ETH offers exposure to one of the most innovative and widely used blockchain platforms, making it a must‑have for serious crypto investors.

By combining long‑term holding strategies with AI‑powered insights from Token Metrics, investors can confidently navigate Ethereum’s growth trajectory and maximize returns in the years ahead.

Build Smarter Crypto Apps &
AI Agents in Minutes, Not Months
Real-time prices, trading signals, and on-chain insights all from one powerful API.
Grab a Free API Key
About Token Metrics
Token Metrics: AI-powered crypto research and ratings platform. We help investors make smarter decisions with unbiased Token Metrics Ratings, on-chain analytics, and editor-curated “Top 10” guides. Our platform distills thousands of data points into clear scores, trends, and alerts you can act on.
30 Employees
analysts, data scientists, and crypto engineers
Daily Briefings
concise market insights and “Top Picks”
Transparent & Compliant
Sponsored ≠ Ratings; research remains independent
Want Smarter Crypto Picks—Free?
See unbiased Token Metrics Ratings for BTC, ETH, and top alts.
Thank you! Your submission has been received!
Oops! Something went wrong while submitting the form.
 No credit card | 1-click unsubscribe
Token Metrics Team
Token Metrics Team

Recent Posts

Research

Support and Resistance API: Auto-Calculate Smart Levels for Better Trades

Token Metrics Team
6 min read

Most traders still draw lines by hand in TradingView. The support and resistance API from Token Metrics auto-calculates clean support and resistance levels from one request, so your dashboard, bot, or alerts can react instantly. In minutes, you’ll call /v2/resistance-support, render actionable levels for any token, and wire them into stops, targets, or notifications. Start by grabbing your key on Get API Key, then Run Hello-TM and Clone a Template to ship a production-ready feature fast.

What You’ll Build in 2 Minutes

A minimal script that fetches Support/Resistance via /v2/resistance-support for a symbol (e.g., BTC, SOL).

  • A one-liner curl to smoke-test your key.
  • A UI pattern to display nearest support, nearest resistance, level strength, and last updated time.

Next Endpoints to add

  • /v2/trading-signals (entries/exits)
  • /v2/hourly-trading-signals (intraday updates)
  • /v2/tm-grade (single-score context)
  • /v2/quantmetrics (risk/return framing)

Why This Matters

Precision beats guesswork. Hand-drawn lines are subjective and slow. The support and resistance API standardizes levels across assets and timeframes, enabling deterministic stops and take-profits your users (and bots) can trust.

Production-ready by design. A simple REST shape, predictable latency, and clear semantics let you add levels to token pages, automate SL/TP alerts, and build rule-based execution with minimal glue code.

Where to Find

Need the Support and Resistance data? The cURL request for it is in the top right of the API Reference for quick access.

👉 Keep momentum: Get API KeyRun Hello-TMClone a Template

How It Works (Under the Hood)

The Support/Resistance endpoint analyzes recent price structure to produce discrete levels above and below current price, along with strength indicators you can use for priority and styling. Query /v2/resistance-support?symbol=<ASSET>&timeframe=<HORIZON> to receive arrays of level objects and timestamps.

Polling vs webhooks. For dashboards, short-TTL caching and batched fetches keep pages snappy. For bots and alerts, use queued jobs or webhooks (where applicable) to avoid noisy, bursty polling—especially around market opens and major events.

Production Checklist

  • Rate limits: Respect plan caps; add client-side throttling.
  • Retries/backoff: Exponential backoff with jitter for 429/5xx; log failures.
  • Idempotency: Make alerting and order logic idempotent to prevent duplicates.
  • Caching: Memory/Redis/KV with short TTLs; pre-warm top symbols.
  • Batching: Fetch multiple assets per cycle; parallelize within rate limits.
  • Threshold logic: Add %-of-price buffers (e.g., alert at 0.3–0.5% from level).
  • Error catalog: Map common 4xx/5xx to actionable user guidance; keep request IDs.
  • Observability: Track p95/p99; measure alert precision (touch vs approach).
  • Security: Store API keys in a secrets manager; rotate regularly.

Use Cases & Patterns

  • Bot Builder (Headless): Use nearest support for stop placement and nearest resistance for profit targets. Combine with /v2/trading-signals for entries/exits and size via Quantmetrics (volatility, drawdown).
  • Dashboard Builder (Product): Add a Levels widget to token pages; badge strength (e.g., High/Med/Low) and show last touch time. Color the price region (below support, between levels, above resistance) for instant context.
  • Screener Maker (Lightweight Tools): “Close to level” sort: highlight tokens within X% of a strong level. Toggle alerts for approach vs breakout events.
  • Risk Management: Create policy rules like “no new long if price is within 0.2% of strong resistance.” Export daily level snapshots for audit/compliance.

Next Steps

  • Get API Key — generate a key and start free.
  • Run Hello-TM — verify your first successful call.
  • Clone a Template — deploy a levels panel or alerts bot today.
  • Watch the demo: Compare plans: Scale confidently with API plans.

FAQs

1) What does the Support & Resistance API return?

A JSON payload with arrays of support and resistance levels for a symbol (and optional timeframe), each with a price and strength indicator, plus an update timestamp.

2) How timely are the levels? What are the latency/SLOs?

The endpoint targets predictable latency suitable for dashboards and alerts. Use short-TTL caching for UIs, and queued jobs or webhooks for alerting to smooth traffic.

3) How do I trigger alerts or trades from levels?

Common patterns: alert when price is within X% of a level, touches a level, or breaks beyond with confirmation. Always make downstream actions idempotent and respect rate limits.

4) Can I combine levels with other endpoints?

Yes—pair with /v2/trading-signals for timing, /v2/tm-grade for quality context, and /v2/quantmetrics for risk sizing. This yields a complete decide-plan-execute loop.

5) Which timeframe should I use?

Intraday bots prefer shorter horizons; swing/position dashboards use daily or higher-timeframe levels. Offer a timeframe toggle and cache results per setting.

6) Do you provide SDKs or examples?

Use the REST snippets above (JS/Python). The docs include quickstarts, Postman collections, and templates—start with Run Hello-TM.

7) Pricing, limits, and enterprise SLAs?

Begin free and scale as you grow. See API plans for rate limits and enterprise SLA options.

Disclaimer

This content is for educational purposes only and does not constitute financial advice. Always conduct your own research before making any trading decisions.

Why choose Token Metrics for crypto trading APIs?

Token Metrics delivers industry-leading support/resistance data, simple integrations, and scalable infrastructure trusted by leading traders and builders worldwide.

Research

Quantmetrics API: Measure Risk & Reward in One Call

Token Metrics Team
6 min read

Most traders see price—quants see probabilities. The Quantmetrics API turns raw performance into risk-adjusted stats like Sharpe, Sortino, volatility, drawdown, and CAGR so you can compare tokens objectively and build smarter bots and dashboards. In minutes, you’ll query /v2/quantmetrics, render a clear performance snapshot, and ship a feature that customers trust. Start by grabbing your key at Get API Key, Run Hello-TM to verify your first call, then Clone a Template to go live fast.

What You’ll Build in 2 Minutes

  • A minimal script that fetches Quantmetrics for a token via /v2/quantmetrics (e.g., BTC, ETH, SOL).
  • A smoke-test curl you can paste into your terminal.
  • A UI pattern that displays Sharpe, Sortino, volatility, max drawdown, CAGR, and lookback window.

Next Endpoints to Add

  • /v2/tm-grade (one-score signal)
  • /v2/trading-signals
  • /v2/hourly-trading-signals (timing)
  • /v2/resistance-support (risk placement)
  • /v2/price-prediction (scenario planning)

Why This Matters

Risk-adjusted truth beats hype. Price alone hides tail risk and whipsaws. Quantmetrics compresses edge, risk, and consistency into metrics that travel across assets and timeframes—so you can rank universes, size positions, and communicate performance like a professional.

Built for dev speed

A clean REST schema, predictable latency, and easy auth mean you can plug Sharpe/Sortino into bots, dashboards, and screeners without maintaining your own analytics pipeline. Pair with caching and batching to serve fast pages at scale.

Where to Find

The Quant Metrics cURL request is located in the top right of the API Reference, allowing you to easily integrate it with your application.

Build Smarter Crypto Apps & AI Agents with Token Metrics

Token Metrics provides real-time prices, trading signals, and on-chain insights all from one powerful API. Grab a Free API Key

How It Works (Under the Hood)

Quantmetrics computes risk-adjusted performance over a chosen lookback (e.g., 30d, 90d, 1y). You’ll receive a JSON snapshot with core statistics:

  • Sharpe ratio: excess return per unit of total volatility.
  • Sortino ratio: penalizes downside volatility more than upside.
  • Volatility: standard deviation of returns over the window.
  • Max drawdown: worst peak-to-trough decline.
  • CAGR / performance snapshot: geometric growth rate and best/worst periods.

Call /v2/quantmetrics?symbol=<ASSET>&window=<LOOKBACK> to fetch the current snapshot. For dashboards spanning many tokens, batch symbols and apply short-TTL caching. If you generate alerts (e.g., “Sharpe crossed 1.5”), run a scheduled job and queue notifications to avoid bursty polling.

Production Checklist

  • Rate limits: Understand your tier caps; add client-side throttling and queues.
  • Retries & backoff: Exponential backoff with jitter; treat 429/5xx as transient.
  • Idempotency: Prevent duplicate downstream actions on retried jobs.
  • Caching: Memory/Redis/KV with short TTLs; pre-warm popular symbols and windows.
  • Batching: Fetch multiple symbols per cycle; parallelize carefully within limits.
  • Error catalog: Map 4xx/5xx to clear remediation; log request IDs for tracing.
  • Observability: Track p95/p99 latency and error rates; alert on drift.
  • Security: Store API keys in secrets managers; rotate regularly.

Use Cases & Patterns

  • Bot Builder (Headless): Gate entries by Sharpe ≥ threshold and drawdown ≤ limit, then trigger with /v2/trading-signals; size by inverse volatility.
  • Dashboard Builder (Product): Add a Quantmetrics panel to token pages; allow switching lookbacks (30d/90d/1y) and export CSV.
  • Screener Maker (Lightweight Tools): Top-N by Sortino with filters for volatility and sector; add alert toggles when thresholds cross.
  • Allocator/PM Tools: Blend CAGR, Sharpe, drawdown into a composite score to rank reallocations; show methodology for trust.
  • Research/Reporting: Weekly digest of tokens with Sharpe ↑, drawdown ↓, and volatility ↓.

Next Steps

  • Get API Key — start free and generate a key in seconds.
  • Run Hello-TM — verify your first successful call.
  • Clone a Template — deploy a screener or dashboard today.
  • Watch the demo: VIDEO_URL_HERE
  • Compare plans: Scale with API plans.

FAQs

1) What does the Quantmetrics API return?

A JSON snapshot of risk-adjusted metrics (e.g., Sharpe, Sortino, volatility, max drawdown, CAGR) for a symbol and lookback window—ideal for ranking, sizing, and dashboards.

2) How fresh are the stats? What about latency/SLOs?

Responses are engineered for predictable latency. For heavy UI usage, add short-TTL caching and batch requests; for alerts, use scheduled jobs or webhooks where available.

3) Can I use Quantmetrics to size positions in a live bot?

Yes—many quants size inversely to volatility or require Sharpe ≥ X to trade. Always backtest and paper-trade before going live; past results are illustrative, not guarantees.

4) Which lookback window should I choose?

Short windows (30–90d) adapt faster but are noisier; longer windows (6–12m) are steadier but slower to react. Offer users a toggle and cache each window.

5) Do you provide SDKs or examples?

REST is straightforward (JS/Python above). Docs include quickstarts, Postman collections, and templates—start with Run Hello-TM.

6) Polling vs webhooks for quant alerts?

Dashboards usually use cached polling. For threshold alerts (e.g., Sharpe crosses 1.0), run scheduled jobs and queue notifications to keep usage smooth and idempotent.

7) Pricing, limits, and enterprise SLAs?

Begin free and scale up. See API plans for rate limits and enterprise SLA options.

Disclaimer

All information provided in this blog is for educational purposes only. It is not intended as financial advice. Users should perform their own research and consult with licensed professionals before making any investment or trading decisions.

Research

TM Grade Crypto API: Turn Market Noise into One Clear Signal

Token Metrics Team
6 min read

Cluttered charts and whipsaw price action make it hard to act with conviction. The Token Metrics Grade Crypto API turns that noise into a single, opinionated signal you can build on—ideal for trading bots, dashboards, and research tools. In this guide, you’ll pull TM Grade in code, see how it powers products, and ship something useful in minutes. Start with the Get API Key, then Run Hello-TM in the docs and Clone a Template to go live fast.

What You’ll Build in 2 Minutes

  • A minimal script that fetches TM Grade from /v2/tm-grade for a given token (e.g., BTC).
  • An optional curl call to test the endpoint instantly.
  • A path to production using a copy-ready template (bot, dashboard, or screener).

(Mentioned endpoints you can add next: /v2/trading-signals, /v2/price-prediction, /v2/resistance-support.)

Why This Matters

One score, clear decision. TM Grade distills technicals, sentiment, and momentum into a single, interpretable value from Strong Sell → Strong Buy. Instead of juggling indicators, you get an opinionated, trade-ready signal you can rank, alert on, and route into strategies.

Built for builders. Developers integrate TM Grade to filter universes, power dashboards, or trigger bots—with predictable performance and a schema designed for programmatic use. Pair it with webhooks and caching to slash latency and polling costs.

Where to Find

In the top right of the API Reference you can find the curl request for your desired language. This is what you can use to access the TM Grade endpoint.

‍👉 Get API KeyRun Hello-TM Live Demo & Templates

How It Works (Under the Hood)

TM Grade blends multiple evidence streams—technical momentum, market structure, sentiment, and other model inputs—into a single normalized score (e.g., 0–100) and a label (Strong Sell to Strong Buy). This opinionated synthesis is what separates TM Grade from raw market data: it’s designed to be actionable.

Polling vs webhooks. For screens and dashboards, lightweight polling (or cached fetches) is fine. For trading agents and alerting, use webhooks or short polling with backoff and caching to cut latency and call volume. Combine TM Grade with endpoints like /v2/trading-signals for timing or /v2/resistance-support for risk placement.

Production Checklist

  • Rate limits: Know your plan caps; add client-side throttling.
  • Retries/backoff: Exponential backoff + jitter; avoid thundering herd.
  • Idempotency: Ensure repeated calls don’t double-execute downstream actions.
  • Caching: Short-TTL cache for reads (memory/Redis/KV); ETag if available.
  • Webhooks: Use signatures/secret validation; queue and retry on failure.
  • Pagination/Bulk: If fetching many symbols, batch requests with pagination.
  • Error catalog: Map 4xx/5xx to user-visible fixes; log status, payload, and request ID.
  • Observability: Track p95/p99 latency and error rate per endpoint; alert on spikes.

Use Cases & Patterns

  • Bot Builder (Headless): Filter tradable universes to Strong Buy/Buy, then confirm with timing from /v2/trading-signals before placing orders.
  • Dashboard Builder (Product): Show TM Grade on token pages with badges, color states, and last-updated timestamps; add S/R lines for context.
  • Screener Maker (Lightweight Tools): Build a Top-N by TM Grade list with sector filters; cache results and add one-click alerts.
  • Research/Allocation: Surface grade trends (rising/falling) to inform rebalances and risk budgets.
  • Community/Discord: Post grade changes to channels; rate-limit announcements and link to token detail views.

Next Steps

  • Get API Key — start free and generate a key in seconds.
  • Run Hello-TM — verify your first successful call.
  • Clone a Template — ship a bot, dashboard, or screener today.

Watch the demo: VIDEO_URL_HERE

Compare plans: When you’re ready to scale, review API plans.

Why Choose Token Metrics for Your Crypto API?

  • Battle-tested reliability trusted by thousands of builders and traders worldwide.
  • Rich endpoints: access trading signals, price prediction, resistance/support, and more from one source.
  • Fast onboarding: generate an API key and go live with production use cases in minutes.
  • Comprehensive documentation and ready-to-use templates for major frameworks.
  • Backed by 24/7 expert support and continuous data/model improvements.

FAQs

1) What does the TM Grade API return?

A JSON payload with fields like symbol, score (e.g., 0–100), and a categorical grade from Strong Sell to Strong Buy, designed for programmatic ranking, filtering, and display.

2) How fast is it? Do you have latency/SLOs?

TM endpoints are engineered for reliability with predictable latency. For mission-critical bots, add short-TTL caching and webhooks to minimize round-trips and jitter.

3) Can I use TM Grade in trading bots?

Yes. Many developers use TM Grade to pre-filter tokens and pair it with /v2/trading-signals for entries/exits. Always backtest and paper-trade before going live.

4) How accurate is TM Grade?

TM Grade is an opinionated model synthesizing multiple inputs. Backtests are illustrative—not guarantees. Use it as one component in a diversified strategy with risk controls.

5) Do you have SDKs and examples?

Yes—JavaScript and Python examples above, plus quickstarts and templates in the docs: Run Hello-TM.

6) Polling vs webhooks—what should I pick?

Dashboards: cache + light polling. Bots/alerts: prefer webhooks (or event-driven flows) to reduce latency and API usage.

7) Pricing, limits, and enterprise SLAs?

You can start free and scale up as you grow. See API plans for rate limits and tiers. Enterprise options and SLAs are available—contact us.

Choose from Platinum, Gold, and Silver packages
Reach with 25–30% open rates and 0.5–1% CTR
Craft your own custom ad—from banners to tailored copy
Perfect for Crypto Exchanges, SaaS Tools, DeFi, and AI Products