Back to blog
Research

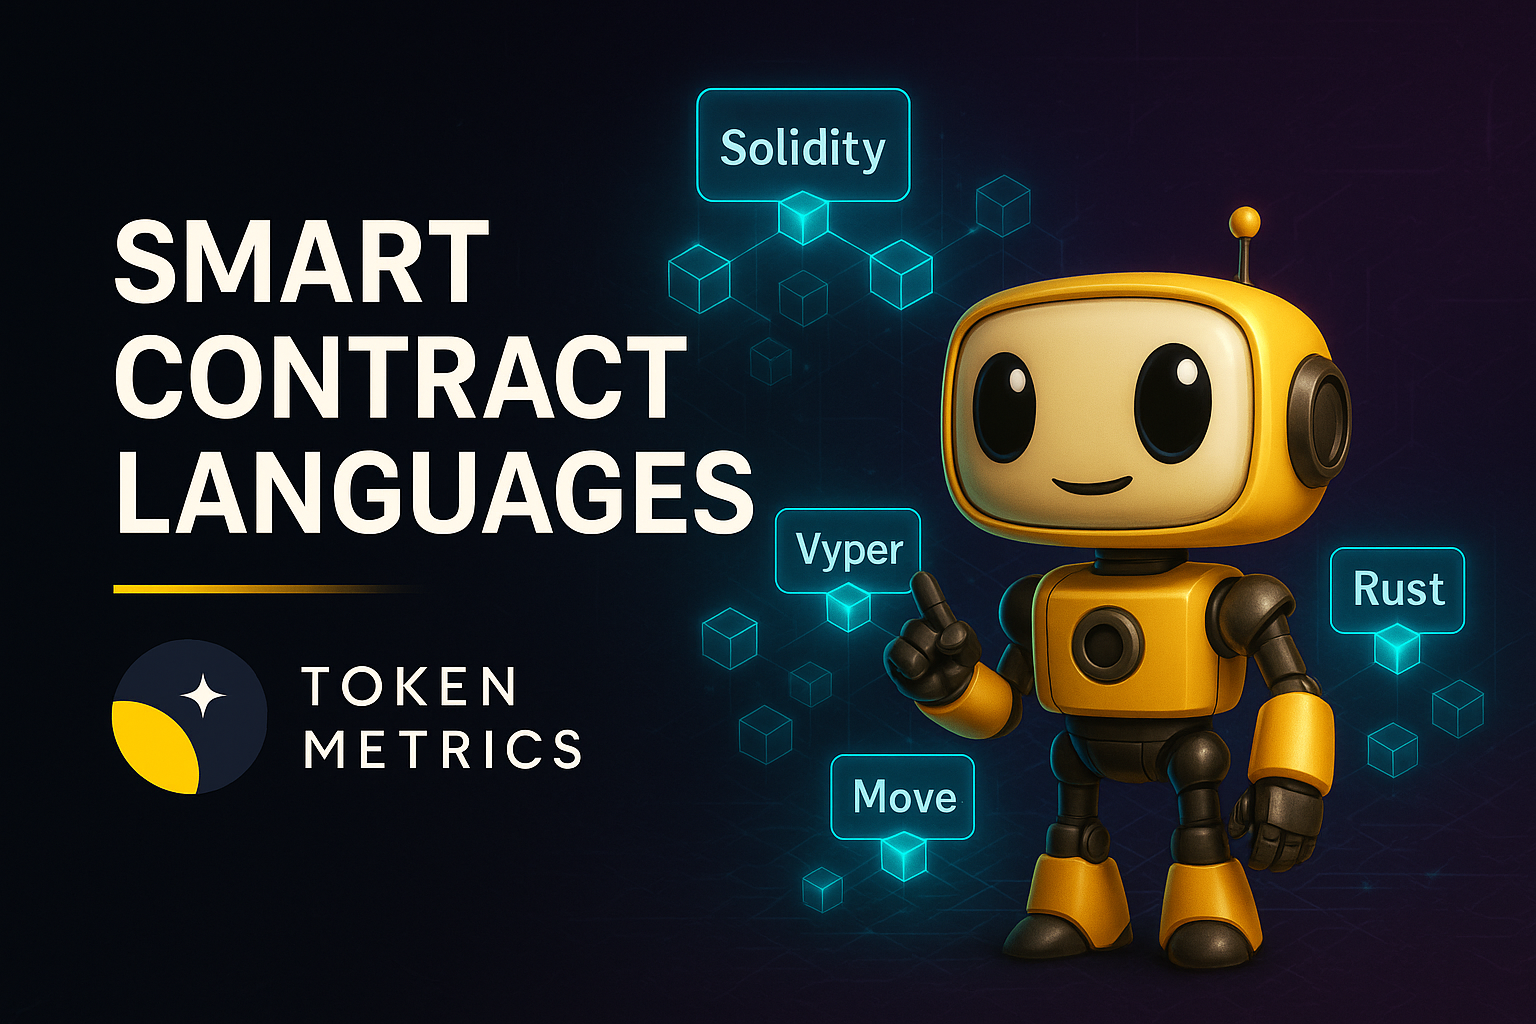
What Languages Are Used for Smart Contract Development?

Explore the diverse programming languages used for smart contracts in blockchain development in 2025, and learn how AI tools like Token Metrics support informed decisions.
Token Metrics Team
8 min read
Want Smarter Crypto Picks—Free?
See unbiased Token Metrics Ratings for BTC, ETH, and top alts.
Thank you! Your submission has been received!
Oops! Something went wrong while submitting the form.
 No credit card | 1-click unsubscribe

Smart contracts have revolutionized blockchain technology by enabling self-executing agreements that automatically enforce terms without intermediaries. As decentralized applications (dApps) continue to gain widespread adoption in 2025, understanding the programming languages behind these powerful tools becomes essential for developers, investors, and blockchain enthusiasts alike.

Understanding Smart Contract Programming

Smart contracts are computer programs stored on blockchain networks that execute automatically when predetermined conditions are met. Unlike traditional contracts requiring lawyers, banks, or notaries, smart contracts eliminate intermediaries, reducing costs, delays, and human error. However, their immutable nature means vulnerabilities cannot be patched post-deployment, making language choice and security paramount.

The blockchain ecosystem has evolved significantly, with multiple specialized programming languages emerging to address unique challenges like security, gas efficiency, and on-chain execution. While traditional languages like Python and JavaScript excel in conventional software development, blockchain requires purpose-built languages optimized for decentralized environments.

Solidity: The Industry Standard

Solidity remains the most widely used smart contract programming language in 2025, primarily designed for the Ethereum Virtual Machine (EVM) and EVM-compatible blockchains. Created specifically for blockchain applications, Solidity has become the de facto standard for smart contract development.

Solidity is a high-level, statically-typed language with syntax similar to JavaScript, making it accessible for developers transitioning from traditional web development. Its object-oriented approach supports inheritance, libraries, and complex user-defined types, providing developers with powerful tools for creating sophisticated decentralized applications.

The Solidity Compiler v0.8.30 was recently released as a maintenance release in preparation for the Pectra Ethereum network upgrade scheduled for May 7, 2025, demonstrating the language's continued evolution and strong community support.

The language's extensive ecosystem includes comprehensive documentation, numerous learning resources, and a massive developer community. Major projects like Uniswap, Aave, and OpenSea are built using Solidity, solidifying its position as the go-to language for Ethereum-based development.

Vyper: Security-First Alternative

Vyper is the second most widely used Web3 programming language, featuring Python-like syntax with strong typing and efficient bytecode generation. Designed as a simpler, more secure alternative to Solidity, Vyper prioritizes code readability and auditability.

Vyper deliberately eliminates complex features like function overloading and inheritance to reduce attack surfaces and enhance security. While this security-first approach requires developers to work around certain limitations, it significantly minimizes unexpected behaviors and vulnerabilities.

Vyper's clean, concise syntax appeals to Python developers entering the Web3 space, though its smaller ecosystem and fewer features compared to Solidity mean it has less widespread adoption. However, for projects where security and code clarity are paramount, Vyper presents an excellent choice.

Rust: High-Performance Blockchain Development

Rust has emerged as the primary language for Solana blockchain development, known for its memory safety, performance, and efficiency. Solana processes over 65,000 transactions per second in 2025, requiring programs that deliver exceptional efficiency and security.

Rust's unique ownership model ensures memory safety without garbage collection, making it both fast and secure for blockchain applications. Beyond Solana, Rust powers other major blockchain projects including Polkadot's Substrate framework, Near Protocol, and Elrond.

The language's systems-level capabilities make it ideal for blockchains requiring high throughput and low latency. While Rust has a steeper learning curve than Solidity, its performance advantages and growing ecosystem make it increasingly popular among blockchain developers.

Move: Asset-Oriented Programming

Move is a revolutionary smart contract language originally developed for the Diem blockchain, designed specifically around asset ownership and transfers. The language provides first-class abstractions for assets, making programming safer and more efficient.

Move's innovative approach treats digital assets as first-class citizens in the programming model, providing built-in safety guarantees around ownership and scarcity similar to physical assets. The language enables programmable transaction blocks that can call up to 1,024 separate Move functions in a single transaction, significantly improving gas efficiency and code simplicity.

Currently powering blockchains like Sui and Aptos, Move represents a paradigm shift in how developers think about asset management and smart contract security.

Emerging Smart Contract Languages

Tact is designed specifically for TON blockchain development, offering simple, intuitive syntax optimized for performance and resource utilization. Its clean design reduces smart contract development complexity while maintaining efficiency.

Clarity is a non-Turing-complete programming language introduced for the Stacks blockchain, designed to prevent various smart contract hacks through its limited computational model. While less flexible than Turing-complete languages, this approach enhances security.

Yul and Yul+ are intermediate languages for Ethereum that translate straightforwardly to bytecode, excelling at optimizing smart contracts and reducing gas costs. Yul+ extends Yul with additional features for advanced developers seeking maximum performance.

Choosing the Right Language

When selecting a smart contract programming language, developers should consider several critical factors:

  • Security Features: Languages must prioritize type safety, memory management, and built-in protective measures to prevent vulnerabilities that could lead to exploits.
  • Platform Compatibility: Different blockchains support different languages. Ethereum and EVM-compatible chains use Solidity, while Solana requires Rust.
  • Performance Requirements: High-throughput applications benefit from languages like Rust and Move, while standard dApps may perform well with Solidity.
  • Developer Experience: Consider your existing programming knowledge and the availability of learning resources, documentation, and community support.
  • Ecosystem Maturity: Established languages like Solidity offer more libraries, tools, and developer support compared to newer alternatives.

Making Informed Investment Decisions with Token Metrics

As smart contract development evolves across multiple blockchains and programming languages, staying informed about the crypto ecosystem becomes increasingly complex. This is where Token Metrics emerges as a game-changing platform for traders and investors.

Discover Crypto Gems with Token Metrics AI

Token Metrics uses AI-powered analysis to help you uncover profitable opportunities in the crypto market. Get Started For Free

Token Metrics is an AI-powered cryptocurrency analytics and trading intelligence platform that provides data-driven insights, trading signals, and research tools. The platform consolidates research, portfolio management, and real-time analytics into a comprehensive solution for navigating the volatile crypto market.

Token Metrics delivers AI ratings (0-100 Trader and Investor Grades), automated index portfolios, smart contract audits, risk flags, and an AI chatbot agent for instant token research. In March 2025, Token Metrics launched integrated on-chain trading, transforming the platform into an end-to-end solution connecting research with execution.

Whether you're evaluating projects built on Ethereum with Solidity, Solana programs written in Rust, or emerging Move-based protocols, Token Metrics provides the analytical depth needed to make informed investment decisions. The platform's AI-driven approach processes vast datasets instantaneously, identifies market trends before they materialize, and offers customizable alerts to help traders respond to opportunities in real-time.

The Future of Smart Contract Development

The smart contract landscape continues to evolve rapidly in 2025. WebAssembly (Wasm) is enabling developers to write smart contracts in mainstream languages like JavaScript, TypeScript, and Python, potentially lowering barriers to entry for blockchain development.

As the industry matures, we're seeing increased focus on security, formal verification, and developer tooling. Languages like Vyper and Move demonstrate how language design can proactively prevent entire classes of vulnerabilities. Meanwhile, established languages like Solidity continue innovating with regular updates and improvements.

For developers entering the space, starting with Solidity provides access to the largest ecosystem and most learning resources. Those interested in high-performance chains should explore Rust for Solana development. Python developers might find Vyper's familiar syntax appealing, while those seeking cutting-edge asset-oriented programming can investigate Move.

Conclusion

Smart contract programming languages are the foundation of the blockchain revolution, each offering unique strengths tailored to specific use cases and platforms. From Solidity's industry dominance to Rust's high-performance capabilities and Move's innovative asset model, developers have more options than ever for building secure, efficient decentralized applications.

As the ecosystem continues expanding, staying informed about both technical developments and market opportunities becomes essential. Platforms like Token Metrics provide the analytical tools needed to navigate this complex landscape, combining AI-powered insights with comprehensive data to help traders and investors make smarter decisions in the dynamic world of cryptocurrency.

Whether you're a developer choosing your next language to learn or an investor evaluating blockchain projects, understanding the programming foundations behind smart contracts provides crucial context for participating in the decentralized future being built today.

Build Smarter Crypto Apps &
AI Agents in Minutes, Not Months
Real-time prices, trading signals, and on-chain insights all from one powerful API.
Grab a Free API Key
About Token Metrics
Token Metrics: AI-powered crypto research and ratings platform. We help investors make smarter decisions with unbiased Token Metrics Ratings, on-chain analytics, and editor-curated “Top 10” guides. Our platform distills thousands of data points into clear scores, trends, and alerts you can act on.
30 Employees
analysts, data scientists, and crypto engineers
Daily Briefings
concise market insights and “Top Picks”
Transparent & Compliant
Sponsored ≠ Ratings; research remains independent
Want Smarter Crypto Picks—Free?
See unbiased Token Metrics Ratings for BTC, ETH, and top alts.
Thank you! Your submission has been received!
Oops! Something went wrong while submitting the form.
 No credit card | 1-click unsubscribe
Token Metrics Team
Token Metrics Team

Recent Posts

Research

Bittensor Price Prediction 2025-2027 | TAO Forecast & Analysis

Token Metrics Team
7 min read

Understanding Bittensor's Speculative Nature

Bittensor operates as a community-driven token where price action stems primarily from social sentiment, attention cycles, and speculative trading rather than fundamental value drivers. TAO exhibits extreme volatility with no defensive characteristics or revenue-generating mechanisms typical of utility tokens. Token Metrics price prediction scenarios below provide technical forecasts across different market cap environments, though meme and speculative tokens correlate more strongly with viral trends and community engagement than systematic market cap models. Positions in TAO should be sized as high-risk speculative bets with potential for total loss.


Disclosure
Educational purposes only, not financial advice. Crypto is volatile, do your own research and manage risk.

How to read our price prediction methodology: Each band blends cycle analogues and market-cap share math with TA guardrails. Base assumes steady adoption and neutral or positive macro. Moon layers in a liquidity boom. Bear assumes muted flows and tighter liquidity. For speculative tokens, actual price prediction outcomes depend heavily on social trends and community momentum beyond what market cap models capture.

Bittensor (TAO) Price Prediction: TM Agent Baseline

Token Metrics long term price prediction view for Bittensor, cashtag $TAO. Lead metric first, Token Metrics TM Grade is 62%, Hold, and the trading signal is bullish, indicating modest project fundamentals and short-term upward momentum. Market context, Bitcoin direction and appetite for AI and research-oriented crypto projects determine capital flows into niche tokens like $TAO, so broader risk-on conditions would help sustained gains.

Concise 12-month price prediction numeric view: Token Metrics scenarios cluster roughly between $0.45 and $2.20, with a base case near $1.05, reflecting current network usage, developer activity, and token supply dynamics. Implication, if AI crypto interest and on-chain usage grow materially $TAO could approach the upper bound, while in a risk-off market or if network adoption stalls it would likely move toward the lower bound.

  • 16T: At 16 trillion, the range is $5,539.08, $6,710.41, and $7,881.74.

Token Details 

Key Takeaways

  • Highly speculative asset driven by sentiment and attention rather than fundamentals.
  • Scenario driven price predictions, outcomes hinge on total crypto market cap and viral momentum.
  • Extreme volatility characteristic - TAO can experience double-digit percentage moves daily.
  • TM Agent gist: conditions and usage growth could expand the upper range, risk-off or weak adoption could compress outcomes.
  • Entertainment risk only, not financial advice.

Bittensor Price Prediction: Scenario Analysis

Token Metrics price prediction scenarios provide technical price bands across market cap tiers:

  • 8T Price Prediction: At 8 trillion total crypto market cap, TAO projects to $2,129.86 (bear), $2,520.30 (base), and $2,910.75 (moon).
  • 16T Price Prediction: At 16 trillion, the range is $5,539.08, $6,710.41, and $7,881.74.
  • 23T Price Prediction: At 23 trillion, scenarios show $8,948.30, $10,900.52, and $12,852.74.
  • 31T Price Prediction: At 31 trillion, projections reach $12,357.53, $15,090.63, or $17,823.73.

These technical price prediction ranges assume speculative tokens maintain market cap share proportional to overall crypto growth. Actual outcomes for speculative tokens typically exhibit higher variance and stronger correlation to social trends than these models predict.

What Is Bittensor?

Bittensor is a decentralized network focused on machine learning markets, where participants contribute and consume AI services. Unlike utility tokens with broad real-world use cases, TAO operates in a niche AI context and often trades as a speculative community symbol.

TAO is the network token used for incentives and participation. Market performance depends heavily on broader interest in AI‑related crypto themes and community engagement around the project.

Risks That Skew Bearish on TAO Price Predictions

  • Extreme volatility from pure sentiment-driven price action with no fundamental support.
  • Attention cycles shift rapidly, leaving early viral tokens abandoned as new memes emerge.
  • Liquidity can evaporate quickly during downturns, creating severe slippage and exit difficulty.
  • Regulatory scrutiny may target speculative tokens as securities or gambling instruments.
  • Macro risk-off environments hit speculative assets hardest, with meme coins showing largest drawdowns.
  • Community fragmentation or developer abandonment can eliminate remaining narrative support.

FAQs About Bittensor Price Prediction

Will TAO 10x from here?

Yes, at a current price of $427.67, a 10x reaches $4,276.70. This level appears in the 16T bear and above price prediction scenarios. Meme and speculative tokens can 10x rapidly during viral moments but can also lose 90%+ just as quickly. Position sizing for potential total loss is critical. Not financial advice.

What are the biggest risks to TAO price predictions?

Primary risks include attention shifting to newer narratives, community fragmentation, developer abandonment, regulatory crackdowns, and liquidity collapse during downturns. Unlike utility tokens with defensive characteristics, TAO has no fundamental floor. Price can approach zero if community interest disappears. Total loss is a realistic outcome.


Next Steps

Disclosure

Educational purposes only, not financial advice. TAO is a highly speculative asset with extreme volatility and high risk of total loss. Speculative tokens operate as entertainment and gambling instruments rather than investments. Only allocate capital you can afford to lose entirely. Do your own research and manage risk appropriately.

About Token Metrics

Token Metrics is a cutting-edge crypto analytics and research platform that offers ratings, price predictions, and unique AI-driven insights for investors.

Research

Polkadot Price Prediction 2027 | DOT Forecast & Scenarios

Token Metrics Team
7 min read

Understanding Polkadot's 2027 Potential

The Layer 1 competitive landscape is consolidating as markets reward specialization over undifferentiated "Ethereum killers". Polkadot positions itself in a multi-chain world through shared security and parachain interoperability. Infrastructure maturity around custody and bridges makes alternate L1s more accessible into 2026.

The price prediction scenario projections below map different market share outcomes for DOT across varying total crypto market sizes. Base cases assume Polkadot maintains current ecosystem momentum, while moon scenarios factor in accelerated adoption, and bear cases reflect increased competitive pressure.


Disclosure
Educational purposes only, not financial advice. Crypto is volatile, do your own research and manage risk.

How to read our price prediction methodology:
Each band blends cycle analogues and market-cap share math with TA guardrails. Base assumes steady adoption and neutral or positive macro. Moon layers in a liquidity boom. Bear assumes muted flows and tighter liquidity.

Polkadot (DOT) Price Prediction: TM Agent Baseline

Token Metrics long term price prediction view for Polkadot, cashtag $DOT. Lead metric first, Token Metrics TM Grade is 71%, Buy, and the trading signal is bullish, which indicates above-average project quality, and positive short-term momentum. Market context, Bitcoin's trend and institutional flows into layer-1 ecosystems remain the dominant macro drivers, so $DOT's performance will track risk-on cycles and parachain adoption.

Concise 12-month price prediction numeric view: Token Metrics scenarios cluster roughly between $4.50 and $22, with a base case near $11, reflecting continued parachain activity, cross-chain integrations, and ecosystem growth. Implication, if the broader market enters a sustained bull phase and Polkadot adoption accelerates, $DOT could test the upper bound. In a prolonged risk-off environment or slower parachain uptake, it would likely drift toward the lower bound.

Polkadot Token Details 

Buy DOT on Gemini

Affiliate Disclosure: We may earn a commission from qualifying purchases made via this link, at no extra cost to you.

Key Takeaways

  • Scenario driven price predictions, outcomes hinge on total crypto market cap, higher liquidity and adoption lift the bands.
  • TM Agent gist: range $4.50 to $22 with a base near $11, upside requires adoption and liquidity, downside ties to risk-off.
  • Education only, not financial advice.

Polkadot Price Prediction: Scenario Analysis

Token Metrics price prediction scenarios span four market cap tiers, each representing different levels of crypto market maturity and liquidity:

  • 8T Price Prediction: At an eight trillion dollar total crypto market cap, DOT projects to $4.31 in bear conditions, $4.85 in the base case, and $5.39 in bullish scenarios.
  • 16T Price Prediction: Doubling the market to sixteen trillion expands the range to $6.82 (bear), $8.44 (base), and $10.07 (moon).
  • 23T Price Prediction: At twenty-three trillion, the scenarios show $9.33, $12.04, and $14.75 respectively.
  • 31T Price Prediction: In the maximum liquidity scenario of thirty-one trillion, DOT could reach $11.84 (bear), $15.63 (base), or $19.43 (moon).

Each tier assumes progressively stronger market conditions, with the base case reflecting steady growth and the moon case requiring sustained bull market dynamics.

Why Consider the Indices with Top-100 Exposure

Polkadot represents one opportunity among hundreds in crypto markets. Token Metrics Indices bundle DOT with top one hundred assets for systematic exposure to the strongest projects. Single tokens face idiosyncratic risks that diversified baskets mitigate.

Historical index performance demonstrates the value of systematic diversification versus concentrated positions. Join the early access list

Join the early access list

What Is Polkadot?

Polkadot is a network designed to connect specialized blockchains, called parachains, to a central Relay Chain for shared security and interoperability. Its architecture aims to enable cross-chain messaging and upgrades without hard forks.

DOT is the native token, used for staking to secure the network, on-chain governance, and bonding to add new parachains. Developers and users interact across parachains for use cases spanning DeFi, infrastructure, and cross-chain applications.

Token Metrics AI Analysis

Token Metrics AI provides comprehensive context on Polkadot's positioning and challenges.

Vision: Polkadot's vision is to create a decentralized web where independent blockchains can operate securely while communicating and sharing data across networks. It aims to enable a fully interoperable and scalable ecosystem that supports innovation in decentralized technologies.

Problem: The blockchain space faces fragmentation, with networks operating in isolation, limiting data and value transfer. This siloed structure hampers scalability, security, and user experience. Polkadot addresses the need for cross-chain communication and shared security, allowing blockchains to benefit from collective strength without sacrificing autonomy.

Solution: Polkadot uses a relay chain to coordinate a network of parachains, each with specialized functionality. It employs a nominated proof-of-stake (NPoS) consensus mechanism to secure the network and enable governance. Parachains lease slots via auctions, allowing projects to build custom blockchains with shared security and interoperability. The system supports cross-chain message passing, enabling data and asset transfers between different blockchains.

Market Analysis: Polkadot operates in the layer-0 and interoperability segment, competing with platforms like Cosmos and emerging multi-chain ecosystems. It differentiates itself through shared security, on-chain governance, and a robust parachain model. Adoption is driven by developer interest, parachain diversity, and integration with DeFi, NFTs, and enterprise solutions. Market conditions for Polkadot are influenced by broader crypto trends, regulatory developments, and execution of its technological roadmap. While it ranks among major smart contract platforms, it faces strong competition from Ethereum and high-throughput chains like Solana. Price and adoption depend on network usage, ecosystem growth, and macroeconomic factors in the crypto market.

Catalysts That Skew Bullish for DOT Price Predictions

  • Institutional and retail access expands with ETFs, listings, and integrations.
  • Macro tailwinds from lower real rates and improving liquidity.
  • Product or roadmap milestones such as upgrades, scaling, or partnerships.

Risks That Skew Bearish on DOT Price Predictions

  • Macro risk-off from tightening or liquidity shocks.
  • Regulatory actions or infrastructure outages.
  • Concentration or validator economics and competitive displacement.

FAQs About Polkadot Price Prediction

Will DOT hit $15 by 2027?

The 31T base case price prediction shows DOT at $15.63, which exceeds $15. The 23T moon case at $14.75 does not reach $15. Outcome depends on total crypto market cap growth and Polkadot maintaining market share. Not financial advice.

Can DOT 10x from current levels?

At current price of $3.10, a 10x would reach $31.0. None of the price prediction scenarios, with a high of $19.43 in the 31T moon case, reaches that level by 2027. 10x returns would require substantially greater market cap expansion. Not financial advice.

What price could DOT reach in the moon case?

Moon case price predictions range from $5.39 at 8T to $19.43 at 31T. These scenarios assume maximum liquidity expansion and strong Polkadot adoption. Not financial advice.

Next Steps

Disclosure

Educational purposes only, not financial advice. Crypto is volatile, do your own research and manage risk.

Why Use Token Metrics for Polkadot Price Prediction Investing?

Actionable AI-driven Ratings: Access live Token Metrics grades and signals for Polkadot and hundreds of crypto assets.

Scenario Forecasting: Visualize DOT upside and downside with rigorous price prediction scenario math, not unsubstantiated hype.

Portfolio Diversification: Token Metrics Indices let you systematically diversify among top projects, mitigating single-token risk.

Start your Polkadot price prediction research with institutional-grade tools from Token Metrics.

Research

Mantle (MNT) Price Prediction 2027 | Token Metrics Analysis

Token Metrics Team
7 min read

Mantle (MNT) Price Prediction: Portfolio Context for MNT - Diversification in the 2027 Landscape

Layer 2 tokens like Mantle offer exposure to Ethereum's scaling roadmap, but with concentration risk around one specific L2's adoption trajectory. MNT performance depends heavily on Mantle winning rollup market share against competing L2s. Diversified L2 exposure or broader L1 and L2 baskets reduce the risk of backing the wrong scaling solution.

Token Metrics price prediction scenarios below project MNT ranges across market environments. These outcomes assume Mantle maintains relevance as Ethereum scales, but portfolio theory suggests hedging this bet by holding multiple L2s or allocating to Ethereum itself, which benefits from L2 success regardless of which specific rollup dominates.

Disclosure

Educational purposes only, not financial advice. Crypto is volatile, do your own research and manage risk.

How to read it: Each band blends cycle analogues and market-cap share math with TA guardrails. Base assumes steady adoption and neutral or positive macro. Moon layers in a liquidity boom. Bear assumes muted flows and tighter liquidity.

TM Agent baseline: Token Metrics long term view for Mantle, cashtag $MNT. Lead metric first, Token Metrics TM Grade is 68%, Buy, and the trading signal is bullish, indicating positive short-term momentum and above-average project quality. Concise 12-month numeric view, price prediction scenarios cluster roughly between $0.70 and $3.40, with a base case near $1.60.

Token Details 

Key Takeaways

  • Scenario driven, outcomes hinge on total crypto market cap, higher liquidity and adoption lift the bands.
  • Single-asset concentration amplifies both upside and downside versus diversified approaches.
  • Fundamentals: Fundamental Grade 81.62% (Community 72%, Tokenomics 100%, Exchange 100%, VC —, DeFi Scanner 100%).
  • Technology: Technology Grade 78.22% (Activity 64%, Repository 70%, Collaboration 71%, Security —, DeFi Scanner 100%).
  • TM Agent gist: bullish signal, 12‑month range roughly $0.70 to $3.40 with base near $1.60.
  • Education only, not financial advice.

Scenario Analysis - MNT Price Prediction Models

Token Metrics price prediction scenarios span four market cap tiers, each representing different levels of crypto market maturity and liquidity:

  • 8T: At an 8 trillion dollar total crypto market cap, MNT projects to $3.16 in bear conditions, $3.73 in the base case, and $4.30 in bullish scenarios.
  • 16T: Doubling the market to 16 trillion expands the price prediction range to $6.27 (bear), $7.99 (base), and $9.71 (moon).
  • 23T: At 23 trillion, the price prediction scenarios show $9.38, $12.25, and $15.12 respectively.
  • 31T: In the maximum liquidity scenario of 31 trillion, MNT price prediction could reach $12.49 (bear), $16.51 (base), or $20.52 (moon).

These ranges illustrate potential outcomes for concentrated MNT positions, but investors should weigh whether single-asset exposure matches their risk tolerance or whether diversified strategies better suit their objectives.

The Case for Diversified Index Exposure

Portfolio theory teaches that diversification is the only free lunch in investing. MNT concentration violates this principle by tying your crypto returns to one protocol's fate. Token Metrics Indices blend Mantle with the top one hundred tokens, providing broad exposure to crypto's growth while smoothing volatility through cross-asset diversification. This approach captures market-wide tailwinds without overweighting any single point of failure.

Systematic rebalancing within index strategies creates an additional return source that concentrated positions lack. As some tokens outperform and others lag, regular rebalancing mechanically sells winners and buys laggards, exploiting mean reversion and volatility. Single-token holders miss this rebalancing alpha and often watch concentrated gains evaporate during corrections while index strategies preserve more gains through automated profit-taking.

Beyond returns, diversified indices improve the investor experience by reducing emotional decision-making. Concentrated MNT positions subject you to severe drawdowns that trigger panic selling at bottoms. Indices smooth the ride through natural diversification, making it easier to maintain exposure through full market cycles.

Get early access

What Is Mantle?

Mantle is a blockchain project focused on scaling Ethereum via layer 2 rollup technology. The goal is to enable faster and cheaper transactions while inheriting Ethereum security. It targets scalable and efficient infrastructure for decentralized applications and financial services.

The MNT token powers network economics such as fees, incentives, or governance depending on implementation. Users interact with dApps and bridges within the ecosystem, and Mantle competes among leading Ethereum scaling solutions.

Token Metrics AI Analysis

  • Vision: Mantle aims to build a scalable, secure, and self-sustaining blockchain ecosystem that leverages decentralized governance and treasury-backed financial innovation. Its vision emphasizes capital efficiency, leveraging restaking for security, and fostering long-term sustainability through community-driven development and treasury utilization.
  • Problem: Many blockchain platforms face trade-offs between scalability, security, and capital efficiency. High transaction costs and network congestion on Ethereum, combined with fragmented liquidity and underutilized treasury assets in DAOs, create friction for developers and users. Mantle addresses the challenge of efficiently deploying capital while maintaining robust security and enabling rapid, low-cost transactions for decentralized applications.
  • Solution: Mantle implements an Ethereum Layer 2 network using optimistic rollup technology to reduce fees and increase throughput. It integrates EigenLayer for security via restaking, allowing its treasury to earn yield and contribute to network validation. The ecosystem supports native governance through its token and funds development via a large DAO-managed treasury, aiming to create a self-sustaining cycle of innovation and user incentives.
  • Market Analysis: Mantle operates in the competitive Layer 2 and modular blockchain space, competing with established networks like Arbitrum, Optimism, and emerging restaking platforms. Its differentiation lies in the integration of a large treasury with restaking, aiming to bootstrap security and ecosystem growth simultaneously. Adoption is driven by developer activity, yield opportunities, and strategic partnerships within the broader Ethereum ecosystem. Market risks include execution challenges in treasury management, regulatory scrutiny on DAO structures, and strong competition from other scaling solutions. While not a market leader like Ethereum or Bitcoin, Mantle participates in the broader narrative of modular, restaked, and treasury-driven blockchains, which have gained traction in 2024-2025.

Fundamental and Technology Snapshot from Token Metrics

  • Fundamental Grade: 81.62% (Community 72%, Tokenomics 100%, Exchange 100%, VC —, DeFi Scanner 100%).
  • Technology Grade: 78.22% (Activity 64%, Repository 70%, Collaboration 71%, Security —, DeFi Scanner 100%).

Catalysts That Skew Bullish

  • Institutional and retail access expands with ETFs, listings, and integrations.
  • Macro tailwinds from lower real rates and improving liquidity.
  • Product or roadmap milestones such as upgrades, scaling, or partnerships.

Risks That Skew Bearish

  • Macro risk-off from tightening or liquidity shocks.
  • Regulatory actions or infrastructure outages.
  • Concentration or validator economics and competitive displacement.
  • Protocol-specific execution risk and competitive pressure from alternatives.

FAQs

Can MNT reach $10?

Based on the price prediction scenarios, MNT could reach $10 in the higher tiers. The 23T tier projects $12.25 in the base case, and the 31T tier shows $12.49 (bear), $16.51 (base), and $20.52 (moon). Achieving this requires both broad market cap expansion and Mantle maintaining competitive position. Not financial advice.

What's the risk/reward profile for MNT?

Risk and reward spans from $3.16 at 8T bear to $20.52 at 31T moon. Downside risks include competitive pressure among L2s and execution challenges, while upside drivers include adoption growth and liquidity expansion. Concentrated positions amplify both tails, while diversified strategies smooth outcomes.

What gives MNT value?

MNT accrues value through network usage, fees, incentives, and governance tied to Mantle's L2 ecosystem. Demand drivers include dApp activity, bridging, and security via restaking integrations. While these fundamentals matter, diversified portfolios capture value accrual across multiple tokens rather than betting on one protocol's success.

Where can I find Mantle price predictions?

Token Metrics provides comprehensive Mantle (MNT) price predictions through scenario-based analysis spanning multiple market cap tiers. Our data-driven price prediction models incorporate fundamental grades, technology scores, and market conditions to project potential MNT price targets across bear, base, and moon scenarios.

Next Steps

Disclosure

Educational purposes only, not financial advice. Crypto is volatile, concentration amplifies risk, and diversification is a fundamental principle of prudent portfolio construction. Do your own research and manage risk appropriately.

Why Investors Choose Token Metrics

Token Metrics provides data-driven crypto ratings, on-chain grades, and scenario-based targets—empowering you to make informed investment decisions with confidence. Accelerate your research with unique AI-powered analysis and risk management tools.

Choose from Platinum, Gold, and Silver packages
Reach with 25–30% open rates and 0.5–1% CTR
Craft your own custom ad—from banners to tailored copy
Perfect for Crypto Exchanges, SaaS Tools, DeFi, and AI Products