Research

What’s the Best Time to Trade Cryptocurrency?

Discover the best times to trade crypto based on global market overlaps, news events, and volatility. Learn how Token Metrics’ AI tools help you time your trades effectively.
Token Metrics Team
8 min
MIN

Cryptocurrency trading is a 24/7 market—unlike stocks, there’s no opening or closing bell. This leads many traders to wonder: “When is the best time to trade cryptocurrency?”

The truth is, timing your trades can make a huge difference in profitability. Trading during periods of high liquidity or increased volatility can provide better opportunities, while poorly timed trades can lead to slippage and losses.

In this guide, we’ll explore the best times to trade crypto, how different time zones affect price movements, and how Token Metrics can help you identify the right moments to enter or exit trades using AI-powered insights.

Why Timing Matters in Crypto Trading

Even though the crypto market never sleeps, trading activity is not equal throughout the day.

  • High liquidity: When more traders are active, spreads are tighter, making it easier to enter and exit trades at good prices.
  • Volatility opportunities: Price swings create profit potential—but also risk.
  • Market overlaps: When multiple regions are active, volume surges.

Knowing when the market is most active can help you reduce trading fees, minimize slippage, and maximize your gains.

The Best Times to Trade Cryptocurrency

1. Overlap Between U.S. and European Markets (1:00 PM – 5:00 PM UTC)

The busiest period for crypto trading is when U.S. and European sessions overlap.

  • Why?

    • The U.S. is home to major crypto exchanges and institutional traders.
    • Europe contributes significant trading volume and liquidity.

  • Benefits:

    • Higher volatility for short-term traders.
    • Tighter spreads for efficient execution.

This overlap often sees the biggest price movements of the day—perfect for day traders and scalpers.

2. Early U.S. Trading Hours (12:00 PM – 3:00 PM UTC)

The start of the U.S. session brings increased activity from institutional investors and retail traders waking up to market news.

  • Best for:

    • News-based trades (after U.S. economic announcements).
    • Entering/exiting positions with high liquidity.

3. Weekend Volatility (Saturday & Sunday)

Crypto is unique because weekend trading can be extremely volatile due to:

  • Lower liquidity (fewer institutional players).
  • Retail-driven price movements.

  • Who benefits:

    • Swing traders looking for sharp moves.
    • Those willing to tolerate higher risk for bigger gains.

4. After Major News & Events

The “best time” isn’t always about the clock—it’s about market catalysts.

  • Regulatory updates.
  • Exchange announcements.
  • Macro events (interest rate changes, economic data).

These events can cause instant surges or drops—great for traders who react quickly.

Does the Day of the Week Matter?

Yes. Research shows:

  • Mondays & Fridays: Often more volatile as traders adjust positions before/after the weekend.
  • Midweek (Tuesday–Thursday): Tends to have steady, higher trading volumes.

For swing traders, entering positions midweek may reduce erratic weekend exposure.

How Token Metrics Helps You Trade at the Right Time

Timing trades isn’t just about watching charts—it’s about analyzing multiple data points in real time. That’s where Token Metrics gives you a powerful edge.

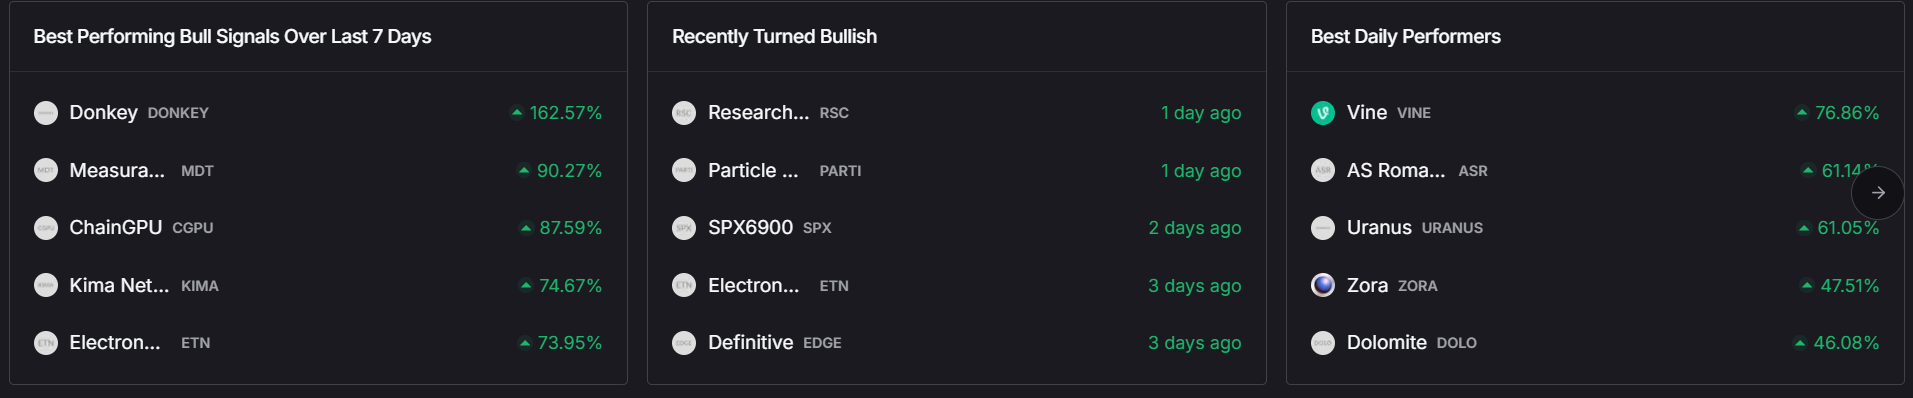
1. AI-Powered Trading Signals

Get real-time bullish and bearish alerts based on 80+ data points, helping you know when to enter or exit trades confidently.

2. Narrative Tracking

Our AI monitors emerging crypto narratives (AI tokens, DeFi, RWA, etc.) so you can act before the crowd—crucial for timing market moves.

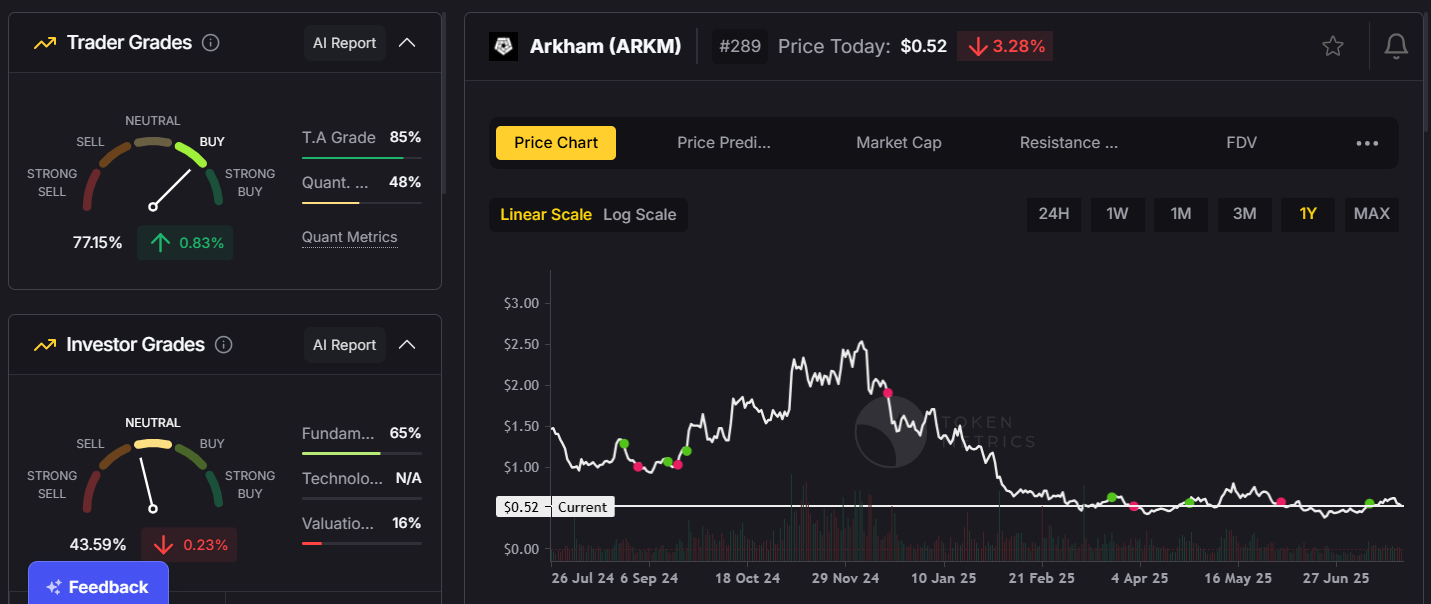
3. Trader & Investor Grades

Use Trader Grades for short-term opportunities and Investor Grades for long-term positions, aligning your trades with market momentum.

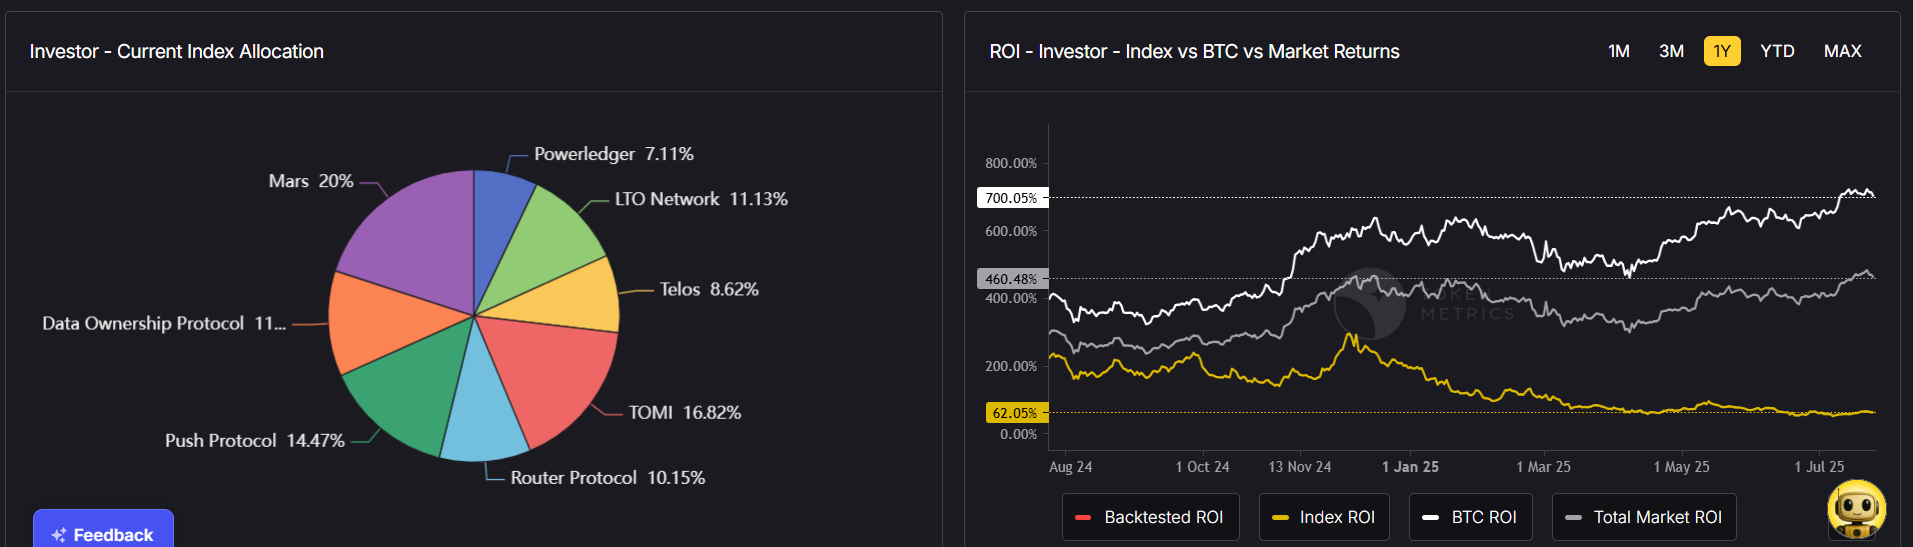
4. AI-Driven Indices

Don’t want to time trades manually? Token Metrics offers auto-managed crypto indices that rebalance based on AI-identified market conditions.

Tips for Timing Crypto Trades

  1. Trade During High Liquidity Windows: Overlaps between U.S. and European sessions are best.
  2. Watch for News: Major announcements can create rapid price moves—be ready.
  3. Avoid Low-Volume Hours: Late-night trading (UTC) often has higher slippage.
  4. Use AI for Precision: Let Token Metrics guide entry and exit points with data-backed insights.
  5. Set Alerts: Use Token Metrics’ customizable alerts for price, grades, and signals so you never miss an opportunity.

Example: Using Token Metrics for Timing

Imagine you’re planning to trade Ethereum. Instead of guessing when to enter:

  • You use Token Metrics Trader Grades to spot when ETH has strong short-term potential.
  • You set AI-powered alerts for price changes and bullish signals.
  • You execute your trade during the U.S.-EU overlap when liquidity is highest—reducing slippage and maximizing efficiency.

This data-driven approach takes the guesswork out of timing.

Final Thoughts

So, what’s the best time to trade cryptocurrency?

  • Weekdays during the U.S.-EU overlap (1:00–5:00 PM UTC) offer the best liquidity and volatility.
  • Early U.S. hours and weekends can also present opportunities—but with higher risks.
  • Major news events often create the best entry/exit windows.

But the truth is, there’s no universal “perfect time.” The real key is using data-driven insights to trade at your best time—when probabilities are in your favor.

That’s why Token Metrics is essential for traders. With AI-powered trading signals, narrative tracking, and portfolio management tools, Token Metrics helps you time the market intelligently, not emotionally.

Whether you’re a day trader chasing volatility or a long-term investor, Token Metrics puts the right data at your fingertips—so you can trade with confidence, anytime.

Build Smarter Crypto Apps &
AI Agents in Minutes, Not Months
Real-time prices, trading signals, and on-chain insights all from one powerful API.
Grab a Free API Key
Token Metrics Team
Token Metrics Team

Recent Posts

Announcements

Introducing the Customizable Ratings Page for Best Crypto Opportunities

Token Metrics Team
7 minutes
MIN

Are you looking for a way to personalize your crypto investing experience like never before? Do you want to have access to a wealth of data and insights that can help you make smarter and faster investment decisions? If so, you’re going to love our latest innovation: the Customizable Ratings Page.

The Customizable Ratings Page is a powerful tool that allows you to tailor your Token Metrics dashboard according to your preferences and goals. You can choose from an expanded selection of columns and metrics, apply advanced filters, and save your preferred layout for future use. This way, you can have a streamlined and efficient interface that shows you exactly what you need to know about various cryptocurrencies.

In this blog post, we’ll show you how the Customizable Ratings Page works and why it’s a game-changer for crypto investors.

How the Customizable Ratings Page Works

The Customizable Ratings Page is designed to give you more control and flexibility over your crypto investing journey. Here’s how it works:

  • First, log in to your Token Metrics account and go to the ratings page. You’ll see our default columns that show you our ratings, predictions, fundamentals, technology, technical analysis, correlation rank, volatility rank, market cap rank, price change rank, volume change rank, liquidity rank.
  • Next, click on the “Customize” button at the top right corner of the page. You’ll see a list of additional columns that you can add or remove from your dashboard. These include: market cap dominance rank (how dominant is a coin in terms of market cap), price prediction accuracy (how accurate are our price predictions), ROI since inception (how much return has a coin generated since its launch), ROI 30 days (how much return has a coin generated in the past 30 days), ROI 90 days (how much return has a coin generated in the past 90 days), ROI 365 days (how much return has a coin generated in the past year), risk-adjusted returns (how much return has a coin generated relative to its risk), Sharpe ratio (a measure of risk-adjusted returns), Sortino ratio (a measure of downside risk-adjusted returns), max drawdown (the maximum loss from peak to trough), annualized volatility (the standard deviation of annual returns), skewness (a measure of asymmetry of returns distribution), kurtosis (a measure of tail risk of returns distribution).
  • Then, drag and drop the columns to rearrange them according to your preference. You can also resize them by dragging their edges.
  • Finally, click on “Save” to save your customized layout. You can also click on “Reset” to go back to the default layout.

You can also use advanced filters to narrow down your search for specific coins or criteria. For example:

  • If you want to see only coins with high ratings (>80%), high fundamentals (>80%), high technology (>80%), low correlation (<0.5) with Bitcoin or Ethereum
  • If you want to see only coins with positive price predictions (>0%), positive price change (>0%), positive volume change (>0%), high liquidity (>80%)
  • If you want to see only coins with high ROI since inception (>1000%), high Sharpe ratio (>2), low max drawdown (<50%), low annualized volatility (<50%)

You can apply these filters by clicking on the filter icon next to each column header and entering your desired values or ranges.

The Game-Changer for Crypto Investors?

The Customizable Ratings Page is more than just a cosmetic upgrade. It’s a game-changer for crypto investors because it offers several benefits:

  • It helps you focus on what matters most: With so many data points and indicators available in crypto investing, it can be overwhelming and confusing to keep track of everything.
    The Customizable Ratings Page lets you focus on what matters most to you and your strategy, whether it’s fundamentals, technology, technical analysis, price predictions, risk-adjusted returns, or anything else. You can eliminate unnecessary noise and clutter and have a clear view of the information that drives your decisions.
  • It helps you discover new opportunities: With over 6000 cryptocurrencies in existence, it can be hard to find new opportunities that match your criteria and goals.
    The Customizable Ratings Page lets you discover new opportunities by applying advanced filters that sort through our vast database of coins. You can find hidden gems that meet your standards and expectations, whether you’re looking for high growth potential, low risk, or niche markets.
  • It helps you save time and effort: Crypto investing can be time-consuming and exhausting if you have to manually research and analyze every coin that catches your eye.
    The Customizable Ratings Page helps you save time and effort by providing you with a quick and easy way to compare and contrast different coins based on various metrics. You can see at a glance how each coin stacks up against others in terms of ratings, predictions, fundamentals, technology, technical analysis, risk-adjusted returns, and more.

Here's a great video to give you a better understanding of the Customizable Ratings Page:

With an expanded selection of columns and metrics, advanced filters, and saved preferences, we’re putting users in the driver’s seat when it comes to analyzing and selecting the best investment opportunities.

At Token Metrics, we’re committed to providing the best tools and resources for our customers to succeed in the ever-evolving world of cryptocurrencies. The Customizable Ratings Page is just another step in our mission to help you make well-informed investment decisions, tailored to your unique goals and strategies.

Crypto Basics

Cryptocurrency Analysis - How to Analyze Cryptocurrencies

Token Metrics Team
9 minutes
MIN

Crypto has indeed gained significant attention and has been a popular investment option in recent times. However, analyzing a cryptocurrency before investing is crucial to make informed decisions and minimize risks. In this article, we will help you understand the key factors that impact a cryptocurrency's price and demand. By doing so, we aim to make it easier for you to embark on your crypto journey with confidence.

But why is it essential to analyze a cryptocurrency before investing in the first place? The answer lies in the volatile nature of cryptocurrencies. The value of a cryptocurrency can fluctuate significantly within a short time, making it a high-risk investment option. By analyzing a cryptocurrency's underlying factors, you can gain insights into its potential risks and rewards, which can help you make more informed investment decisions. With that in mind, let's dive into the key factors that affect a cryptocurrency's value.

How to Analyze Cryptocurrencies?

There are two popular ways (or types) to analyze a cryptocurrency before investing in it.

  1. Fundamental analysis
  2. Technical analysis 

Fundamental Analysis of Cryptocurrency

Fundamental analysis is the starting point of understanding the history of any crypto asset you want to invest in. 

It involves getting to the Adam and Eve of an asset, the team behind the project, the price history, the white paper, the tokenomics of the crypto asset - the whole deal.

The sole purpose of performing this analysis is to understand if the asset is overvalued or undervalued. Having said that, fundamental analysis needs the support of technical analysis to predict the crypto asset completely. 

The most important factors to consider when performing the fundamental analysis are:

1. Reviewing the white paper

Every crypto asset is backed by a white paper demonstrating the objectives and other technical details. While some details might seem quite difficult to understand for casual investors, it’s crucial to learn about the vision and mission of the project. 

The white paper should clearly explain the goals of the project, how they plan to achieve these goals using their technology, and how the cryptocurrency will function in the market. 

One red flag is a white paper full of generic promises with no proper detailing. 

2. Know the Team behind the project

To estimate the project's future performance, try to get the details of the professional experience that the team holds. 

For this, you can scroll through the LinkedIn profiles of the technical or leadership staff. You can also check the crypto asset's "About Us" page to get the details of who is heading the project. 

If you don't find the identity of the founders and the team anywhere on the website or the internet, consider it a red flag in most cases. 

3. Learn about the leadership

Find the executive team that handles the financials, operations, and vision. Learning about who is leading the project can help you understand the success probability of the crypto asset. 

So, here are a few questions to consider when researching a crypto company’s leadership:

  • Do they have a history of successful leadership positions?
  • Are they reputable/well-known leaders?
  • Is their crypto history good or bad?
  • Are they publicly identified or anonymous?

4. Get to know the community

Crypto is a community-driven space. Knowing whether the project is pure hype and speculation or is genuinely trusted by a community can help you decide the success of a crypto asset. 

Join the community's Discord or Telegram channel to understand it better. No discussion means no growth. 

5. Understand the vision and mission of the project

Crypto assets should have a clear vision and mission if they are genuinely intending to grow.

They should have a direction and a road map and be well-organized in everything they do.

6. Reviewing the roadmap

Similar to traditional companies, cryptocurrencies should have a well-defined roadmap with specific goals and timelines. It is crucial to assess the roadmap before investing in a cryptocurrency to ensure that the asset has a clear path to success. Understanding how the cryptocurrency plans to achieve its goals is essential in making informed investment decisions.

If the goals outlined in the roadmap are too generic and lack specificity, it can be a red flag. Additionally, if the timelines are not well mapped out or appear unrealistic, it could indicate poor planning or execution, which can impact the cryptocurrency's long-term success.

7. Learn about the tokenomics of the project

Tokenomics refers to the economic principles that govern the supply, distribution, and circulation of a cryptocurrency. These principles significantly impact the price and long-term viability of a crypto asset. Understanding the supply and demand dynamics is crucial for investors looking to make informed decisions.

Similar to the stock market, the crypto market's price is influenced by the intersection of demand and supply. When demand exceeds supply, the price of a cryptocurrency tends to increase, and vice versa. Therefore, it is essential to consider the following three data points when evaluating a cryptocurrency investment opportunity:

  1. Circulating supply: This is the amount of cryptocurrency currently in circulation and available in the market. It is a critical factor in determining the current market value of a cryptocurrency.
  2. Total supply: This is the maximum amount of cryptocurrency that will ever be available, including tokens that are not yet in circulation. It is important to consider the total supply when evaluating the potential long-term value of a cryptocurrency.
  3. Maximum supply: Many cryptocurrencies have a mechanism to mint new tokens, and the maximum supply represents the upper limit of the number of tokens that will ever be in existence. Understanding the maximum supply is crucial in assessing the potential dilution of a cryptocurrency's value over time.

In summary, evaluating a cryptocurrency's supply dynamics is an essential aspect of making informed investment decisions. Understanding the circulating, total, and maximum supply of a cryptocurrency can provide valuable insights into its potential value and long-term viability.

8. Review the price history

Cryptocurrencies are known for their high volatility, but there are various factors that impact their price. Understanding these factors, such as token supply and marketing efforts, is crucial in determining the dependability of a cryptocurrency's price. Additionally, reviewing a cryptocurrency's price history can provide valuable insights into its growth or decline over time.

Analyzing price fluctuations in a given time period can help you determine whether a cryptocurrency is thriving or dying. For instance, if a cryptocurrency experienced a significant price spike but failed to recover over subsequent months or years, it could be a warning sign for investors. Similarly, market capitalization and trading volume are crucial indicators of a cryptocurrency's potential. If a cryptocurrency's market cap continues to decline over time, or if there is little trading volume, it may not be a viable investment option.

Technical Analysis of Cryptocurrency

Technical analysis of a crypto asset involves analyzing historical price and volume data to identify patterns and trends that can provide insight into future price movements.

Here are 5 factors to consider in the technical analysis of a crypto asset:

  1. Price charts and patterns: Technical analysis typically involves using price charts to identify trends and patterns. Common patterns include support and resistance levels, trend lines, and chart formations such as triangles and head-and-shoulders patterns.
  2. Volume: Volume refers to the number of cryptocurrency shares or units traded during a given period. High trading volume can indicate a strong trend, while low trading volume may suggest that a market is consolidating or lacks momentum.
  3. Moving averages: Moving averages are widely used in technical analysis. They are used to smooth out price fluctuations and identify trends. Popular moving averages include the simple moving average (SMA) and the exponential moving average (EMA).
  4. Oscillators: Oscillators are indicators that oscillate between two extremes, such as overbought and oversold conditions. Common oscillators used in technical analysis include the relative strength index (RSI) and the stochastic oscillator.
  5. Market sentiment: Market sentiment refers to investors' overall mood or attitude towards a particular cryptocurrency. Sentiment can be measured using various methods, such as social media sentiment analysis or surveys of market participants. Considering market sentiment when analyzing a crypto asset is important because it can impact price movements. 

Technical analysis can provide valuable insights into a cryptocurrency's price movements, but it requires expertise in the field. The term "technical" refers to the complex algorithms and charts used to analyze market trends and predict future price movements.

Therefore, it may be too complicated for casual investors who do not have a strong understanding of the underlying principles. Here at Token Metrics, we automated Technical Analysis for thousands of cryptocurrencies with the help of AI and Machine Learning.

Just visit the page of a crypto you want to analyze, click on "Trader" from the left menu, and then click on the "Resistance and Support Levels" tab to start analyzing.

The Bottom Line

A cryptocurrency analysis involves examining and verifying a lot of information about a digital asset.

To get the deepest understanding of an asset, you can start with a fundamental analysis followed by a technical analysis.

We, at Token Metrics, work hard to make all of these tools available to you with a click of a button, automated and powered by AI to help you analyze thousands of cryptocurrencies fast.

Crypto Basics

Golden Crossing Pattern - What It Is and How to Identify It?

Token Metrics Team
8 minutes
MIN

In the world of crypto trading, technical analysis is a popular method for predicting the future price movements. One of the most well-known term in technical indicators is the "golden cross," which occurs when the short-term moving average of a cryptocurrency's price crosses above its long term moving average. While this pattern is not a guaranteed predictor of future price increases, many traders use it as a part of their overall trading strategy.

In this blog post, we will explore the concept of the golden cross in more detail, including what it is, how it works, and some of the potential risks and strategies of using this pattern in cryptocurrency trading.

What is Golden Crossing?

Golden Crossing is a technical analysis term used in financial markets to describe a bullish trend signal that occurs when a shorter-term moving average crosses above a longer-term moving average. The term "golden" represents this crossover's positive sentiment among traders and investors.

What Does a Golden Crossing Indicate?

A Golden Cross occurs when a shorter-term moving average (such as the 50-day moving average) crosses above a longer-term moving average (such as the 200-day moving average).

This crossing is thought to indicate that the stock's price has been trending higher in the short term and is likely to continue in the longer term. This is considered a bullish signal in technical analysis.

How to Identify a Golden Cross?

To identify a Golden Cross on a chart, you will need to plot two moving averages with different periods. The most common combination used to identify a Golden Cross is the 50-day moving average and the 200-day moving average.

Here are the steps to identify a Golden Cross on a chart:

  1. Open a chart for the crypto asset you want to analyze.
  2. Select the time frame for the graph (e.g., daily, weekly, monthly).
  3. Plot the 50-day moving average and the 200-day moving average on the chart.
  4. Look for where the 50-day moving average crosses above the 200-day moving average.
  5. This point where the 50-day moving average crosses above the 200-day moving average is the Golden Cross.
Golden Crossing

Once you have identified the Golden Cross, you can use it as a signal to buy the crypto asset.

However, as we mentioned earlier, it is important to consider other factors before making an investment decision and not solely rely on a single technical analysis tool.

How to Use the Golden Cross Strategy?

The Golden Cross strategy is a technical analysis tool traders and investors use to identify potential buy signals in financial markets. Here are some steps to use the Golden Cross strategy:

  • Identify the Golden Cross: As we mentioned, the Golden Cross occurs when the shorter-term moving average (e.g., 50-day moving average) crosses above the longer-term moving average (e.g., 200-day moving average).
  • Confirm the signal: Traders and investors usually use other technical analysis tools to confirm the Golden Cross signal, such as the Relative Strength Index (RSI), Moving Average Convergence Divergence (MACD), or price patterns like support and resistance levels.
  • Consider fundamental analysis: It is essential to consider the fundamental analysis of the asset, such as earnings reports, financial statements, market trends, and economic indicators. The Golden Cross strategy should be one of many factors in your investment decision.
  • Plan the trade: Once you have identified the Golden Cross and confirmed the signal, you can plan your trade. Set your entry point, stop loss and target price based on your risk tolerance and investment goals.
  • Manage the trade: Monitoring the transaction regularly and adjusting your stop loss and target price based on market conditions is important. Traders and investors use trailing stop losses to protect their profits and manage risks.

Note: It is important to note that the Golden Cross strategy does not guarantee success, and traders and investors should always be aware of the risks involved in trading and investing. As with any trading strategy, conducting proper research, managing risk, and having a well-defined trading plan are essential.

7 Best Golden Cross Trading Strategies

Here are seven Golden Cross trading strategies that traders and investors can use to identify potential buy signals in financial markets:

  • Simple Golden Cross: This basic Golden Cross strategy occurs when the 50-day moving average exceeds the 200-day moving average. Traders use this strategy to identify a bullish trend and enter a long position.
  • Multiple Moving Averages: Traders can use various moving averages, such as the 20-day, 50-day, and 200-day moving averages, to confirm the Golden Cross signal. If all moving averages cross above each other, it can demonstrate a strong bullish trend.
  • Golden Cross with Relative Strength Index (RSI): Traders can use the RSI indicator to confirm the Golden Cross signal. If the RSI crosses above the 50 levels simultaneously with the Golden Cross, it can indicate a strong bullish trend.
  • Golden Cross with Moving Average Convergence Divergence (MACD): Traders can use the MACD indicator to confirm the Golden Cross signal. If the MACD line crosses above the signal line simultaneously with the Golden Cross, it can indicate a strong bullish trend.
  • Golden Cross with Support and Resistance Levels: Traders can use support and resistance levels to confirm the Golden Cross signal. If the asset’s price breaks above a key resistance level simultaneously with the Golden Cross, it can indicate a strong bullish trend.
  • Golden Cross with Volume: Traders can use volume to confirm the Golden Cross signal. If the asset’s price exceeds the moving averages with high volume, it can indicate a strong bullish trend.
  • Golden Cross with Candlestick Patterns: Traders can use candlestick patterns, such as bullish engulfing or morning star patterns, to confirm the Golden Cross signal. If a bullish candlestick pattern forms at the same time as the Golden Cross, it can indicate a strong bullish trend.

Some Classic Examples Of Golden Cross

Here are some examples of Golden Cross signals that have occurred in financial markets:

  • Bitcoin (BTC): In April 2019, Bitcoin experienced a Golden Cross signal when the 50-day moving average crossed above the 200-day moving average. This signal indicated a potential bullish trend in Bitcoin's price. Traders who entered a long position in Bitcoin at this point would have profited from the subsequent rise in Bitcoin's price.
  • Apple Inc. (AAPL): In April 2019, Apple's stock price experienced a Golden Cross signal when the 50-day moving average exceeded the 200-day moving average. This signal indicated a potential bullish trend in Apple's stock price. Traders who entered a long position would have profited from the subsequent Apple stock price rise.
  • Gold (XAU): In June 2019, Gold experienced a Golden Cross signal when the 50-day moving average crossed above the 200-day moving average. This signal indicated a potential bullish trend in Gold's price. Traders who entered a long position in Gold would have profited from the subsequent rise in Gold's price.

Observing past performance does not indicate future results, so conduct your research, understand the risks involved, and dive deep into investing. The Golden Cross signal is just one tool among many that traders and investors use to identify potential buy signals in financial markets.

Risks Associated With Golden Cross Strategy

Like any trading strategy, the Golden Cross strategy also comes with risks that traders and investors should be aware of:

  • False Signals: The Golden Cross signal does not guarantee future market performance. Traders and investors should research and analyze well before entering a trade, as false signals can occur.
  • Delayed Entry: The Golden Cross signal occurs after the start of a new trend, which means traders and investors who rely on this signal may enter the market later than those who use other indicators or strategies. This can result in missed opportunities or lower potential profits.
  • Market Volatility: The Golden Cross signal may be less effective during periods of market volatility, as the moving averages may cross frequently and produce false signals. Traders and investors should adjust their trading strategies to reflect current market conditions.
  • Whipsaw Effects: The Golden Cross signal may produce whipsaw effects, where the market reverses shortly after the signal. Traders and investors should use other technical analysis tools and risk management techniques to mitigate this risk.

This is why traders and investors should carefully consider the risks associated with the Golden Cross strategy and their own risk tolerance and investment objectives before using this strategy in financial markets.

The Bottom Line

All indicators, in general, are considered to show some ‘lag’, and that no indicator can actually predict the future. It is also observed that the golden cross often produces a false signal leading to regular failure in its predicting power.

Therefore, a golden cross should always be followed by confirmation from other signals and indicators before fixating on a trade. This is why we use more than 50 data points in our AI-based models to predict the cryptocurrency market correctly, here at Token Metrics.

The key to using golden cross - including additional filters and indicators - is to always use proper risk parameters and ratios. Remember that your risk-to-reward ratio has got to be in your favour to yield better results than just following the cross blindly.

Choose from Platinum, Gold, and Silver packages
Reach with 25–30% open rates and 0.5–1% CTR
Craft your own custom ad—from banners to tailored copy
Perfect for Crypto Exchanges, SaaS Tools, DeFi, and AI Products