Back to blog
Research

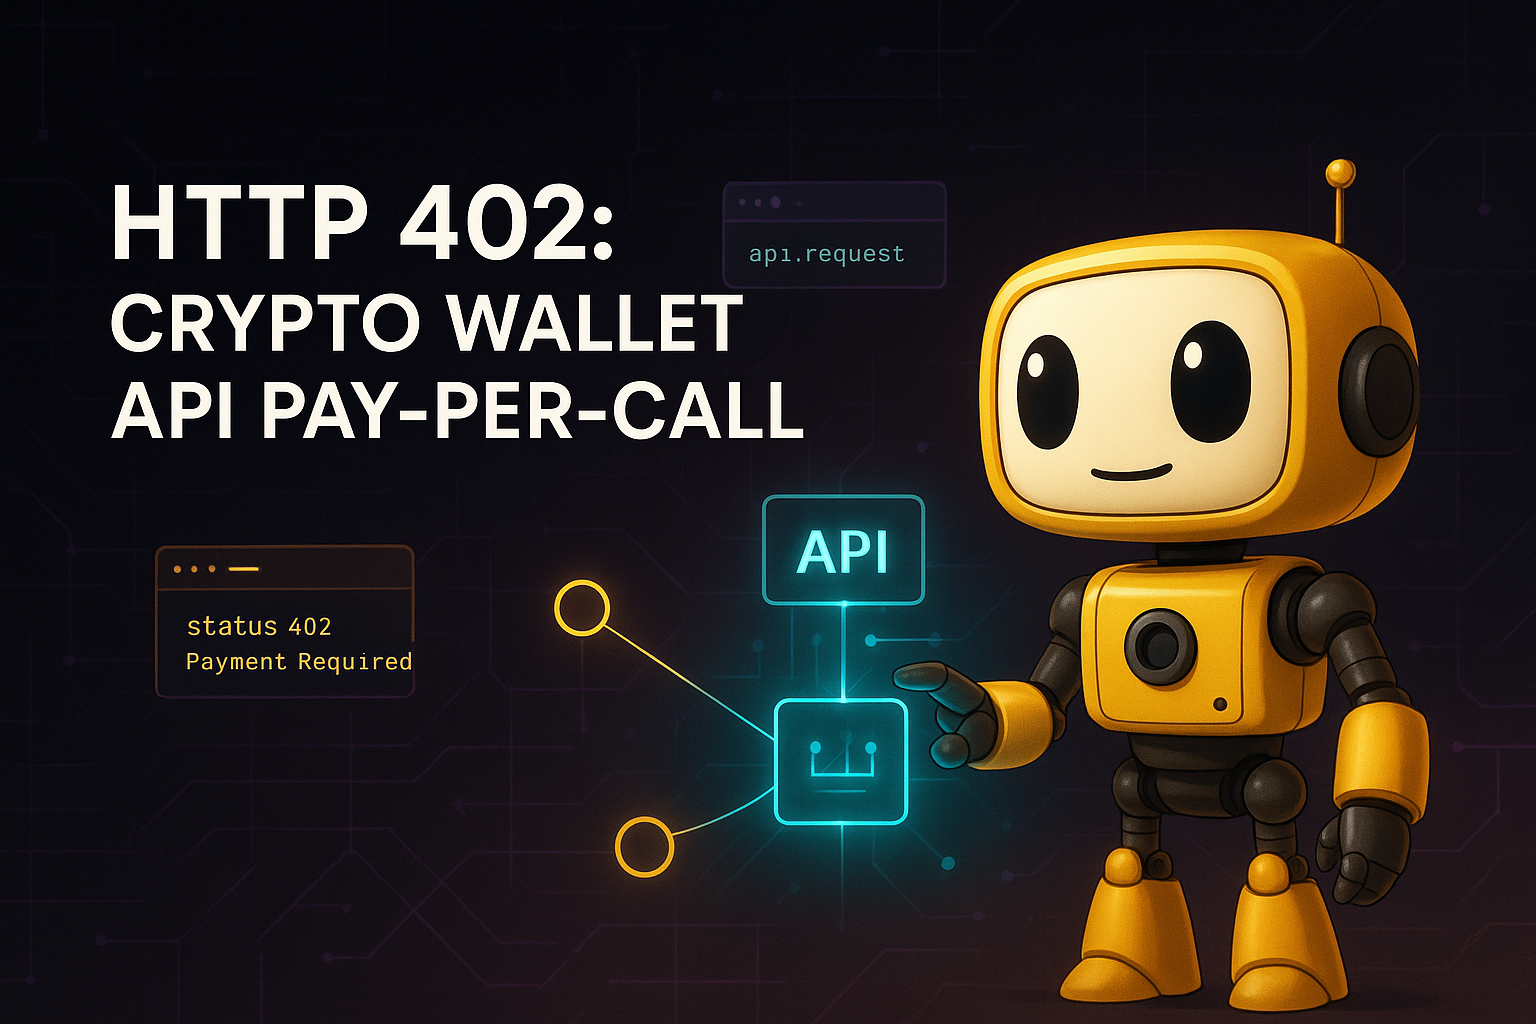
x402 & HTTP 402 Explained: Why Wallet-Paid API Calls Are Winning (and Where Token Metrics Fits)

The definitive guide to x402, the HTTP-native payment protocol enabling AI agents to pay for APIs per call. Includes ecosystem proof, technical implementation, and Token Metrics integration details.
Token Metrics Team
10 min read
Want Smarter Crypto Picks—Free?
See unbiased Token Metrics Ratings for BTC, ETH, and top alts.
Thank you! Your submission has been received!
Oops! Something went wrong while submitting the form.
 No credit card | 1-click unsubscribe

What Is x402?

x402 is an open-source, HTTP-native payment protocol developed by Coinbase that enables pay-per-call API access using crypto wallets. It leverages the HTTP 402 Payment Required status code to create seamless, keyless API payments.

It eliminates traditional API keys and subscriptions, allowing agents and applications to pay for exactly what they use in real time. It works across Base and Solana with USDC and selected native tokens such as TMAI.

Start using Token Metrics X402 integration here. https://www.x402scan.com/server/244415a1-d172-4867-ac30-6af563fd4d25 

TLDR — The x402 Value Proposition

x402 transforms API access by making payments native to HTTP requests.

Feature

Traditional APIs

x402 APIs

Authentication

API keys, tokens

Wallet signature

Payment Model

Subscription, prepaid

Pay-per-call

Onboarding

Sign up, KYC, billing

Connect wallet

Rate Limits

Fixed tiers

Economic (pay more = more access)

Commitment

Monthly/annual

Zero, per-call only

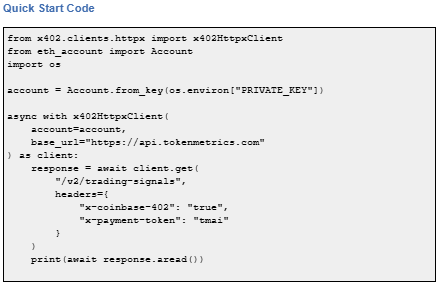
How to use it: Add x-coinbase-402: true header to any supported endpoint. Sign payment with your wallet. The API responds immediately after confirming micro-payment.

Token Metrics integration: All public endpoints available via x402 with per-call pricing from $0.017 to $0.068 USDC (10% discount with TMAI token).

Explore live agents: https://www.x402scan.com/composer.

How HTTP 402 Payment Required Works — Technical Deep Dive

The Protocol Flow

The HTTP 402 status code was reserved in HTTP/1.1 in 1997 for future digital payment use cases and was never standardized for any specific payment scheme. x402 activates this path by using 402 responses to coordinate crypto payments during API requests.

  1. Step by step: Client makes an API request with the header x-coinbase-402: true.
  2. The server can return 402 with payment details such as amount, recipient, and chain.
  3. The client wallet signs and submits the payment transaction.
  4. The server verifies the payment on-chain, then processes the original request and returns 200 with data.

Why this matters: It eliminates intermediary payment processors, enables true machine-to-machine commerce, and reduces friction for AI agents.

Ecosystem Proof: x402 Is Winning — Three Validation Points

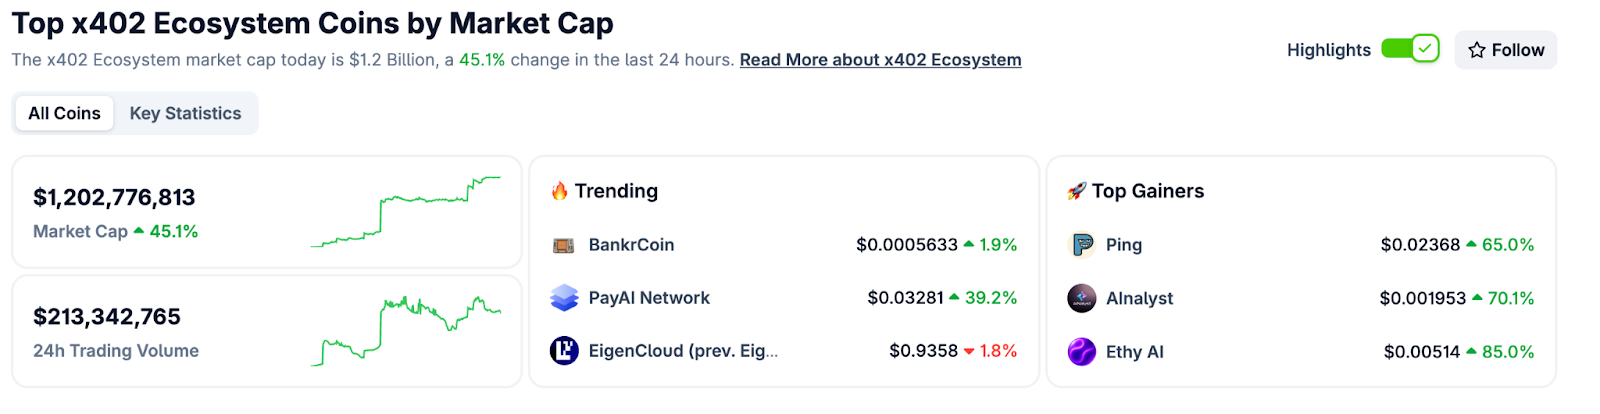
CoinGecko Recognition

CoinGecko launched a dedicated x402 Ecosystem category in October 2025, tracking 700+ projects with over $1 billion market cap and approximately $213 million in daily trading volume. Top performers include PING and Alnalyst, along with established projects like EigenCloud.


Base Network Adoption

Base has emerged as the primary chain for x402 adoption, with 450,000+ weekly transactions by late October 2025, up from near-zero in May. This growth demonstrates real agent and developer usage.

x402scan Composer — Where Agents Pay in Real Time

Composer is x402scan's sandbox for discovering and using AI agents that pay per tool call. Users can open any agent, chat with it, and watch tool calls and payments stream in real time.

Top agents include AInalyst, Canza, SOSA, and NewEra. The Composer feed shows live activity across all agents.


Explore Composer: https://x402scan.com/composer 

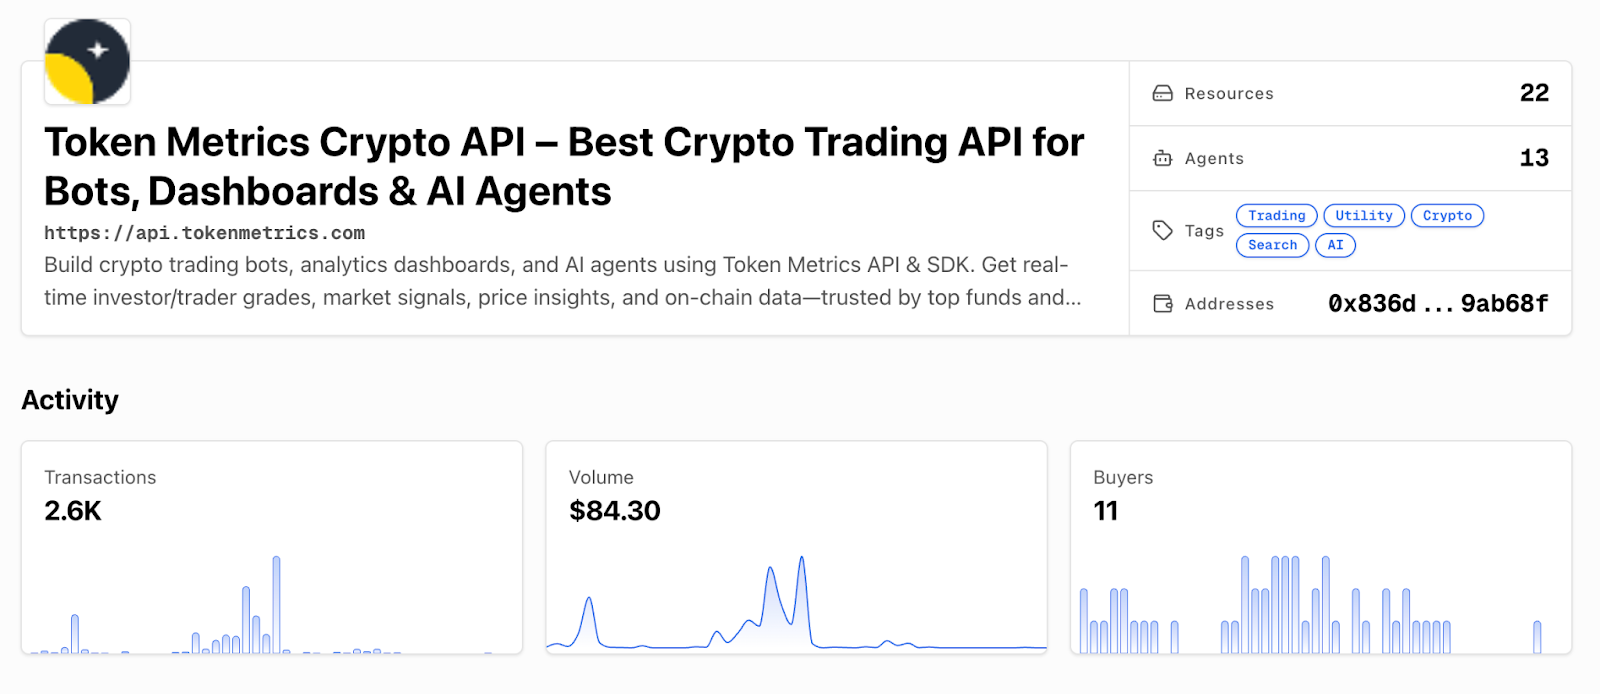
Token Metrics x402 Integration — Concrete Implementation

What We Ship

Token Metrics offers all public API endpoints via x402 with no API key required. Pay per call with USDC or TMAI for a 10 percent discount. Access includes trading signals, price predictions, fundamental grades, technology scores, indices data, and the AI chatbot.

Check out Token Metrics Integration on X402. https://www.x402scan.com/server/244415a1-d172-4867-ac30-6af563fd4d25 


Data as of October, 2025.

Pricing Tiers


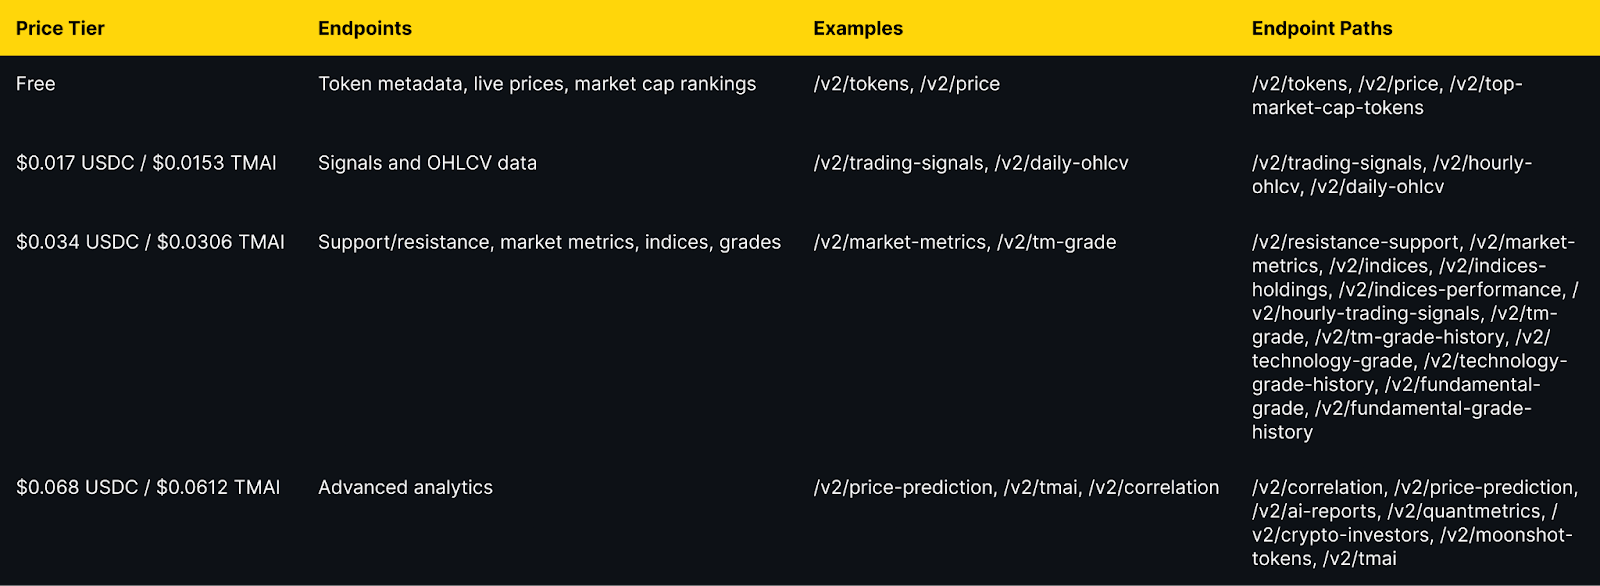
Important note: TMAI Spend Limit: TMAI has 18 decimals. Set max payment to avoid overspending. Example: 200 TMAI = 200 * (10 ** 18) in base units.

Full integration guide: https://api.tokenmetrics.com 

Why x402 Changes Everything for AI Agents

  • Eliminates onboarding friction. Agents can discover and use new APIs instantly without human intervention for API key management or billing setup.
  • Enables true agentic commerce. Agents pay for exactly what they use, which makes micro-transactions economically viable. This unlocks composition of multiple specialized services.
  • Aligns incentives. API providers get paid per call, users only pay for value received, and agents can optimize costs by choosing best-fit providers. Network effects accelerate as more endpoints adopt x402.

Use Cases Already Working

  • Crypto analytics agents: Pull Token Metrics data on demand to answer market questions, generate trade signals, or build custom dashboards.
  • Research automation: Chain together x402 endpoints like Twitter search, Tavily extract, Firecrawl, and Token Metrics to gather and structure data.
  • Portfolio management: Agents monitor positions, fetch real-time prices, calculate risk metrics, and execute rebalancing decisions using paid data sources.
  • Trading strategy backtests: Access historical OHLCV, grades, and signals data via x402 without committing to monthly subscriptions.
  • Multi-chain intelligence: Combine Base and Solana x402 services for cross-chain analysis and arbitrage discovery.

Ecosystem Participants and Tools

Active x402 Endpoints

Key endpoints beyond Token Metrics include Heurist Mesh for crypto intelligence, Tavily extract for structured web content, Firecrawl search for SERP and scraping, Twitter or X search for social discovery, and various DeFi and market data providers.

Infrastructure and Tools

  • x402scan: Explorer and analytics platform tracking all x402 activity across chains.
  • Composer: Hosted sandbox for discovering and using x402-enabled agents.
  • x402-axios and x402-httpx: Client libraries for Node.js and Python.
  • Coinbase Agent Kit: SDK integration for building x402-native agents.
  • LangChain connectors: Framework integration for agent workflows.

Common Questions About x402

How is x402 different from traditional API keys?

x402 uses wallet signatures instead of API keys. Payment happens per call rather than via subscription. No sign-up, no monthly billing, no rate limit tiers. You pay for exactly what you use.

Which chains support x402?

Currently Base and Solana. Most activity is on Base with USDC as the primary payment token. Some endpoints accept native tokens like TMAI for discounts.

Do I need to trust the API provider with my funds?

No. Payments are on-chain and verifiable. You approve each transaction amount. No escrow or prepayment is required.

What happens if a payment fails?

The API returns 402 Payment Required again with updated payment details. Your client retries automatically. You do not receive data until payment confirms.

Can I use x402 with existing API clients?

Yes, with x402 client libraries such as x402-axios for Node and x402-httpx for Python. These wrap standard HTTP clients and handle the payment flow automatically.

Getting Started Checklist

  1. Set up a wallet: Create a Base wallet with USDC or TMAI balance.
  2. Install x402 client: npm install x402-axios or pip install x402-httpx.
  3. Choose an endpoint: Browse x402scan or Composer for available APIs.
  4. Write minimal code: Add x-coinbase-402: true header to requests.
  5. Watch payments flow: Monitor transactions in your wallet and on x402scan feed.
  6. Optimize costs: Compare endpoint pricing, use TMAI for 10% discount, cache results when appropriate.

Token Metrics x402 Resources

What's Next for x402

Ecosystem expansion. More API providers adopting x402, additional chains beyond Base and Solana, standardization of payment headers and response formats.

Agent sophistication. As x402 matures, expect agents that automatically discover and compose multiple paid endpoints, optimize costs across providers, and negotiate better rates for bulk usage.

Disclosure

Educational content only, not financial advice. API usage and crypto payments carry risks. Verify all transactions before signing. Do your own research.

Frequently Asked Questions

Build Smarter Crypto Apps &
AI Agents in Minutes, Not Months
Real-time prices, trading signals, and on-chain insights all from one powerful API.
Grab a Free API Key
About Token Metrics
Token Metrics: AI-powered crypto research and ratings platform. We help investors make smarter decisions with unbiased Token Metrics Ratings, on-chain analytics, and editor-curated “Top 10” guides. Our platform distills thousands of data points into clear scores, trends, and alerts you can act on.
30 Employees
analysts, data scientists, and crypto engineers
Daily Briefings
concise market insights and “Top Picks”
Transparent & Compliant
Sponsored ≠ Ratings; research remains independent
Want Smarter Crypto Picks—Free?
See unbiased Token Metrics Ratings for BTC, ETH, and top alts.
Thank you! Your submission has been received!
Oops! Something went wrong while submitting the form.
 No credit card | 1-click unsubscribe
Token Metrics Team
Token Metrics Team

Recent Posts

Research

Cronos Price Prediction 2027: $0.10-$1.46 Target Analysis

Token Metrics Team
9 min read

Cronos Price Prediction: Portfolio Context for CRO in the 2027 Landscape

Layer 1 tokens like Cronos represent bets on specific blockchain architectures winning developer and user mindshare. CRO carries both systematic crypto risk and unsystematic risk from Cronos's technical roadmap execution and ecosystem growth. Multi-chain thesis suggests diversifying across several L1s rather than concentrating in one, since predicting which chains will dominate remains difficult.

The price prediction projections below show how CRO might perform under different market cap scenarios. While Cronos may have strong fundamentals, prudent portfolio construction balances L1 exposure across Ethereum, competing smart contract platforms, and Bitcoin to capture the sector without overexposure to any single chain's fate.

Disclosure

Educational purposes only, not financial advice. Crypto is volatile, do your own research and manage risk.

How to read this price prediction:

Each band blends cycle analogues and market-cap share math with TA guardrails. Base assumes steady adoption and neutral or positive macro. Moon layers in a liquidity boom. Bear assumes muted flows and tighter liquidity.

TM Agent baseline:

Token Metrics price prediction scenarios center roughly between $0.03 and $0.28, with a base case price target near $0.10, assuming steady ecosystem growth, continued cross-chain demand, and no major security incidents.

Live details: Token Details 

The Case for Diversified Index Exposure

Portfolio theory teaches that diversification is the only free lunch in investing. CRO concentration violates this principle by tying your crypto returns to one protocol's fate. Token Metrics Indices blend Cronos with the top one hundred tokens, providing broad exposure to crypto's growth while smoothing volatility through cross-asset diversification. This approach captures market-wide tailwinds without overweighting any single point of failure.

Systematic rebalancing within index strategies creates an additional return source that concentrated positions lack. As some tokens outperform and others lag, regular rebalancing mechanically sells winners and buys laggards, exploiting mean reversion and volatility. Single-token holders miss this rebalancing alpha and often watch concentrated gains evaporate during corrections while index strategies preserve more gains through automated profit-taking.

Beyond returns, diversified indices improve the investor experience by reducing emotional decision-making. Concentrated CRO positions subject you to severe drawdowns that trigger panic selling at bottoms. Indices smooth the ride through natural diversification, making it easier to maintain exposure through full market cycles.

Get early access

What Is Cronos?

Cronos is an EVM-compatible blockchain built to support decentralized applications with high throughput and low transaction costs. The network is designed to bridge the gap between crypto and traditional finance, offering interoperability with Ethereum and Cosmos ecosystems. Its focus on scalability and developer-friendly infrastructure aims to attract DeFi, NFT, and gaming projects.

CRO serves as the native utility token of the Cronos ecosystem, used for transaction fees, staking, and governance. It enables users to participate in network security, pay for smart contract execution, and access services within the Cronos DeFi ecosystem. Common usage patterns include staking for rewards, providing liquidity in DeFi protocols, and facilitating cross-chain transfers.

Key Takeaways for CRO Price Prediction

  • Scenario driven: price prediction outcomes hinge on total crypto market cap; higher liquidity and adoption lift the price targets
  • Single-asset concentration amplifies both upside and downside versus diversified approaches
  • Fundamentals: Fundamental Grade 72.71% (Community 55%, Tokenomics 60%, Exchange 100%, VC N/A, DeFi Scanner 83%)
  • Technology: Technology Grade 81.41% (Activity 64%, Repository 74%, Collaboration 82%, Security N/A, DeFi Scanner 83%)
  • TM Agent gist: Base price prediction near $0.10 amid steady growth
  • Education only, not financial advice

Cronos Price Prediction: Scenario Analysis

8T Market Cap Price Prediction:

At an 8 trillion dollar total crypto market cap, CRO price prediction projects to $0.14 in bear conditions, $0.29 in the base case, and $0.34 in bullish scenarios.

16T Market Cap Price Prediction:

Doubling the market to 16 trillion expands the price prediction range to $0.43 (bear), $0.57 (base), and $0.71 (moon).

23T Market Cap Price Prediction:

At 23 trillion, the price forecast scenarios show $0.62, $0.85, and $1.09 respectively.

31T Market Cap Price Prediction:

In the maximum liquidity scenario of 31 trillion, CRO price prediction could reach $0.81 (bear), $1.13 (base), or $1.46 (moon).


These price prediction ranges illustrate potential outcomes for concentrated CRO positions, but investors should weigh whether single-asset exposure matches their risk tolerance or whether diversified strategies better suit their objectives.

Fundamental and Technology Snapshot from Token Metrics

Fundamental Grade: 72.71% (Community 55%, Tokenomics 60%, Exchange 100%, VC N/A, DeFi Scanner 83%).


Technology Grade: 81.41% (Activity 64%, Repository 74%, Collaboration 82%, Security N/A, DeFi Scanner 83%).


Catalysts That Skew Bullish for Price Prediction

  • Institutional and retail access expands with ETFs, listings, and integrations
  • Macro tailwinds from lower real rates and improving liquidity
  • Product or roadmap milestones such as upgrades, scaling, or partnerships
  • These factors could push CRO toward higher price prediction targets

Risks That Skew Bearish for Price Prediction

  • Macro risk-off from tightening or liquidity shocks
  • Regulatory actions or infrastructure outages
  • Concentration in validator economics and competitive displacement
  • Protocol-specific execution risk and competitive pressure from alternatives
  • These factors could push CRO toward lower price prediction scenarios

FAQs: Cronos Price Prediction

Can CRO reach $1 according to price predictions?

Based on the price prediction scenarios, CRO could reach $1 in the 23T moon case where it projects to $1.09, and in the 31T scenarios where the base case is $1.13 and the moon case is $1.46. These price prediction outcomes require both broad market cap expansion and Cronos maintaining competitive position. Not financial advice.

What's the risk/reward profile for CRO price prediction?

Risk/reward in our price prediction model spans from $0.14 in the lowest bear case to $1.46 in the highest moon case. Downside risks include regulatory or infrastructure shocks and competitive displacement, while upside drivers include liquidity expansion and roadmap execution. Concentrated positions amplify both tails, while diversified strategies smooth outcomes.

What gives CRO value and impacts price predictions?

CRO accrues value through transaction fees, staking, and governance utility across the Cronos ecosystem. Demand drivers include DeFi activity, cross-chain usage, and network services. While these fundamentals matter for price predictions, diversified portfolios capture value accrual across multiple tokens rather than betting on one protocol's success.

What is the 2027 Cronos price prediction?

Based on Token Metrics analysis, the 2027 price prediction for Cronos centers around $0.10 in the base case, with potential for higher targets ($0.57-$1.13) in bullish scenarios if the total crypto market expands significantly. Moon case price predictions range up to $1.46 at maximum liquidity.

Next Steps

Disclosure
Educational purposes only, not financial advice. Crypto is volatile, concentration amplifies risk, and diversification is a fundamental principle of prudent portfolio construction. Do your own research and manage risk appropriately.

Research

Shiba Inu Price Prediction 2027: SHIB Forecast & Risk Warning

Token Metrics Team
6 min read

Shiba Inu Price Prediction: Understanding SHIB's Speculative Nature

Shiba Inu operates as a community-driven meme token where price action stems primarily from social sentiment, attention cycles, and speculative trading rather than fundamental value drivers. SHIB exhibits extreme volatility with no defensive characteristics or revenue-generating mechanisms typical of utility tokens. Token Metrics price prediction scenarios below provide technical price forecasts across different market cap environments, though meme tokens correlate more strongly with viral trends and community engagement than systematic market cap models. Positions in SHIB should be sized as high-risk speculative bets with potential for total loss.


Disclosure

Educational purposes only, not financial advice. Crypto is volatile, do your own research and manage risk.

How to read this price prediction:

Each band blends cycle analogues and market-cap share math with TA guardrails. Base assumes steady adoption and neutral or positive macro. Moon layers in a liquidity boom. Bear assumes muted flows and tighter liquidity. For meme tokens, actual price prediction outcomes depend heavily on social trends and community momentum beyond what market cap models capture.

TM Agent baseline:

Token Metrics TM Grade is 24.1%, Sell, with a bearish trading signal. The concise 12‑month numeric price prediction view centers between $0.000005 and $0.000035, with a base case price target near $0.000012.

TM Agent numeric view: scenarios center roughly between $0.000005 and $0.000035, with a base case near $0.000012.

Live details: Token Details 

Key Takeaways for SHIB Price Prediction

  • Highly speculative asset driven by sentiment and attention rather than fundamentals
  • Scenario driven: price prediction outcomes hinge on total crypto market cap and viral momentum
  • Extreme volatility characteristic - SHIB can experience double-digit percentage moves daily
  • TM Agent gist: Bearish short term, price prediction range $0.000005–$0.000035
  • Entertainment risk only, not financial advice

Shiba Inu Price Prediction: Scenario Analysis

Token Metrics price prediction scenarios provide technical price bands across market cap tiers:

8T Market Cap Price Prediction:

At 8 trillion total crypto market cap, SHIB price prediction projects to $0.041998 (bear), $0.042366 (base), and $0.042734 (moon).

16T Market Cap Price Prediction:

At 16 trillion total crypto market cap, SHIB price forecast projects to $0.043973 (bear), $0.045077 (base), and $0.046182 (moon).

23T Market Cap Price Prediction:

At 23 trillion total crypto market cap, SHIB price prediction projects to $0.045948 (bear), $0.047789 (base), and $0.049629 (moon).

  31T Market Cap Price Prediction:

At 31 trillion total crypto market cap, SHIB price prediction projects to $0.047923 (bear), $0.051050 (base), and $0.051307 (moon).

 These technical price prediction ranges assume meme tokens maintain market cap share proportional to overall crypto growth. Actual outcomes for speculative tokens typically exhibit higher variance and stronger correlation to social trends than these price prediction models predict.

What Is Shiba Inu?

Shiba Inu is a meme-born crypto project that centers on community and speculative culture. Unlike utility tokens with specific use cases, SHIB operates primarily as a speculative asset and community symbol. The project focuses on community engagement and entertainment value.

SHIB has demonstrated viral moments and community loyalty within the broader meme token category. The token trades on community sentiment and attention cycles more than fundamentals. Market performance depends heavily on social media attention and broader meme coin cycles.

Risks That Skew Bearish for Price Prediction

  • Extreme volatility from pure sentiment-driven price action with no fundamental support
  • Attention cycles shift rapidly, leaving early viral tokens abandoned as new memes emerge
  • Liquidity can evaporate quickly during downturns, creating severe slippage and exit difficulty
  • Regulatory scrutiny may target meme tokens as securities or gambling instruments
  • Macro risk-off environments hit speculative assets hardest, with meme coins showing largest drawdowns
  • Community fragmentation or developer abandonment can eliminate remaining narrative support
  • These factors could push SHIB price predictions toward the lower bear scenarios

Make Your Next Move with Token Metrics

Token Metrics provides technical analysis, scenario math, price prediction models, and rigorous risk evaluation for hundreds of crypto tokens. Want to dig deeper? Explore our powerful AI-powered ratings and scenario tools here.

FAQs: Shiba Inu Price Prediction

Will SHIB 10x from here according to price predictions?

At current price of $0.041027, a 10x reaches $0.41027. This level does not appear in any of the listed bear, base, or moon price prediction scenarios across 8T, 16T, 23T, or 31T tiers. Meme tokens can 10x rapidly during viral moments but can also lose 90%+ just as quickly. Position sizing for potential total loss is critical. Not financial advice.

What are the biggest risks to SHIB price predictions?

Primary risks include attention shifting to newer memes, community fragmentation, developer abandonment, regulatory crackdowns, and liquidity collapse during downturns. Unlike utility tokens with defensive characteristics, SHIB has zero fundamental floor. Price can approach zero if community interest disappears. Total loss is a realistic outcome that price prediction models cannot fully account for. Not financial advice.

What is the 2027 Shiba Inu price prediction?

Based on Token Metrics analysis, the 2027 price prediction for SHIB centers around $0.000012 in the base case under current market conditions. However, meme token price predictions are highly unreliable due to extreme dependence on social trends, viral cycles, and community sentiment that can change rapidly. These technical price prediction ranges should be viewed with extreme caution.

Can SHIB reach $0.01 according to price predictions?

Based on the price prediction scenarios across all market cap tiers (8T-31T), SHIB projections range from $0.041998 to $0.051307. While these technical price predictions show SHIB trading above $0.04, the extreme volatility and sentiment-driven nature of meme tokens means actual outcomes can vary dramatically from model projections. Not financial advice.


Next Steps

Track live data: Token Details

• Consider fundamental crypto assets with utility and defensive characteristics rather than pure speculation.

Disclosure

Educational purposes only, not financial advice. SHIB is a highly speculative asset with extreme volatility and high risk of total loss. Meme tokens operate as entertainment and gambling instruments rather than investments. Only allocate capital you can afford to lose entirely. Do your own research and manage risk appropriately.

Research

WhiteBIT Coin Price Prediction 2028: $40-$272 Target Analysis

Token Metrics Team
7 min read

WhiteBIT Coin Price Prediction: Portfolio Context for WBT in the 2028 Landscape

Exchange tokens like WhiteBIT Coin offer leveraged exposure to overall market activity, creating concentration risk around a single platform's success. While WBT can deliver outsized returns during bull markets with high trading volumes, platform-specific risks like regulatory action, security breaches, or competitive displacement amplify downside exposure. Portfolio theory suggests balancing such concentrated bets with broader sector exposure.

The price prediction scenarios below show how WBT might perform across different crypto market cap environments. Rather than betting entirely on WhiteBIT Coin's exchange succeeding, diversified strategies blend exchange tokens with L1s, DeFi protocols, and infrastructure plays to capture crypto market growth while mitigating single-platform risk.

The Case for Diversified Index Exposure

Portfolio theory teaches that diversification is the only free lunch in investing. WBT concentration violates this principle by tying your crypto returns to one protocol's fate. Token Metrics Indices blend WhiteBIT Coin with the top one hundred tokens, providing broad exposure to crypto's growth while smoothing volatility through cross-asset diversification. This approach captures market-wide tailwinds without overweighting any single point of failure.

Systematic rebalancing within index strategies creates an additional return source that concentrated positions lack. As some tokens outperform and others lag, regular rebalancing mechanically sells winners and buys laggards, exploiting mean reversion and volatility. Single-token holders miss this rebalancing alpha and often watch concentrated gains evaporate during corrections while index strategies preserve more gains through automated profit-taking.

Beyond returns, diversified indices improve the investor experience by reducing emotional decision-making. Concentrated WBT positions subject you to severe drawdowns that trigger panic selling at bottoms. Indices smooth the ride through natural diversification, making it easier to maintain exposure through full market cycles.

Get Early Acces


Disclosure

Educational purposes only, not financial advice. Crypto is volatile, do your own research and manage risk.

How to read this price prediction:

Each band blends cycle analogues and market-cap share math with TA guardrails. Base assumes steady adoption and neutral or positive macro. Moon layers in a liquidity boom. Bear assumes muted flows and tighter liquidity.

TM Agent baseline:

Token Metrics long term price prediction view for WhiteBIT Coin, cashtag $WBT. Lead metric first, Token Metrics TM Grade is 52.5%, Hold, and the trading signal is bearish, indicating short-term downward momentum. Concise 12-month numeric price prediction view: Token Metrics scenarios center roughly between $10 and $85, with a base case price target near $40.

Live details: Token Details

Key Takeaways for WBT Price Prediction

  • Scenario driven: price prediction outcomes hinge on total crypto market cap; higher liquidity and adoption lift the price bands
  • Single-asset concentration amplifies both upside and downside versus diversified approaches
  • Fundamentals: Fundamental Grade 52.35% (Community 82%, Tokenomics 60%, Exchange 50%, VC —, DeFi Scanner N/A)
  • TM Agent gist: Bearish momentum, 12-month price prediction range $10 to $85
  • Education only, not financial advice

WhiteBIT Coin Price Prediction: Scenario Analysis

Token Metrics price prediction scenarios span four market cap tiers, each representing different levels of crypto market maturity and liquidity:

8T Market Cap Price Prediction:

At an 8 trillion dollar total crypto market cap, WBT price prediction projects to $54.50 in bear conditions, $64.88 in the base case, and $75.26 in bullish scenarios.

16T Market Cap Price Prediction:

Doubling the market to 16 trillion expands the price prediction range to $78.61 (bear), $109.75 (base), and $140.89 (moon).

23T Market Cap Price Prediction:

At 23 trillion, the price forecast scenarios show $102.71, $154.61, and $206.51 respectively.

31T Market Cap Price Prediction:

In the maximum liquidity scenario of 31 trillion, WBT price prediction could reach $126.81 (bear), $199.47 (base), or $272.13 (moon).


These price prediction ranges illustrate potential outcomes for concentrated WBT positions, but investors should weigh whether single-asset exposure matches their risk tolerance or whether diversified strategies better suit their objectives.

What Is WhiteBIT Coin?

WhiteBIT Coin is the native exchange token associated with the WhiteBIT ecosystem. It is designed to support utility on the platform and related services.

WBT typically provides fee discounts and ecosystem benefits where supported. Usage depends on exchange activity and partner integrations.

Token Metrics AI Analysis for Price Prediction

Token Metrics AI provides comprehensive context on WhiteBIT Coin's positioning and challenges that inform our price prediction models.

Vision: The stated vision for WhiteBIT Coin centers on enhancing user experience within the WhiteBIT exchange ecosystem by providing tangible benefits such as reduced trading fees, access to exclusive features, and participation in platform governance or rewards programs. It aims to strengthen user loyalty and engagement by aligning token holders' interests with the exchange's long-term success. While not positioned as a decentralized protocol token, its vision reflects a broader trend of exchanges leveraging tokens to build sustainable, incentivized communities.

Problem: Centralized exchanges often face challenges in retaining active users and differentiating themselves in a competitive market. Users may be deterred by high trading fees, limited reward mechanisms, or lack of influence over platform developments. WhiteBIT Coin aims to address these frictions by introducing a native incentive layer that rewards participation, encourages platform loyalty, and offers cost-saving benefits. This model seeks to improve user engagement and create a more dynamic trading environment on the WhiteBIT platform.

Solution: WhiteBIT Coin serves as a utility token within the WhiteBIT exchange, offering users reduced trading fees, staking opportunities, and access to special events such as token sales or airdrops. It functions as an economic lever to incentivize platform activity and user retention. While specific governance features are not widely documented, such tokens often enable voting on platform upgrades or listing decisions. The solution relies on integrating the token deeply into the exchange's operational model to ensure consistent demand and utility for holders.

Market Analysis: Exchange tokens like WhiteBIT Coin operate in a competitive landscape led by established players such as Binance Coin (BNB) and KuCoin Token (KCS). While BNB benefits from a vast ecosystem including a launchpad, decentralized exchange, and payment network, WBT focuses on utility within its native exchange. Adoption drivers include the exchange's trading volume, security track record, and the attractiveness of fee discounts and staking yields. Key risks involve regulatory pressure on centralized exchanges and competition from other exchange tokens that offer similar benefits.

Fundamental Snapshot from Token Metrics

Fundamental Grade: 52.35% (Community 82%, Tokenomics 60%, Exchange 50%, VC —, DeFi Scanner N/A).


Catalysts That Skew Bullish for Price Prediction

  • Institutional and retail access expands with ETFs, listings, and integrations
  • Macro tailwinds from lower real rates and improving liquidity
  • Product or roadmap milestones such as upgrades, scaling, or partnerships
  • These factors could push WBT toward higher price prediction targets

Risks That Skew Bearish for Price Prediction

  • Macro risk-off from tightening or liquidity shocks
  • Regulatory actions or infrastructure outages
  • Concentration in validator economics and competitive displacement
  • Protocol-specific execution risk and competitive pressure from alternatives
  • These factors could push WBT toward lower price prediction scenarios

FAQs: WhiteBIT Coin Price Prediction

Can WBT reach $100 according to price predictions?

Based on the price prediction scenarios, WBT could reach $100 in the 16T base case. The 16T tier projects $109.75 in the base case price forecast. Achieving this price prediction requires both broad market cap expansion and WhiteBIT Coin maintaining competitive position. Not financial advice.

What's the risk/reward profile for WBT price prediction?

Risk and reward in our price prediction model span from $54.50 in the lowest bear case to $272.13 in the highest moon case. Downside risks include regulatory actions and competitive displacement, while upside drivers include expanding access and favorable macro liquidity. Concentrated positions amplify both tails, while diversified strategies smooth outcomes.

What gives WBT value and impacts price predictions?

WBT accrues value through fee discounts, staking rewards, access to special events, and potential participation in platform programs. Demand drivers include exchange activity, user growth, and security reputation. While these fundamentals matter for price predictions, diversified portfolios capture value accrual across multiple tokens rather than betting on one protocol's success.

What is the 2028 WhiteBIT Coin price prediction?

Based on Token Metrics analysis, the 2028 price prediction for WhiteBIT Coin centers around $40 in the base case under current market conditions, with a range between $10 and $85 depending on market scenarios. Bullish price predictions range from $64.88 to $272.13 across different total crypto market cap environments.

Can WBT reach $200 by 2028?

According to our price prediction models, WBT could reach $200 in the 23T moon case ($206.51) and in the 31T scenarios where the base case is $199.47 and the moon case is $272.13. These price prediction outcomes require significant crypto market expansion and WhiteBIT maintaining strong competitive positioning. Not financial advice.


Next Steps

Disclosure

Educational purposes only, not financial advice. Crypto is volatile, concentration amplifies risk, and diversification is a fundamental principle of prudent portfolio construction. Do your own research and manage risk appropriately.

Choose from Platinum, Gold, and Silver packages
Reach with 25–30% open rates and 0.5–1% CTR
Craft your own custom ad—from banners to tailored copy
Perfect for Crypto Exchanges, SaaS Tools, DeFi, and AI Products