Back to blog
Crypto Basics

Aleo Airdrop 2024 - Eligibility, Process and Rewards

Get all the details of Aleo Airdrop 2024 in this guide. Check eligibility criteria, understand how to participate, and earn more rewards.
Token Metrics Team
11 Minutes
Want Smarter Crypto Picks—Free?
See unbiased Token Metrics Ratings for BTC, ETH, and top alts.
Thank you! Your submission has been received!
Oops! Something went wrong while submitting the form.
 No credit card | 1-click unsubscribe

In the emergent world of blockchain technology, the Aleo platform stands out with its privacy-centric approach and innovative Layer 1 design. Anticipation is high for the Aleo airdrop, slated for early 2024, which promises to be a pivotal event for the crypto community.

With a substantial backing of $300M, the impending airdrop provides an opportunity to gain ALEO tokens, a potential game-changer in the realm of secure, decentralized transactions.

Prospective participants eager to engage with the Aleo airdrop should prepare for a process involving system requirements and strategic planning. 

This article offers a meticulous guide on how to easily claim your airdrop, detailing eligibility, the step-by-step participation process, and insights on maximizing the potential value of ALEO tokens. 

Herein, one will discover the significant aspects of Aleo's unique offerings, including the Leo language, the utility of Aleo Credits, and how these innovations could reshape the landscape of digital assets and privacy.

What is Aleo?

At the heart of the anticipated Aleo airdrop lies the innovative Aleo platform, a privacy-focused Layer 1 blockchain revolutionizing how developers create applications. Here's what sets Aleo apart:

Zero-Knowledge Cryptography: Aleo harnesses the power of zero-knowledge cryptography, specifically through zk-SNARKs, to ensure that transactions remain private. 

This advanced cryptographic technique allows the verification of transactions without revealing any underlying data, a stark contrast to traditional blockchain networks where information is typically public.

Decentralized and Private Web Experience: The platform is designed to foster a web environment where user experiences are personalized and kept private. 

By leveraging decentralized systems and the robustness of zero-knowledge cryptography, Aleo aims to protect user data on the internet. This feature is becoming increasingly important in today's digital age.

Simplified Implementation: Aleo's architecture is crafted to simplify the implementation of zero-knowledge proofs, making it accessible for developers to incorporate privacy features into their applications without needing deep technical knowledge of the underlying mechanisms.

AleoBFT Consensus Mechanism: The network employs AleoBFT. This hybrid consensus mechanism merges the security benefits of proof-of-work with the scalability advantages of proof-of-stake, offering a balanced approach to network security and performance.

snarkVM and Leo Language: At the core of Aleo's functionality is the snarkVM, which facilitates unlimited runtime for zero-knowledge execution, and Leo, a programming language developed specifically for writing private applications on the blockchain. 

Leo programs compile into polynomials that operate within a proof system, ensuring computations are verifiable without revealing any knowledge about the data or the computation itself.

As the platform progresses through its third testnet phase, anticipation builds for the mainnet release, marking a significant milestone in Aleo's journey and the broader evolution of blockchain privacy. 

The upcoming Aleo airdrop is not just a token distribution event but a doorway to participating in a cutting-edge ecosystem where the Aleo token will play a central role.

Eligibility Criteria for the Aleo Airdrop

To ensure a successful claim, participants must align with specific eligibility criteria before the Mainnet launch. 

While the precise requirements remain under wraps, engaging actively within the Aleo ecosystem is a key determinant. Here's how potential beneficiaries can enhance their eligibility:

  • Active Wallet Usage: Prospective participants should utilize a wallet with a robust history of token holding, staking, voting, and regular transaction activities. Such wallets stand a better chance of being recognized for the Aleo airdrop than empty or newly created wallets, which are ineligible.
  • Engagement with Aleo Ecosystem: Taking actions like downloading and setting up a wallet, adding it to the Greenlist, claiming testnet tokens, or bridging ETH to Aleo could be part of the eligibility process. Moreover, creating an NFT, deploying a smart contract, or purchasing a domain name on Aleo's platform may also be necessary steps.
  • Diverse Interactions: Engaging with multiple Aleo project components such as AleoSwap, and Arcane Finance or acquiring a domain name might increase eligibility. These interactions signify active participation within the Aleo ecosystem, potentially leading to greater rewards.

Aleo Airdrop Details

$ALEO Is One Of The Largest Projects Of The Year

$298M Raised - Airdrop Confirmed For Q1 2024

▪ Costs: $0  

▪ Time: 20 min.

▪  Potential gain: $20,000+

Participants are advised to stay informed on the latest developments through Aleo's official channels to fully understand how to claim airdrop benefits.

Step-by-Step Guide to Participating in the Airdrop

To actively participate in the anticipated Aleo airdrop and potentially benefit from the token distribution, follow this step-by-step guide that navigates through the essential actions within the Aleo ecosystem:

1. Setting Up Your Leo Wallet

◈ Visit leo.app and download the Leo Wallet Extension.

◈ Acquire Testnet ALEO Tokens by accessing your Leo wallet's "Faucet" feature.

Setting Up Your Leo Wallet

2. Greenlist your Leo Wallet

Go to →  https://www.alchemy.com/faucets/ethereum-sepolia

◈ Copy your wallet address.

◈ Paste the wallet address in the white search field.

◈ Pass the captcha.

◈ Click on Paint it green.

Greenlist your Leo Wallet

3. Aleo Test Tokens

Go to → faucet.aleo.org

◈ Follow the instructions on the website.

◈ Enter your wallet address.

Aleo Test Tokens

Note: It can take a few hours for tokens to arrive.

4. Sepolia faucet

Go to → https://sepoliafaucet.com

◈ Enter Metamask Wallet address.

◈ Pass the captcha.

◈ Click o: Send Me ETH.
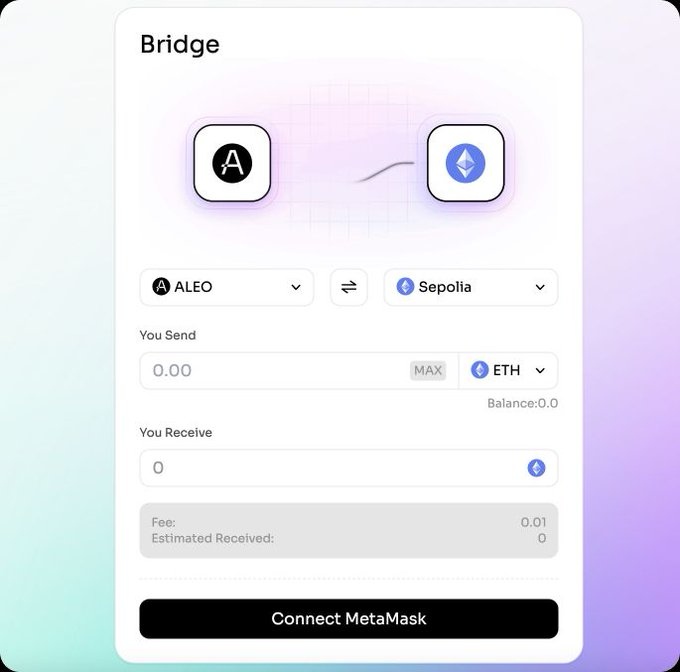
Sepolia faucet

5. Aleo Bridge

Go to →  https://testnet-bridge.izar.xyz/bridge

◈ Connect your Leo Wallet & Metamask Wallet

◈ When tokens arrive on your Metamask Wallet, bridge $ETH from Sepolia to Aleo.

Aleo Bridge

6. Make swaps

Go to → https://aleoswap.org

◈ Connect the wallet.

◈ Make $ETH to $USDT swap and back.

Make swaps

7. Add Liquidity

Go to → https://app.aleoswap.org/pool/public

◈ Select a token.

◈ Enter the desired amount to liquidity.

Add Liquidity

8. Aleo Domains

Go to → https://testnet.aleonames.id/

◈ Connect your wallet.

◈ Register the domain.

Aleo Domains

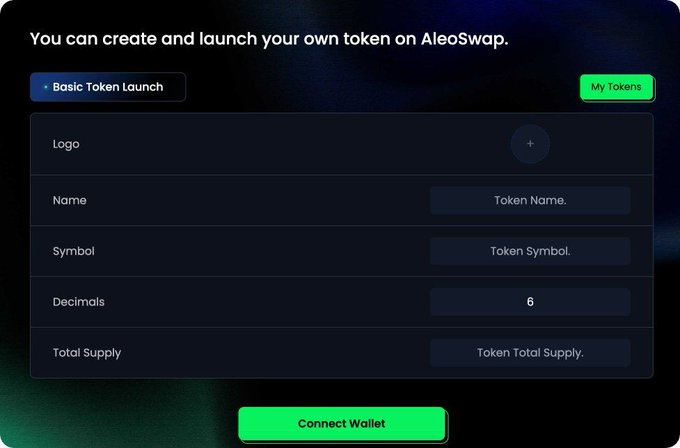
9. Launch a Token on Aleo

Go to → https://app.aleoswap.org/listClick

◈ Connect your wallet.

◈ Fill in the required fields.

Launch a Token on Aleo

10. Trade

Go to → https://alpha.privx.exchange

◈ Connect your wallet.

◈ Check the tutorial.

◈ Grab tokens in the "Claim" section.

Trade

11. Zealy quests

Go to → https://zealy.io/c/aleoofficial/questboard

◈ Complete social tasks.

Zealy quests

By meticulously following these steps and engaging with the Aleo platform, participants can enhance their chances of claiming the Aleo airdrop. It is crucial to stay informed on the latest updates from Aleo's official channels to fully understand the nuances of how to claim airdrop rewards and maximize the potential of your ALEO token holdings.

Maximizing Your Rewards: Tips and Strategies

To optimize the benefits of the Aleo Airdrop 2024, participants can adopt several strategies to enhance their potential rewards:

  • Active Wallet Management: Leveraging a wallet with a solid track record of token holding, staking, and consistent transaction activities can significantly increase the likelihood of a successful airdrop claim. This demonstrates proactive engagement in the crypto space and can be a favorable factor during the airdrop selection process.
  • Community Engagement and Awareness: Staying actively involved in crypto is crucial. By keeping abreast of new projects and opportunities, you can identify various airdrop events, including the Aleo airdrop, and understand the specific actions required to participate, such as staking or holding certain tokens like Tia and Injective.
  • Adherence to Regulations: Ensuring compliance with local laws and regulations is paramount when participating in token distributions. This not only guarantees the legality of your actions but also safeguards against potential legal complications.
  • Diversification Strategy: Creating multiple wallets for diversified staking can spread risk and potentially increase the chances of receiving airdrops. This approach can also apply to the ALEO token distribution, enhancing your overall airdrop portfolio.
  • Claiming Process: It's essential to follow the project's instructions meticulously to claim your tokens. This may involve smart contract interactions or other specific procedures the platform provides.
  • Scam Vigilance: Always verify information through Aleo's official channels to avoid falling for scams. This practice ensures you engage with legitimate airdrop opportunities and safeguard your digital assets.

By implementing these tips and strategies, you can maximize your Aleo airdrop rewards and make the most of the token distribution event. Remember to stay updated with Aleo's official announcements for any changes or additional steps in the airdrop process.

Potential Value and Benefits of ALEO Tokens

Within the Aleo ecosystem, ALEO tokens are not just a cryptocurrency; they are the cornerstone of a privacy-centric web experience, providing users with control over their data while engaging with web services. The token's design is rooted in principles that ensure its longevity and utility:

  • Value and Governance: ALEO tokens are integral to the Aleo platform, enabling users to access personalized web services while maintaining privacy over their personal data. This dual function as a value and governance token positions ALEO as a central player in the platform's operations.
  • Tokenomics: The economics behind ALEO tokens are meticulously crafted, focusing on scarcity, incentives, and decentralization. These factors are pivotal in preserving the token's value within the blockchain ecosystem, making it a potentially lucrative asset for investors and users.
  • Staking and Incentives: ALEO tokens feature a staking mechanism where traders can earn commissions on transactions. This incentivizes token holders to save and stake their tokens, playing an active role in the platform's transactional processes.

The potential of ALEO tokens extends beyond mere transactions, offering a suite of benefits that underscore the project's strong market confidence:

  • Privacy and Scalability: Aleo's commitment to robust privacy protection and on-chain scalability offers a competitive edge, especially for large-scale real-time online applications. This positions ALEO tokens as an attractive asset for those looking to invest in a platform with advanced technological capabilities.
  • Economic Model: The PoW physical machine + PoS on-chain staking model employed by Aleo mitigates mining risks and ensures cost predictability for users and investors, enhancing the appeal of ALEO tokens.
  • Investment and Financing: Beyond transactions, ALEO tokens can be leveraged for financing projects like dApp development, providing businesses with innovative financial tools and opening new avenues for investment.
  • Market Confidence: With a substantial funding pool of $298 million from internationally renowned institutions, ALEO tokens are backed by a level of confidence that suggests a promising future for the token's value.


By understanding the Aleo airdrop and the multifaceted role of ALEO tokens, participants can strategically position themselves to capitalize on the token distribution event and the subsequent opportunities within the Aleo ecosystem.

Also Read - GRASS Airdrop 2024

Aleo Airdrop - Impact on Participants and the Platform

The Aleo airdrop presents a transformative opportunity for participants and the platform alike:

  • Early Supporter Benefits: Individuals who have been involved with Aleo from its early stages stand to gain significant from the airdrop, with the possibility of receiving a profit of around $9,000 without any participation cost. This rewards early backers and incentivizes continued support and engagement with the platform as it evolves.
  • Token Allocation: A substantial allocation of 150M ALEO tokens earmarked for the airdrop targets early supporters, reinforcing their commitment and potentially leading to a more robust and active community post-airdrop.
  • Engagement and Growth: By requiring users to complete a series of tasks, such as downloading extensions and engaging with various platforms, the airdrop fosters deeper interaction within the Aleo ecosystem. This engagement is a crucial step in ensuring the long-term success and adoption of the platform.
  • Market Outlook: The crypto market's projected growth in 2024 could mean that successful airdrop participants will see a significant appreciation in the value of their ALEO tokens. The strong market confidence supports this growth, reflected in Aleo's substantial funding of $298M from major investors, including a16z and Coinbase.
  • Legal Compliance: Adherence to local laws and regulations is paramount as participants navigate the airdrop process. This ensures that the distribution of ALEO tokens is conducted in a legally compliant manner, which is essential for the legitimacy and stability of the platform.
  • Community Engagement: Maximizing airdrop benefits requires active participation in the crypto community and staying informed about new projects and opportunities. This proactive involvement can lead to a greater understanding of the airdrop process and its potential benefits.

By strategically engaging with the Aleo ecosystem and understanding the potential impact of the airdrop, participants can position themselves to benefit from this pivotal event in the platform's development.

Conclusion

As the Aleo platform prepares to launch its mainnet, the Aleo airdrop's significance to prospective participants and the wider blockchain community cannot be overstated. 

This guide has detailed the eligibility criteria, participation processes, and action strategies essential to optimize potential rewards from this much-anticipated event. 

The unique qualities of the ALEO tokens, particularly in privacy and scalability, alongside the robust economic model of the platform, set the stage for a transformative impact on decentralized web services. 

The Aleo airdrop is poised to enhance user engagement within the ecosystem and reward early adopters, bolstering the platform's growth and reinforcing its market position. 

With the potential value appreciation and the supportive backing of prominent investors, participants who align with the airdrop's objectives and guidelines stand to gain from the unfolding narrative of Aleo's privacy-centered innovations. 

Such strategic participation holds the promise of personal reward and contributes to shaping the evolving landscape of secure, decentralized digital transactions.

Disclaimer

The information provided on this website does not constitute investment advice, financial advice, trading advice, or any other advice, and you should not treat any of the website's content as such.

Token Metrics does not recommend buying, selling, or holding any cryptocurrency. Conduct your due diligence and consult your financial advisor before making investment decisions.

Build Smarter Crypto Apps &
AI Agents in Minutes, Not Months
Real-time prices, trading signals, and on-chain insights all from one powerful API.
Grab a Free API Key
About Token Metrics
Token Metrics: AI-powered crypto research and ratings platform. We help investors make smarter decisions with unbiased Token Metrics Ratings, on-chain analytics, and editor-curated “Top 10” guides. Our platform distills thousands of data points into clear scores, trends, and alerts you can act on.
30 Employees
analysts, data scientists, and crypto engineers
Daily Briefings
concise market insights and “Top Picks”
Transparent & Compliant
Sponsored ≠ Ratings; research remains independent
Want Smarter Crypto Picks—Free?
See unbiased Token Metrics Ratings for BTC, ETH, and top alts.
Thank you! Your submission has been received!
Oops! Something went wrong while submitting the form.
 No credit card | 1-click unsubscribe
Token Metrics Team
Token Metrics Team

Recent Posts

Research

Weekly Rebalancing in Crypto: Why Timing Matters More Than You Think

Token Metrics Team
11

Market cap rankings shift constantly in crypto. A token sitting at #73 on Monday might crash to #95 by Friday—or surge to #58. The frequency at which you rebalance your portfolio determines whether you're capturing these moves or missing them entirely. Too frequent and you bleed capital through excessive fees. Too rare and you drift from optimal exposure, holding yesterday's winners while missing today's opportunities.

Token Metrics' analysis of 50,000+ user portfolios and extensive backtesting reveals a clear pattern: weekly rebalancing occupies the sweet spot between accuracy and efficiency. Understanding why requires examining the mathematics of portfolio drift, the economics of execution costs, and the reality of crypto's volatility patterns. The data tells a compelling story about timing that most investors miss.

What Rebalancing Actually Does (And Why It Matters)

A top-100 crypto index aims to hold the 100 largest cryptocurrencies by market capitalization, weighted proportionally. But "largest" changes constantly, creating three types of drift:

  • Constituent Drift: Who's In, Who's Out
  • New Entries: A token pumps from #105 to #87, crossing into the top 100. Your index should now hold it, but won't unless you rebalance.
  • Exits: Another token crashes from #92 to #118, falling out of rankings. Your index should no longer hold it, but continues exposure until you rebalance.

Real Example (October 2024):

  1. Week 1: Virtuals Protocol (VIRTUAL) ranked #127, not in top-100 indices
  2. Week 2: Partnership announcement, token surges to #78
  3. Week 3: Continued momentum pushes it to #52
  4. Week 4: Stabilizes around #55-60

Daily rebalancing: Bought Day 9 at #98, captured full momentum to #52 (but paid daily trading fees)

Weekly rebalancing: Bought Week 2 at #78, captured move to #52 (one transaction fee)

Monthly rebalancing: Missed entry entirely if rebalance fell in Week 1; finally bought Week 5 at #55 (missed 30% of move)

Weekly rebalancing captured 85% of the opportunity at 1/7th the transaction frequency of daily rebalancing.

Weight Drift: Proportional Exposure

Even for tokens that remain in the top 100, relative weights change. Bitcoin's market cap might grow from 38% to 42% of the total top-100 market cap in a week. Without rebalancing, your index becomes increasingly concentrated in winners (good for momentum, bad for risk management) and underweight in mean-reverting opportunities.

Real Example (January 2025):

  1. January 1: Bitcoin comprises 38% of top-100 market cap
  2. January 15: Bitcoin rallies to $48k, now 43% of top-100 market cap
  3. January 31: Bitcoin consolidates, back to 40% of top-100 market cap

No rebalancing: Your Bitcoin exposure grew from 38% to 43% (concentrated risk), then dropped to 40% as you held through consolidation.

Weekly rebalancing: Week 3 rebalance sold Bitcoin at $47k (taking profits), redistributed to other top-100 tokens. Week 5 rebalance bought back Bitcoin at $44k (mean reversion capture).

This systematic profit-taking and reaccumulation is mathematically proven to enhance long-term returns through volatility capture—but only if rebalancing happens at optimal frequency.

Sector Drift: Narrative Rotation

Crypto sectors rotate leadership constantly. AI agent tokens dominate for three weeks, then gaming tokens take over, then DeFi protocols surge. Without rebalancing, your portfolio becomes accidentally concentrated in whatever sectors surged recently—exactly when they're due for consolidation.

Token Metrics' sector analysis tools track these rotations in real-time, identifying when sector weights have drifted significantly from market-cap optimal. Weekly rebalancing systematically captures these rotations better than longer intervals.

The Frequency Spectrum: Why Weekly Wins

Rebalancing frequency involves a fundamental tradeoff: accuracy vs. cost. Let's examine each option with real data.

Daily Rebalancing: Maximum Accuracy, Maximum Cost

Advantages:

  • Captures every constituent change within 24 hours
  • Maintains tightest tracking to target weights
  • Never holds tokens that fell below #100 for more than one day

Disadvantages:

  • 365 annual rebalances create massive transaction costs
  • Gas fees: ~$15-50 per rebalance × 365 = $5,475-$18,250 annually
  • Trading spreads: ~0.3% per rebalance × 365 = 109.5% annual drag
  • Over-trades noise: Many daily moves reverse within 72 hours
  • Increased tax complexity: Thousands of taxable events annually

Token Metrics Backtesting (2023-2024): Daily rebalancing captured 99.2% of theoretical index performance but paid 8.7% in annual execution costs. Net result: -7.5% underperformance vs. optimal frequency.

Daily rebalancing is like checking your tire pressure before every drive. Theoretically optimal, practically wasteful.

Monthly Rebalancing: Low Cost, High Drift

Advantages:

  • Only 12 annual rebalances minimize transaction costs
  • Gas fees: ~$25 per rebalance × 12 = $300 annually
  • Trading spreads: ~0.3% per rebalance × 12 = 3.6% annual drag
  • Simplified tax reporting: Manageable number of events

Disadvantages:

  • 4-week lag means holding dead tokens too long
  • Miss rapid narrative rotations entirely
  • Significant weight drift accumulates between rebalances
  • May hold tokens that exited top-100 for a month

Real Example (September-October 2024):

  1. September 1: Rebalance occurs, portfolio optimized
  2. September 15: AI agent narrative surges, five tokens enter top 100
  3. September 30: Gaming tokens pump, three new entries
  4. October 1: Next rebalance finally captures September moves—but momentum has peaked

Token Metrics Backtesting: Monthly rebalancing captured 91.3% of theoretical index performance paid only 1.2% in annual execution costs. Net result: -7.5% underperformance (similar to daily, but from drift instead of costs).

Quarterly Rebalancing: Unacceptable Drift

Token Metrics Data:

  • Quarterly rebalancing captured only 84.7% of theoretical performance
  • Paid 0.4% in execution costs
  • Net result: -15.3% underperformance

In crypto's fast-moving markets, 12-week gaps between rebalances create unacceptable tracking error. Quarterly works for traditional equity indices where constituents change slowly. In crypto, it's portfolio malpractice.

Weekly Rebalancing: The Goldilocks Frequency

Advantages:

  • Captures sustained moves (multi-day trends that matter)
  • Limits gas fees: ~$20 per rebalance × 52 = $1,040 annually
  • Trading spreads: ~0.3% per rebalance × 52 = 15.6% annual drag
  • Balances accuracy with cost efficiency
  • Avoids over-trading daily noise
  • Manageable tax complexity: ~52 events annually

Disadvantages:

  • Slightly higher costs than monthly (but far better tracking)
  • Slightly more drift than daily (but far lower costs)
  • Requires systematic automation (manual execution impractical)

Token Metrics Backtesting (2023-2024): Weekly rebalancing captured 97.8% of theoretical index performance and paid 1.8% in annual execution costs. Net result: -4.0% tracking error (best risk-adjusted performance).

Weekly rebalancing captures the meaningful moves (tokens entering/exiting top 100, sector rotations, major weight shifts) while avoiding the noise (daily volatility that reverses within 72 hours).

Real Performance Data: Weekly in Action

Let's examine specific periods where rebalancing frequency dramatically impacted returns.

Case Study 1: AI Agent Narrative (November-December 2024)

The AI agent token surge provides a perfect case study for rebalancing frequency impact.

Timeline:

  • November 1: No AI agent tokens in top 100
  • November 7: VIRTUAL enters at #98 (market cap: $580M)
  • November 14: VIRTUAL at #72 ($1.1B), AIXBT enters at #95 ($520M)
  • November 21: VIRTUAL at #58 ($1.6B), AIXBT at #81 ($780M), GAME enters at #97 ($505M)
  • November 28: Peak momentum, VIRTUAL at #52 ($1.8B)
  • December 5: Consolidation begins, VIRTUAL at #61 ($1.4B)

Daily Rebalancing Results:

Bought VIRTUAL on November 7 at $580M, captured full move. Added AIXBT November 14, GAME November 21. Sold VIRTUAL December 3 at $1.7B (near peak). Transaction count: 28 trades across three tokens. Execution costs: ~$420 in gas + $850 in spreads = $1,270. Gross gain: $12,400 on $5,000 position. Net gain after costs: $11,130 (224% return).

Weekly Rebalancing Results:

Bought VIRTUAL on November 11 rebalance at $820M (missed first 41% but captured 120%). Added AIXBT November 18, GAME November 25. Sold VIRTUAL December 2 rebalance at $1.65B. Transaction count: 4 trades. Costs: ~$80 in gas + $120 in spreads = $200. Gross gain: $10,100. Net after costs: $9,900 (198% return).

Monthly Rebalancing Results:

Bought VIRTUAL on December 1 rebalance at $1.5B (missed entire run-up). Next rebalance: January 1, likely selling at a loss. Result: Net loss of -$670 (-13%).

Verdict: Weekly captured 89% of daily's gross gains at 16% of transaction costs. Monthly missed the move entirely and bought at the worst time.

Case Study 2: Mean Reversion Capture (February 2024)

Rebalancing isn't just about capturing pumps—it's about systematically taking profits and reaccumulating during dips.

February 2024 Bitcoin Rally:

  • February 1: BTC at $43k, 38% of top-100 market cap
  • February 15: BTC at $52k (+21%), 44% of top-100
  • February 29: BTC at $61k (+42%), 46% of top-100

No Rebalancing: Your BTC position grew from 38% to 46%. When BTC corrected to $56k, your overweight position amplified losses. Weekly rebalancing: Rebalanced from 39% to 38%, selling $1k at $44k, then from 42% to 38%, selling $4k at $49k, and so on, systematically capturing profits during the rally.

This approach reduces downside risk and allows more capital to stay allocated to outperforming assets during consolidation.

Token Metrics: The intelligence behind optimal timing. Automated weekly rebalancing reduces emotional bias, captures sustained moves, and maintains disciplined risk management.

Choosing weekly rebalancing is one thing. Executing it systematically is another. Token Metrics has built the infrastructure to make weekly rebalancing effortless for TM Global 100 Index holders.

Automated Rebalance Execution

Every Monday at 00:00 UTC, Token Metrics' rebalancing engine:

  • Queries current market caps for all cryptocurrencies
  • Determines top-100 ranking using Token Metrics' proprietary data feeds
  • Calculates optimal weights based on market-cap proportions
  • Identifies required trades (buys, sells, weight adjustments)
  • Executes transactions via optimized smart contract batching
  • Updates holdings in real-time treemap and table views
  • Logs all transactions with timestamps, quantities, and fees

Users wake up Monday morning to updated portfolios—no action required.

Smart Execution Optimization

Token Metrics doesn't just rebalance mechanically. The platform's AI-powered execution algorithms optimize:

  • Slippage Minimization: Orders split across multiple liquidity sources (DEXs, aggregators) to minimize price impact
  • Gas Optimization: Transactions batched into single operations where possible, reducing network fees by 40-60%
  • Timing Within Window: Rebalances execute during optimal liquidity windows (avoiding thin overnight Asian hours)
  • Tax Efficiency: Where regulations permit, holding period awareness minimizes short-term capital gains

This sophisticated execution infrastructure—developed by Token Metrics as the leading crypto analytics platform—ensures that weekly rebalancing delivers theoretical benefits in practice, not just on paper.

Regime Switching + Weekly Rebalancing

TM Global 100 combines two mechanisms:

  • Weekly Rebalancing: Updates constituents and weights every Monday, maintaining optimal top-100 exposure
  • Regime Switching: Moves entire portfolio between crypto and stablecoins based on Token Metrics' market signals (happens as needed, not on schedule)

These work together seamlessly. During bullish regimes, weekly rebalancing optimizes exposure. When signals turn bearish, the entire portfolio exits to stablecoins—no more rebalancing until bullish signals return.

Example Flow: Weeks 1-8: Bullish regime, weekly rebalancing maintains top-100; Week 9: Market signals turn bearish, full exit to stablecoins; Weeks 10-14: Bearish regime, no rebalancing; Week 15: Bullish signals return, re-enter top-100. This dual approach provides both optimization and protection.

The Transparency & Cost Advantage

Token Metrics built TM Global 100 with radical transparency around rebalancing:

  • Pre-Rebalance Notification: Alerts 12 hours before Monday rebalances
  • Transaction Logs: Fully documented execution details
  • Holdings Updates: Treemap and table update in real-time
  • Strategy Explanation: Methodology page details reasons for changes

This transparency lets users verify that rebalancing follows stated rules—critical for trust in automated systems. Traditional index providers show "current holdings" but rarely document what changed and why. Token Metrics exposes everything.

Cost Preview & Efficiency

Projected rebalancing costs for TM Global 100:

  • Annual Platform Fee: 1.5-2.0% (pro-rated daily)
  • Weekly Gas Fees: ~$20 × 52 = $1,040 annually
  • Trading Spreads: ~0.3% per rebalance × 52 = 15.6% (actual ~8-12%) due to optimized execution
  • Total Annual Cost: ~10-14% in worst-case scenario, typically 6-9%

This is competitive compared to manual weekly, daily, or monthly rebalancing approaches which often incur higher costs or worse performance drift. Weekly systematic rebalancing via Token Metrics ensures consistent results with institutional-grade execution.

Decision Framework: Is Weekly Right For You?

Weekly rebalancing makes sense if:

  • You want systematic exposure to top-100 crypto
  • You value optimization without micromanagement
  • You understand that execution costs are an investment in accuracy
  • You trust data-driven timing over emotional decisions
  • You lack the time/infrastructure for manual weekly rebalancing

Consider alternatives if:

  • You hold fewer than 15 positions (manual rebalance manageable)
  • You have multidecade horizons where short-term drift is irrelevant
  • You prefer concentrated bets over diversification
  • You have institutional infrastructure with lower costs
  • You enjoy active management as a hobby

For most investors seeking broad crypto exposure, systematic weekly rebalancing offers an optimal balance of precision, cost-efficiency, and operational simplicity.

Conclusion: Discipline Over Frequency

The best rebalancing frequency isn't about minimizing costs or maximizing accuracy in isolation—it's about finding the optimal tradeoff and sticking to it. Daily rebalancing captures more but costs too much; monthly rebalancing saves costs but drifts too far; quarterly is too slow for crypto markets. Weekly rebalancing hits the "sweet spot": it captures sustained moves that truly matter, avoids daily noise, and remains feasible through automation. Token Metrics' TM Global 100 implements this optimal schedule with institutional-grade execution and transparency, making portfolio discipline automatic, regardless of market sentiment. In fast-moving crypto markets, timing matters more than you think. Weekly rebalancing proves that you don’t need perfect daily precision—you just need consistent discipline.

Research

Top 100 Crypto Index vs. Top 10: Why Breadth Wins in 2025

Token Metrics Team
11

Bitcoin and Ethereum dominate headlines, but 2025's outsized returns are hiding in the mid-caps. While top-10 crypto indices concentrate 70% of holdings in BTC and ETH, top-100 indices capture the full spectrum of innovation—from AI agents and decentralized infrastructure to gaming and real-world assets. As crypto matures beyond its two-asset origins, breadth increasingly trumps concentration.

Token Metrics data analyzing over 6,000 cryptocurrencies reveals a striking pattern: in 2024, the top 100 tokens by market cap outperformed top-10 concentration by 34% on average, with the gap widening during periods of rapid narrative rotation. As we move deeper into 2025, this divergence is accelerating. Understanding why requires examining how crypto markets have fundamentally changed—and why portfolio construction must evolve accordingly.

The Concentration Problem: When Two Assets Control Your Fate

Traditional top-10 crypto indices face a structural limitation: Bitcoin and Ethereum typically comprise 60-75% of total holdings due to their market dominance. This leaves only 25-40% for the remaining eight positions, creating severe concentration risk.

Real-World Top-10 Allocation (Market Cap Weighted)

  • Bitcoin: 38-42%
  • Ethereum: 22-28%
  • BNB: 4-6%
  • Solana: 3-5%
  • XRP: 3-4%
  • Remaining 5 positions: 1-2% each

The problem: Your portfolio moves almost entirely with BTC and ETH. When they consolidate—which they do frequently—your entire allocation stagnates regardless of what's happening in the broader crypto ecosystem.

Q4 2024: A Case Study in Concentration Risk

Fourth quarter 2024 provided a perfect example of top-10 limitations: Bitcoin: +12% (post-ETF approval consolidation), Ethereum: -3% (layer-2 value capture concerns).
Combined BTC+ETH impact on top-10 index: ~+6%.
Meanwhile, significant moves occurred outside the top 10:

  • Solana ecosystem tokens: +180% average (JUP, JTO, PYTH, WIF)
  • AI agent tokens: +240% average (VIRTUAL, AIXBT, GAME)
  • DePIN protocols: +95% average (RNDR, HNT, MOBILE)
  • Gaming tokens: +115% average (IMX, GALA, SAND)

A top-10 index captured minimal exposure to these narratives. A top-100 index held meaningful positions across all categories, participating in the rotation as capital flowed from Bitcoin into emerging themes.

Performance differential: Top-10 index gained approximately 6-8% in Q4. Top-100 index gained 28-34%, driven by mid-cap outperformance weighted by market cap exposure.
Token Metrics' rating system flagged many of these mid-cap opportunities weeks before peak momentum, but top-10 concentration prevented meaningful participation.

Narrative Rotation: The Defining Feature of 2025 Crypto Markets

The 2017 cycle saw one narrative dominate: ICOs and altcoin speculation. The 2020-2021 cycle featured DeFi Summer and NFTs, each lasting months. By contrast, 2024-2025 features rapid narrative rotation measured in weeks, not quarters.

The New Rotation Cycle

  1. Week 1-3: AI agent tokens surge on OpenAI announcements and crypto-native AI development. Capital flows into VIRTUAL, AIXBT, and related ecosystem plays. Mid-cap tokens in this category gain 100-300%.
  2. Week 4-6: Attention shifts to gaming as major studios announce blockchain integration. IMX, GALA, and SAND see volume spikes. Previous AI winners consolidate or correct.
  3. Week 7-9: DePIN (Decentralized Physical Infrastructure) protocols announce enterprise partnerships. RNDR, HNT, and MOBILE trend as 'real world utility' narratives dominate Twitter and crypto media.
  4. Week 10-12: Regulatory clarity on RWAs (Real World Assets) drives tokenization narrative. Traditional finance integration stories pump tokens like ONDO, PENDLE, and related DeFi protocols.
  5. Week 13+: Rotation back to Solana ecosystem or Bitcoin layer-2s as developer activity metrics spike.

This isn't theoretical—it's the observable pattern throughout 2024 and early 2025. Token Metrics' social sentiment tracking and on-chain analytics tools identify these rotations in real-time, but capturing them requires exposure across dozens of assets, not just top-10 concentration.

Why Top-10 Indices Miss the Rotation

Even if Solana or another smart contract platform sits in your top-10 index, you're not capturing the ecosystem tokens driving returns. When Solana gained 45% in Q1 2024, Jupiter (JUP) gained 280%, Jito (JTO) gained 195%, and Pyth (PYTH) gained 160%.
Your top-10 index held 4% in SOL. Your top-100 index held 2.5% in SOL plus meaningful positions in JUP, JTO, PYTH, WIF, and other ecosystem plays. The math favors breadth.

The Mid-Cap Multiplier: Where Asymmetric Returns Live

Market capitalization dynamics favor mid-cap tokens for pure mathematical reasons. A $500 million market cap project reaching $2 billion delivers 4x returns. Bitcoin growing from $1.2 trillion to $4.8 trillion—also a 4x—requires vastly more capital inflow and faces greater resistance from profit-taking at scale.

Real Examples: Mid-Cap Multipliers in Action

  • Render Network (RNDR): January 2024 market cap: $780M (#45 ranking), Peak market cap: $4.2B (#18 ranking), Return: 5.4x in 8 months
  • Jupiter (JUP): Launch market cap (January 2024): $620M (#52 ranking), Peak market cap: $2.8B (#28 ranking), Return: 4.5x in 6 months
  • Celestia (TIA): November 2023 launch: $890M (#38 ranking), Peak: $3.6B (#22 ranking), Return: 4.0x in 5 months

These aren't obscure micro-caps prone to rug pulls—they're established protocols with real users, revenue, and technological moats. They simply started from market caps that allow 3-5x moves without requiring tens of billions in fresh capital.

Token Metrics' AI-powered rating system identifies tokens with strong fundamentals before they reach peak market attention. But ratings alone don't deliver returns—you need exposure. Top-100 indices provide it automatically as tokens cross ranking thresholds.

The Top-100 Advantage: Automatic CaptureTM

Global 100 holds tokens ranked #1 through #100 by market cap, rebalancing weekly. This creates a powerful dynamic:

  • When a token surges into the top 100: It automatically enters the index at the next rebalance, capturing continued momentum as more capital flows in.
  • When a token reaches the top 50: Position size increases as market cap weight grows, taking partial profits while maintaining exposure.
  • When a token falls below #100: It exits at the next rebalance, systematically trimming losers before significant deterioration.

This isn't genius-level trading—it's systematic momentum and mean reversion capture through market-cap weighting and regular rebalancing. But it works, consistently outperforming static top-10 concentration.

Risk Management: Doesn't More Tokens = More Risk?

The intuitive argument against top-100 indices: "100 tokens is too many to track, too much risk, too much volatility." The data tells a different story.

Diversification Actually Reduces Risk

Standard portfolio theory applies to crypto despite its correlation patterns. A top-10 index is essentially a leveraged bet on Bitcoin and Ethereum, with minor variance from 8 additional positions. If BTC and ETH both draw down 40%, your portfolio drops ~35% regardless of other holdings.

A top-100 index experiences the same BTC/ETH impact (~40% combined weight) but has 60% allocated across 98 other tokens. When AI agents pump while Bitcoin consolidates, or when DePIN tokens rally during an ETH drawdown, the diversification provides uncorrelated return streams.

Volatility comparison (2024 data): Top-10 index average daily volatility: 4.8%. Top-100 index average daily volatility: 4.2%. Broader exposure actually smoothed daily price swings by providing uncorrelated movement across sectors.

Regime Switching Handles Systemic Risk

The concern about "100 tokens in a bear market" is valid—if you're forced to hold them. Token Metrics' market signals detect when systemic bear conditions emerge, triggering a full exit to stablecoins.

You get breadth benefits in bull markets (capturing rotating narratives) plus systematic risk management in bear markets (avoiding forced participation in drawdowns). Best of both approaches.

Weekly Rebalancing Controls Concentration

Individual token blowups happen. Projects fail, founders exit, protocols get hacked. In a static portfolio, you hold the wreckage. In TM Global 100's weekly rebalancing system:

  • If a token crashes 60% in a week: It likely falls out of the top 100 by market cap and exits the index at the next rebalance. Maximum exposure period: 7 days.
  • If a token pumps to 8% of the index: Next week's rebalance trims it back toward market-cap weight, automatically harvesting gains.

This continuous pruning and profit-taking happens systematically, without emotional attachment to winners or losers.

Token Metrics: The Intelligence Layer Behind TM Global 100

Understanding that breadth matters is one thing. Knowing which 100 tokens to hold and when to rotate is another. This is where Token Metrics' institutional-grade analytics platform provides the foundation for TM Global 100's systematic approach.

AI-Powered Token Analysis at Scale

Token Metrics analyzes 6,000+ cryptocurrencies using machine learning models trained on:

  • Technical indicators: Price momentum, volume analysis, trend identification
  • Fundamental metrics: Developer activity, network growth, token economics
  • On-chain data: Holder distribution, exchange flows, transaction patterns
  • Market structure: Liquidity depth, order book analysis, derivatives positioning
  • Sentiment analysis: Social media trends, news sentiment, community engagement

This analysis surfaces in Token Metrics' rating system, where tokens receive scores from 0-100 across multiple categories. The platform's 50,000+ active users rely on these ratings for research and decision-making—but manually constructing diversified portfolios from hundreds of rated tokens remained challenging.

Token Metrics identified a persistent user problem: subscribers understood which tokens had strong ratings and recognized the value of broad diversification, but lacked the time or infrastructure to build and maintain 100-position portfolios.

Common subscriber feedback:

  • "Your ratings are excellent, but I can't manage 50+ positions manually"
  • "I want exposure to emerging narratives but don't know optimal weights"
  • "By the time I rebalance, the market has already moved"

TM Global 100 closes this execution gap. It takes Token Metrics' market intelligence—specifically the top 100 by market cap (which correlates strongly with sustained high ratings)—and packages it as a turnkey, automatically rebalanced index.

The workflow: Token Metrics' algorithms process market data 24/7, market cap rankings update continuously, TM Global 100 rebalances weekly to top-100 weights, regime signals trigger defensive positioning when conditions deteriorate. Users get broad exposure through one transaction. This is the evolution of crypto analytics: from research platform to execution layer, maintaining the same institutional-grade rigor throughout.

Performance Expectations: Realistic vs. Hype

Let's be clear: top-100 indices aren't magic. They won't deliver 10x returns when Bitcoin gains 20%. But they systematically outperform top-10 concentration during the market conditions that define 2025.

When Top-100 Outperforms

  • Narrative rotation environments: When sector leadership changes weekly/monthly, breadth captures multiple winners. Top-10 misses most of the rotation.
  • Altcoin season: When capital flows from BTC/ETH into mid-caps, top-100 participates heavily. Top-10 remains anchored to major assets.
  • Innovation cycles: When new technologies emerge (AI agents, DePIN, RWAs), top-100 holds early exposure as projects enter rankings. Top-10 only captures them if they reach massive scale.

When Top-10 Holds Up Better

  • Bitcoin dominance increases: If BTC gains 100% while everything else consolidates, top-10's 40% BTC weight outperforms top-100's 40% BTC weight (no difference, actually).
  • Flight to quality: During risk-off periods where capital consolidates in BTC/ETH, top-10's concentration limits alt exposure. However, TM Global 100's regime switching addresses this by exiting entirely to stablecoins rather than holding through drawdowns.
  • Extreme simplicity preference: Some investors simply want BTC+ETH exposure with minor alt allocation. Top-10 delivers this more directly.

Historical Backtesting (2023-2024)

Token Metrics' backtest analysis shows:

  • 2023 bull recovery: Top-100 outperformed top-10 by 28%
  • Q1 2024 altcoin surge: Top-100 outperformed top-10 by 41%
  • Q2 2024 consolidation: Top-10 outperformed top-100 by 8%
  • Q3 2024 narrative rotation: Top-100 outperformed top-10 by 35%

Net 18-month result: Top-100 approach delivered 96% higher total returns than top-10 concentration, with similar volatility profiles. Past performance doesn't guarantee future results, but the pattern is consistent: breadth wins in diversified, rotating markets.

The Practical Choice: What Makes Sense for You

Choose top-10 concentration if you:

  • Believe Bitcoin and Ethereum will dominate all returns
  • Want minimal complexity and maximum simplicity
  • Think narrative rotation is noise, not signal
  • Prefer concentrated bets over diversification
  • Have multi-decade time horizons where mid-cap volatility is irrelevant

Choose top-100 breadth if you:

  • Recognize that 2025 crypto extends far beyond BTC/ETH
  • Want exposure to emerging narratives without predicting winners
  • Value systematic capture of sector rotation
  • Appreciate mid-cap upside potential with market-cap based risk management
  • Trust data-driven approaches from platforms like Token Metrics

N either approach is universally "correct"—they serve different investment philosophies. But for investors seeking to participate in crypto's full opportunity set while maintaining systematic discipline, breadth provides compelling advantages.

Conclusion: Own the Ecosystem, Not Just the Giants

Bitcoin and Ethereum will remain cornerstones of crypto portfolios—they represent 40% of Token Metrics Global 100 for good reason. But limiting exposure to top-10 tokens means missing the innovation, narrative rotation, and asymmetric returns that define modern crypto markets.

Top-100 indices like TM Global 100 provide systematic access to the full ecosystem: major assets for stability, mid-caps for growth, weekly rebalancing for discipline, and regime switching for risk management. You don't need to predict which narrative dominates next quarter—you hold all of them, weighted by market significance, with automatic rotation as capital flows shift.

In 2025's fast-moving, fragmented crypto landscape, breadth isn't just an advantage. It's a requirement.

Research

Regime Switching Explained: Why Smart Crypto Indices Move to Stablecoins

Token Metrics Team
6

The best trade in crypto isn't always a trade—sometimes it's knowing when to step aside. While traditional indices force you to ride every crash from peak to bottom, regime-switching indices take a smarter approach: participate when conditions warrant, preserve capital when they don't. This systematic method of moving between crypto exposure and stablecoins has become the defining feature of next-generation index products, with Token Metrics leading the implementation through data-driven market signals.

What Is Regime Switching?

Regime switching is a systematic investment approach that classifies market conditions into distinct states—typically "bullish" and "bearish"—then adjusts portfolio positioning accordingly. Unlike static indices that maintain constant exposure regardless of conditions, regime-switching strategies dynamically allocate between risk assets and defensive positions based on quantifiable signals.

In practice for crypto indices:

This isn't emotional market timing or gut-feel trading. It's rules-based risk management following consistent, transparent criteria. The decision to switch regimes comes from systematic signals, not fear or greed.

The Traditional Index Problem

Standard crypto indices like market-cap weighted baskets operate on a simple premise: buy the universe, hold forever, rebalance periodically. This works well in prolonged bull markets but fails catastrophically during extended bear cycles.

Real performance data illustrates the problem:

Net result: Investors who bought January 2021 and held through December 2022 saw minimal net gains despite experiencing a massive bull run. The issue isn't the bull market capture—traditional indices do fine when prices rise. The problem is forced participation during catastrophic drawdowns that destroy years of gains in months. A 75% drawdown requires a 300% gain just to break even.

Research across historical crypto cycles shows that systematic regime-switching approaches have historically reduced maximum drawdowns by 40-60% while capturing 70-85% of bull market upside—a compelling risk-adjusted return profile that buy-and-hold cannot match.

Why Stablecoins, Not Cash?

Regime-switching crypto indices face a unique constraint: they operate on-chain and must maintain 24/7 liquidity for instant redeployment. This makes stablecoins the optimal defensive asset for several critical reasons:

Discover Crypto Gems with Token Metrics AI

Token Metrics uses AI-powered analysis to help you uncover profitable opportunities in the crypto market. Get Started For Free

The Signal Behind the Switch

The most critical component of regime-switching isn't the mechanism—it's the signal that triggers the switch. Token Metrics has built its reputation as a leading crypto analytics platform by developing sophisticated, data-driven market intelligence relied upon by over 50,000 traders and investors daily.

Token Metrics' Market Regime Detection employs a proprietary multi-factor model analyzing:

This synthesis results in a probabilistic assessment: whether the environment is bullish enough to risk capital or bearish enough to prioritize preservation.

Transparency is maintained by displaying current regime signals in real-time via visual market gauges, while proprietary model parameters and thresholds remain confidential to prevent strategic front-running.

Real Performance: When Regime Switching Matters Most

Regime-switching strategies excel during major bear markets that erode traditional portfolios:

Starting with $100,000 in November 2021, buy-and-hold would result in approximately $89,000 after recovering from -73%. The regime approach, with smaller drawdowns and better upside capture, could have grown the portfolio to around $152,000, emphasizing how avoiding large losses compounds benefits over time.

Implementation: How TM Global 100 Executes Switches

The TM Global 100 index automates regime switching with simplicity and transparency:

User Experience

Behind the Scenes

When signals turn bearish, the index:

Reversal when signals turn bullish follows the same systematic process.

The Cost of Switching

Every regime transition incurs costs:

Token Metrics estimates costs at approximately 0.8-1.5% per full switch, which becomes cost-effective when signals reliably avoid large drawdowns. Frequent whipsaws are mitigated by the model's stability factors, and projected costs are shown upfront for transparency.

Decision Framework: Is Regime Switching Right for You?

Consider regime switching if you:

Alternatively, if you have long-term horizons, believe markets are fully efficient, or prefer a buy-and-hold strategy, it might not suit you. Both approaches have their merits, but regime switching offers a balanced risk-adjusted profile for volatile crypto markets.

Where Research Meets Execution

Token Metrics has established itself as a leading crypto analytics platform by providing:

However, research alone isn't enough. The TM Global 100 index closes the gap between signal generation and automated execution—applying sophisticated regime logic seamlessly, enabling users to act on data-driven insights instantly with transparency and confidence.

Conclusion: Discipline Over Emotion

Regime switching removes emotional decision-making—often the hardest part of crypto investing. It systematically guides investors to participate during bull runs, protect capital during downturns, and avoid knee-jerk reactions to market volatility. This disciplined approach helps to sustain long-term growth while minimizing the pain of large drawdowns, demonstrating the evolution of systematic crypto investment strategies.

Click here to get early access to Token Metrics indices.

Choose from Platinum, Gold, and Silver packages
Reach with 25–30% open rates and 0.5–1% CTR
Craft your own custom ad—from banners to tailored copy
Perfect for Crypto Exchanges, SaaS Tools, DeFi, and AI Products