In today’s fast-paced world, busy professionals juggle demanding careers, family commitments, and personal goals, leaving little time to dive into the complexities of cryptocurrency investing. Yet, the crypto market represents one of the most significant digital asset growth opportunities of the century. With over 6,000 tokens to track, volatile market cycles, and security considerations, actively managing a crypto portfolio can feel overwhelming. Built-in diversification in crypto index funds automatically spreads risk across multiple cryptocurrencies, reducing exposure to the volatility of any single asset. The idea of becoming a crypto day trader is exhausting just to imagine.Fortunately, there is a smarter way. More than 75% of professional investors plan to increase their crypto allocations in 2025, but they’re not spending hours monitoring charts or executing trades. Instead, they rely on automated crypto index strategies designed to work quietly and efficiently, freeing them to focus on their careers and lives. Welcome to the set-and-forget crypto revolution tailored specifically for busy professionals.
Why Set-and-Forget Crypto Fits Busy Professionals
The Busy Professional's Dilemma: Opportunity vs. Time The cryptocurrency market has experienced explosive growth, now boasting over $4 trillion in market capitalization. Bitcoin alone has averaged annual returns exceeding 100% since its inception, while institutional adoption accelerates, with more than $27.4 billion pouring into U.S. Bitcoin ETFs. These figures underscore the immense potential of digital assets as part of a diversified portfolio.However, what the headlines often omit is the staggering time commitment traditionally required to achieve such returns. Successful crypto investing typically demands hundreds of hours researching projects, analyzing market trends, executing timely transactions, managing wallets across multiple blockchains, and navigating complex tax implications. For busy professionals—whether physicians, attorneys, executives, engineers, or entrepreneurs—this level of active management is simply unfeasible.You didn’t build your career by chasing every fleeting opportunity; you succeeded through strategic, disciplined investment approaches. The same principle applies to crypto investing. To harness the growth potential of the cryptocurrency market without sacrificing your valuable time, a different investment strategy is necessary.Crypto index funds investing offers an accessible and straightforward way for busy professionals to gain diversified exposure to cryptocurrencies. This diversified approach helps mitigate risk and simplifies the investment process, making it easier to participate in the crypto market without the need for constant active management.
The Set-and-Forget Philosophy: Why It Works In traditional finance, passive investing through diversified index funds consistently outperforms active trading over the long term. Studies reveal that over 90% of day traders lose money, whereas investors who buy and hold diversified portfolios achieve solid returns with minimal effort. This evidence is now being mirrored in the evolving crypto market.Despite its higher volatility compared to traditional financial markets, the infrastructure for intelligent passive investing in crypto has matured significantly by 2025. This progress enables comprehensive exposure to the crypto market with less than two hours of annual management time—a game changer for busy professionals.The set-and-forget approach thrives on three core advantages:
- Elimination of Emotional Decision-Making: Automated crypto index strategies operate on predetermined rules, removing the temptation to panic-sell during market crashes or chase FOMO-driven peaks. This disciplined approach consistently outperforms hands-on traders swayed by fear and greed.
- Compound Growth Through Consistency: Instead of attempting to time the market perfectly, systematic investing captures long-term growth trends. Your portfolio benefits from the overall upward trajectory of the cryptocurrency market, smoothing out short-term volatility. This approach allows investors to gain exposure to the broader crypto market without the need for constant monitoring or active trading.
- Opportunity Cost Optimization: Every minute spent monitoring crypto charts is time lost from advancing your career, nurturing relationships, or maintaining your health. For high-earning busy professionals, the opportunity cost of active management often exceeds any potential gains. Set-and-forget strategies return your time to your highest-value activities.
How the TM Global 100 Works
Token Metrics TM Global 100: Built for Your Schedule Token Metrics has pioneered a sophisticated set-and-forget crypto index fund designed explicitly for busy professionals: the TM Global 100 Index. Leveraging AI and machine learning to analyze over 6,000 digital assets, Token Metrics brings institutional-grade research and automation to your portfolio.Here’s why TM Global 100 fits seamlessly into your demanding schedule:
90-Second Initial Setup: Setting up your account is as quick as ordering coffee. You connect your embedded smart wallet, review the index methodology and current holdings, choose your investment amount, and execute. No complicated exchange accounts, no juggling multiple wallets, and no manual token purchases. The entire process is streamlined for non-technical users.
Weekly Automatic Rebalancing: Every Monday at 00:00 UTC, your portfolio automatically rebalances to maintain optimal exposure to the top 100 cryptocurrencies by market capitalization. The system sells tokens that have dropped out of the Top 100, buys new entries, adjusts weights to reflect market cap changes, and optimizes transaction fees—all handled by smart contracts. The TM Global 100 is a holdings based index fund that follows a systematic approach to tracking indices of the top cryptocurrencies, ensuring the portfolio remains aligned with market trends. You receive optional notifications but no action is required.
Transparent Monitoring Without Active Management: Token Metrics offers a clean dashboard with an interactive treemap of your holdings, real-time profit and loss tracking, transaction history, and performance analytics. Whether you check monthly, quarterly, or less frequently, your portfolio grows independently of your attention.
Tax Documentation Simplified: All transactions are logged with timestamps, quantities, prices, and fees, making tax reporting straightforward. Export data to popular crypto tax software or share with your accountant without scrambling to reconstruct trades.This infrastructure means you spend just 90 seconds setting up, zero hours managing ongoing operations, and perhaps 30 minutes quarterly reviewing performance. In total, less than two hours annually provides diversified exposure to 100 leading cryptocurrencies.
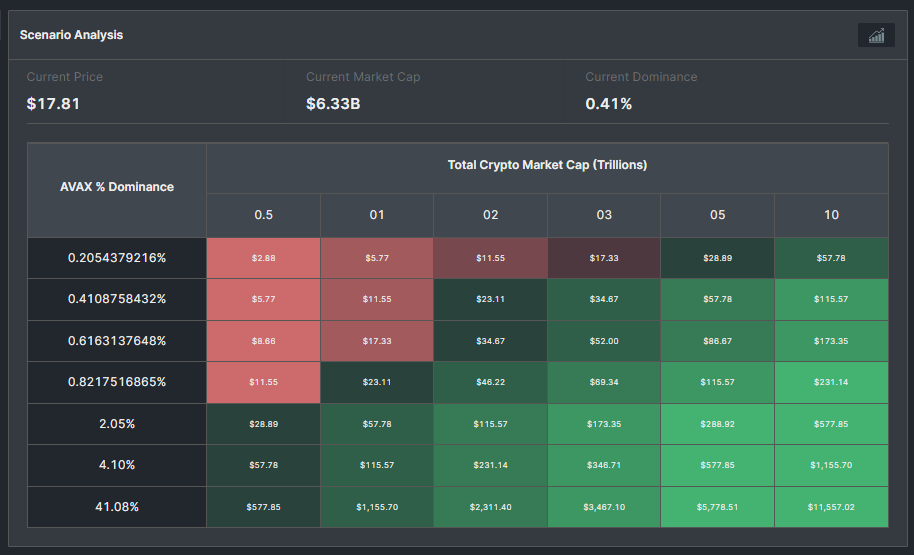
Index Methodology and Construction: How Your Crypto Index Is Built The foundation of any successful crypto index fund lies in its index methodology and construction. This process determines which cryptocurrencies are included in the fund, how much weight each one carries, and how often the portfolio is adjusted to reflect changes in the market. For busy professionals, understanding these mechanics is key to appreciating how crypto index funds provide diversified exposure while managing the risks of the volatile crypto market.Most crypto index funds start by selecting a universe of individual cryptocurrencies based on specific criteria—such as market capitalization, liquidity, or project fundamentals. For example, a market cap-weighted index fund will allocate a larger portion of the portfolio to established cryptocurrencies like Bitcoin and Ethereum, as their market capitalization dominates the crypto market. This approach helps ensure that your portfolio reflects the overall market trends and reduces the impact of any single cryptocurrency’s performance.Alternatively, some index funds use an equal-weighted methodology, giving each cryptocurrency the same allocation regardless of its market cap. This can increase exposure to emerging projects but may also introduce more volatility. Periodic rebalancing—often weekly or monthly—ensures that the portfolio stays aligned with the chosen index methodology, automatically adjusting for market changes and maintaining diversified exposure.By relying on a transparent, rules-based index methodology, crypto index funds help investors navigate the complexities of the crypto market, spreading risk across a broad portfolio and reducing the need for constant oversight. This systematic approach is especially valuable for those who want to invest in crypto without getting bogged down in the details of individual cryptocurrencies.
Comparing Traditional and Crypto Index Funds
Traditional Index Funds vs Crypto Index Funds: What Busy Professionals Need to Know For busy professionals weighing their investment options, it’s important to understand how traditional index funds and crypto index funds differ significantly. Traditional index funds typically track established indices like the S&P 500, offering diversified exposure to a basket of stocks or bonds. These funds are known for their stability, lower risk, and steady long-term growth, making them a familiar choice for many investors.Crypto index funds, on the other hand, invest in a portfolio of digital assets such as Bitcoin, Ethereum, and other leading cryptocurrencies. While crypto index funds offer the potential for higher returns, they also come with greater volatility and risk due to the rapidly evolving nature of the cryptocurrency market. The value of a crypto index can fluctuate dramatically in response to market trends, regulatory changes, or technological developments.For those new to crypto investing, traditional index funds may feel more comfortable and predictable. However, professionals with a higher risk tolerance and a long-term investment horizon may find that crypto index funds offer unique opportunities for growth and diversification that traditional financial markets can’t match. Ultimately, the right choice depends on your individual risk tolerance, investment goals, and willingness to embrace the dynamic world of digital assets.
Built-In Protection: The Safety Net Busy Professionals Need Unlike traditional buy-and-hold strategies, Token Metrics’ TM Global 100 includes intelligent risk management designed to protect your investment without requiring your attention. This is critical in the highly volatile crypto market, which has historically experienced multiple 80%+ corrections. Market volatility is a significant risk factor, and the TM Global 100 is specifically designed to address this through its automated risk management features.The TM Global 100 employs regime-switching logic, an AI-driven method that dynamically adjusts portfolio exposure based on market conditions. When proprietary market indicators signal bullish regimes, your portfolio holds the full basket of top 100 cryptocurrencies, capturing growth across the market. When bearish signals emerge, the system automatically converts holdings into stablecoins like USDC, preserving capital during downturns. Once conditions improve, funds redeploy back into the crypto market at lower prices.This automated safety net prevents panic-selling and shields your portfolio from severe drawdowns. For busy professionals without time to monitor market changes constantly, this feature offers peace of mind and a disciplined approach to risk.Consider a real-world example: you invest $100,000 in January, and by March, your portfolio grows to $140,000 amid a strong market. In April, bearish signals trigger a shift to stablecoins, locking in your gains. While the broader market drops 40% over the next two months, your position remains stable. When bullish conditions return in July, the system re-enters the market at lower prices, increasing your token holdings—all without you lifting a finger.
AI Filtering, Consistency, and Security
Quality Over Quantity: AI-Powered Filtering Not all cryptocurrencies in the Top 100 by market cap deserve inclusion in your portfolio. Some represent genuine innovation, while others are speculative or risky projects. Token Metrics enhances traditional market cap indexing with sophisticated quality filters powered by AI.Each token is evaluated using two complementary ratings:
Trader Grade: This rating assesses short-term momentum, technical strength, volume trends, and timing signals to ensure tokens demonstrate genuine market strength rather than pump-and-dump schemes.
Investor Grade: This grade evaluates long-term fundamentals such as development activity, network growth, use case viability, team quality, and competitive positioning, highlighting sustainable projects with real value.By analyzing over 80 data points per token, Token Metrics continuously refines your exposure, favoring quality holdings over blind market cap weighting. This institutional-grade due diligence is impossible to replicate manually and crucial for busy professionals who lack time for deep research.
The Compound Effect: Why Consistency Beats Timing One of the biggest pitfalls for busy professionals entering crypto is attempting to time the market perfectly. Waiting for the “right moment” often leads to missed rallies, panic during corrections, and suboptimal returns.Token Metrics’ set-and-forget approach aligns with Nobel Prize-winning economic research showing that consistent, disciplined investing outperforms attempts at market timing. By maintaining systematic exposure during bullish regimes and automatically managing risk during bearish phases, the TM Global 100 captures the long-term growth of the cryptocurrency market without emotional stress or guesswork.In fact, in 2025, over 60% of cryptocurrency trading volume flows through automated systems. Institutional investors, family offices, and professional traders overwhelmingly favor systematic strategies over reactive trading. Token Metrics democratizes access to these sophisticated investment methods for individual busy professionals.
Security Without Complexity Security is a paramount concern for busy professionals considering crypto investments. High-profile exchange hacks, lost private keys, and stolen funds are common headlines. Yet, few have the time or expertise to become cybersecurity experts.Token Metrics addresses these concerns with embedded smart wallet technology that offers self-custody without complexity. Your assets remain under your control, not on vulnerable exchanges. The wallet uses advanced features like multi-party computation, secure key sharding, social recovery mechanisms, and automatic security updates to protect your holdings.This approach combines institutional-grade security with consumer-grade simplicity. You don’t need to memorize seed phrases or manage hardware wallets. The system is designed so that busy professionals can confidently secure their digital assets without technical headaches.
Costs, Taxes, Getting Started, and Conclusion
Investment Minimums and Fees: What to Expect When considering crypto index funds, it’s essential to be aware of investment minimums and fees, as these factors can impact your overall returns. Minimum investment requirements vary by provider, with some crypto index funds accessible for just a few hundred dollars, while others may require a more substantial initial commitment.Management fees are another key consideration. Crypto index funds typically charge annual management fees ranging from 0.5% to 2.5%, which cover the costs of research, trading, and portfolio administration. Some funds may also include additional expenses, such as an expense ratio or transaction fees, which can differ significantly between providers.Before investing, take the time to review the fee structure and minimum investment requirements of any crypto index fund you’re considering. Understanding these costs will help you select a fund that aligns with your investment goals and risk tolerance, ensuring that fees don’t erode your returns over time. For busy professionals, choosing a fund with transparent, reasonable fees and accessible minimums can make crypto investing both efficient and cost-effective.
Tax Implications: Planning Ahead for Peace of Mind Tax implications are an important aspect of investing in crypto index funds that busy professionals can’t afford to overlook. In most jurisdictions, gains from the sale or exchange of cryptocurrencies are subject to capital gains tax, with rates depending on your income bracket and how long you’ve held the investment. The tax treatment of crypto index funds may also vary based on the fund’s structure and local regulations.To avoid surprises at tax time, it’s wise to consult with a tax professional who understands both traditional and digital asset investments. Keeping detailed records of all your transactions—including dates, amounts, and the purpose of each trade—will make tax reporting much simpler and help ensure compliance with current laws.By planning ahead and staying organized, you can minimize your tax liabilities and maximize your after-tax returns. This proactive approach allows you to focus on your long-term investment goals, knowing that your crypto index fund investments are managed efficiently and in line with regulatory requirements. For busy professionals, a little preparation goes a long way toward achieving peace of mind and financial success.
The Cost of Inaction for Busy Professionals While you’ve been “too busy” to invest systematically in crypto, the asset class has created more millionaires in the past decade than perhaps any other investment vehicle. Many of your peers—doctors, lawyers, executives—who allocated even modest portions of their portfolios to crypto index funds have experienced life-changing returns.The question is no longer whether busy professionals should invest in crypto. With 75% of institutional investors increasing allocations and crypto entering mainstream finance through ETFs, stablecoins, and tokenized assets, the opportunity is clear. The real question is how to invest intelligently without sacrificing the time that made you successful in your primary career.Token Metrics’ TM Global 100 offers the answer: broad exposure to crypto’s growth potential, built-in risk management, quality filtering of holdings, automated execution requiring zero ongoing effort, and transparent monitoring that fits your schedule.
Getting Started: Your Two-Hour Annual Commitment For busy professionals ready to add sophisticated crypto exposure to their portfolios, the process is straightforward:Hour One (Initial Setup): Visit the Token Metrics platform, review the TM Global 100 strategy and index methodology, create your embedded smart wallet (takes about 90 seconds), decide your allocation based on your investment goals and risk tolerance, and execute your initial purchase. That’s it.Quarterly 15-Minute Check-ins (Optional): Review your portfolio’s performance dashboard to see current holdings and returns, examine transaction logs to understand rebalancing activity, adjust your allocation if your circumstances change, and export data for tax reporting.This minimal time commitment ensures your crypto portfolio grows systematically while you focus on your career, family, and health.
Conclusion: Smart Professionals Automate The most successful professionals understand a core principle: automate everything that can be systematized and concentrate your energy on what requires your unique skills. Crypto investing is no exception.Token Metrics’ TM Global 100 represents years of development tailored for investors demanding sophistication without constant involvement. AI-powered analytics track over 6,000 projects, weekly automatic rebalancing captures market trends, regime-switching protection manages downside risk, quality filtering ensures legitimate exposure, and embedded wallets provide security without complexity—all functioning seamlessly whether you monitor daily or not.In 2025, the barrier to crypto investing is no longer technical knowledge or education—it’s decisional. Will you let being busy prevent you from participating in one of the most significant wealth-building opportunities of your generation? Or will you spend 90 seconds setting up a systematic, intelligent crypto index fund that works while you focus on what truly matters?For busy professionals who built successful careers through discipline, strategy, and intelligent automation, the choice is clear. Welcome to set-and-forget crypto investing. Your future self will thank you.Click here to get early access to TM100 indices at Token Metrics.
Discover Crypto Gems with Token Metrics AI
Token Metrics uses AI-powered analysis to help you uncover profitable opportunities in the crypto market. Get Started For Free
FAQ: What is a crypto index fund?
A crypto index fund provides diversified exposure to a basket of cryptocurrencies based on rules such as market capitalization, liquidity thresholds, and scheduled rebalancing, reducing reliance on any single asset.
FAQ: How often do crypto index funds rebalance?
Rebalancing schedules vary by provider and methodology. Some funds rebalance weekly or monthly to maintain target weights and reflect market changes, while minimizing tracking error and transaction costs.
FAQ: What are the main risks of crypto index funds?
Key risks include market volatility, regulatory changes, custody/security considerations, and methodology risk (e.g., how constituents are selected and weighted). Transparent rules and risk management can help address these factors.
FAQ: How do fees impact returns?
Management fees, expense ratios, and transaction costs reduce net performance. Reviewing a fund’s full fee schedule helps you understand potential drag on returns and compare providers objectively.
FAQ: What tax considerations apply?
Tax treatment depends on jurisdiction and holding period. Capital gains may apply on sales and rebalancing events. Maintaining detailed records and consulting a qualified tax professional is recommended.
FAQ: How does AI help in crypto indexing?
AI can assist with quality screening, anomaly detection, market regime analysis, and risk controls. Platforms like Token Metrics use data-driven models to support systematic selection and monitoring.
Disclaimer
This article is for educational and informational purposes only and should not be construed as financial, investment, or tax advice. Digital assets are volatile and carry risk. Always conduct your own research and consult qualified professionals regarding your specific circumstances.


%201.svg)
%201.svg)


.svg)


%201.svg)

.png)


.svg)


.png)