Crypto Market Turns Bearish: Expert Analysis on Bitcoin, Ethereum, and Top Altcoin Opportunities
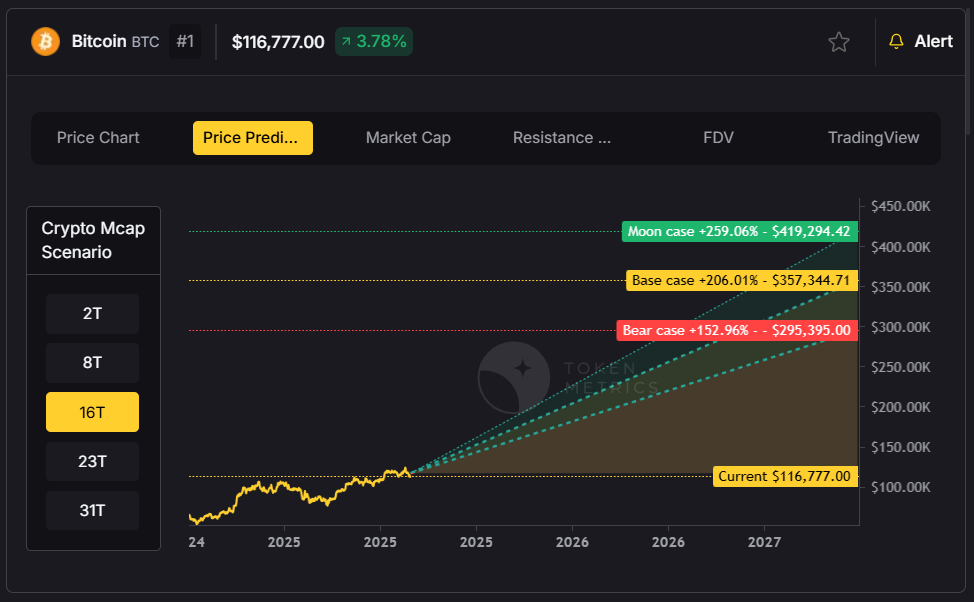
Bitcoin, currently trading around $114,000, has experienced what analysts describe as "momentum crashing." Despite reaching an all-time high of $124,000 just last week, the world's largest cryptocurrency has retreated below $115,000, triggering a clear sell signal on technical indicators.
Token Metrics Team
6 min
Want Smarter Crypto Picks—Free?
See unbiased Token Metrics Ratings for BTC, ETH, and top alts.
Thank you! Your submission has been received!
Oops! Something went wrong while submitting the form.
No credit card | 1-click unsubscribe
The cryptocurrency market has officially shifted into risk-off mode, marking a significant change from the bullish momentum we've witnessed over recent months. According to leading crypto analysts from Token Matrics, while the overall market indicator shows "neutral," the underlying momentum has been declining dramatically – a pattern that demands immediate attention from investors.
Bitcoin's Momentum Crash Signals Market Shift
Bitcoin, currently trading around $114,000, has experienced what analysts describe as "momentum crashing." Despite reaching an all-time high of $124,000 just last week, the world's largest cryptocurrency has retreated below $115,000, triggering a clear sell signal on technical indicators.
This dramatic shift becomes even more apparent when examining the Bitcoin vs Altcoin Season indicator. From July 10th, when 90% of returns were concentrated in Bitcoin during its price discovery phase, the market briefly shifted to an even split between Bitcoin and altcoin returns. However, we're now witnessing a return to Bitcoin dominance – a classic sign of risk-off sentiment among crypto investors.
"I think this is just probably a healthy cooling-off correction. I don't think this is the end per se," explains Ian Belina, highlighting that while the current pullback appears significant, it may represent a necessary market reset rather than a trend reversal.
Ethereum Emerges as the Clear Winner
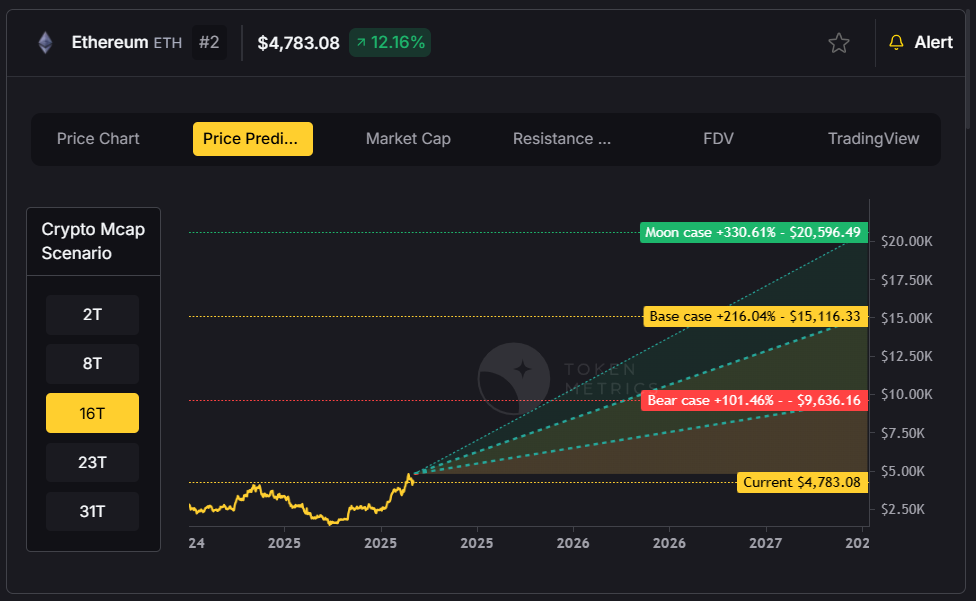
While Bitcoin struggles with declining momentum, Ethereum has emerged as the standout performer, demonstrating remarkable resilience in the current market environment. Trading around $4,300, Ethereum has surged approximately 70% since June, vastly outperforming Bitcoin's modest 9-10% gains over the same period.
The ETH/BTC ratio has climbed to 2025 highs at 0.037%, signaling a significant shift in investor preference toward Ethereum-based assets. This performance is particularly noteworthy given the regulatory clarity emerging in the United States, which has created favorable conditions for stablecoin protocols and crypto treasury adoption.
Abdullah, Head of Research & Investments at Token Matrics, remains bullish on Ethereum's prospects: "As long as ETH is above 4k, I think ETH holders shouldn't be worried. Ethereum will keep outperforming Bitcoin and Solana within the next one to three months."
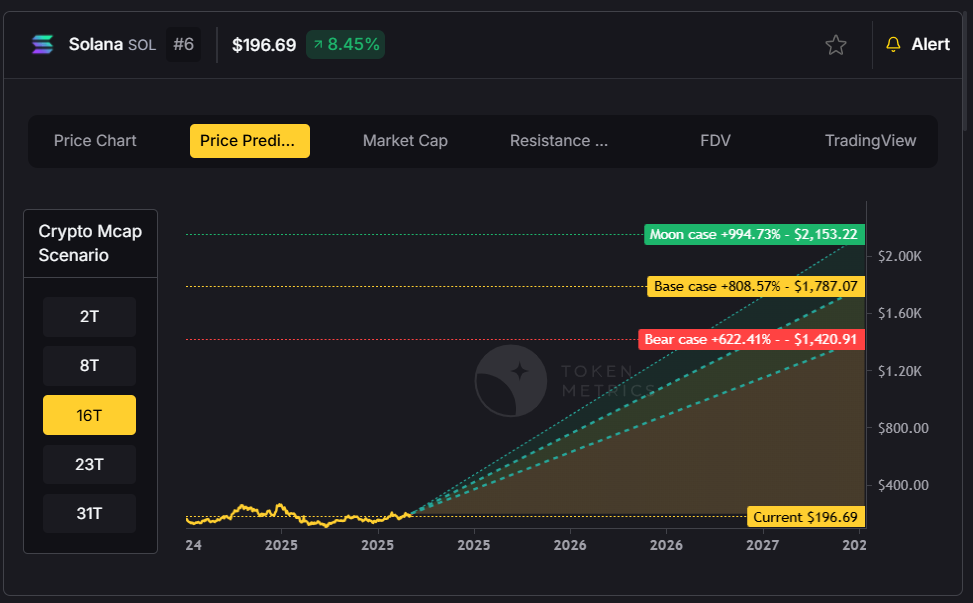
Solana Faces Potential 30-40% Correction
Solana presents a more concerning picture, with analysts expecting a potential capitulation event that could see the token decline 30-40% from current levels. Having broken major technical support levels, Solana's momentum indicators have turned decidedly bearish.
However, this bearish outlook comes with a silver lining for long-term investors. "I think it will be a purely buy the dip opportunity before Solana starts to run again for $500 or maybe $1,000 by the end of the cycle," notes Abdullah, suggesting that current weakness may present attractive entry points for patient investors.
Treasury Companies Drive Institutional Adoption
A major catalyst supporting the crypto market's long-term outlook is the continued accumulation by corporate treasuries. MicroStrategy recently purchased an additional 430 Bitcoin for $51 million, bringing its total holdings to approximately $7.2 billion with unrealized gains of $2.6 billion.
The trend extends beyond Bitcoin, with Ethereum treasuries gaining significant momentum. Bitcoin Immersion, led by Tom Lee, has acquired 1.52 million ETH valued at $6.6 billion, making it the second-largest public crypto treasury behind MicroStrategy and the largest for Ethereum specifically.
These institutional moves represent more than mere speculation – they signal a fundamental shift toward crypto as a legitimate treasury asset. As of now, 4% of Bitcoin's supply and 2% of Ethereum's supply is held by public companies and treasury entities.
Top Trading Opportunities in Current Market
Despite the overall bearish sentiment, several tokens continue to show strength and present compelling trading opportunities:
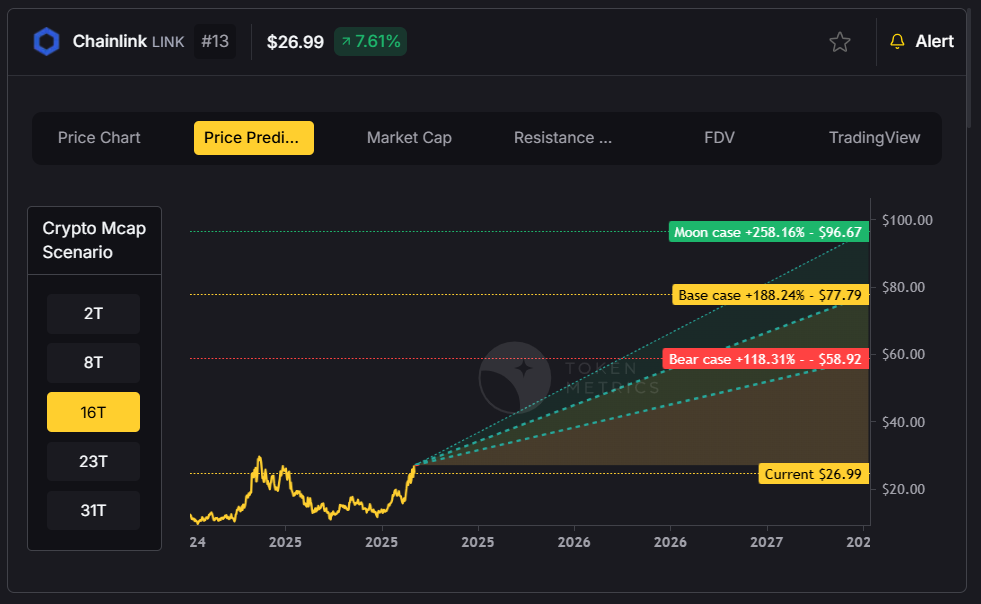
Chainlink (LINK)
Chainlink has emerged as a standout performer, recently breaking through the $22-$23 resistance level that had acted as a range high for over two years. The enterprise L1 narrative is driving adoption, as Wall Street-backed firms launching their own Layer 1 blockchains require reliable oracle services.
"I think it's only a matter of time till Chainlink sees a new all-time high," predicts Abdullah, citing the protocol's dominant market position and recent tokenomics improvements, including a buyback program tied to enterprise revenue.
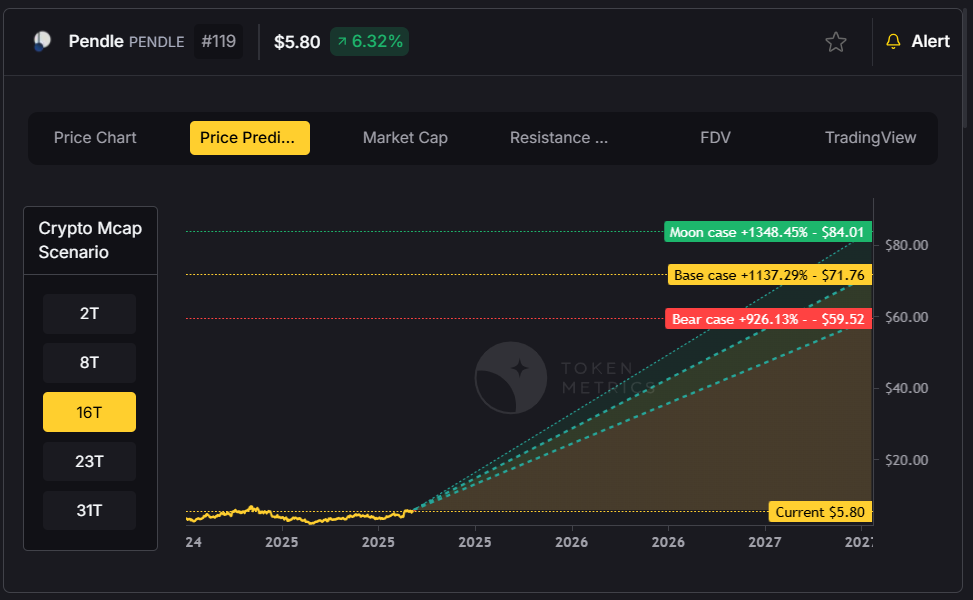
Pendle (PENDLE)
Despite being undervalued relative to its fundamentals, Pendle continues to show strength with a Total Value Locked (TVL) of approximately $10 billion against a market cap of only $1.4 billion. As the leading yield trading platform, Pendle offers institutional investors the ability to fix yields and trade funding rates with leverage.
Base Ecosystem Tokens
Tokens within the Base ecosystem, including Aerodrome and Zora, have shown resilience despite recent corrections. With Coinbase planning to expand DEX trading access beyond the current 1% of users, these protocols could see significant volume increases.
Market Outlook and Strategy
Looking ahead, analysts expect a consolidation or correction period lasting several weeks into mid-to-late September. However, Q4 remains positioned for potential bullish momentum, particularly if the Federal Reserve delivers dovish commentary at the upcoming Jackson Hole speech.
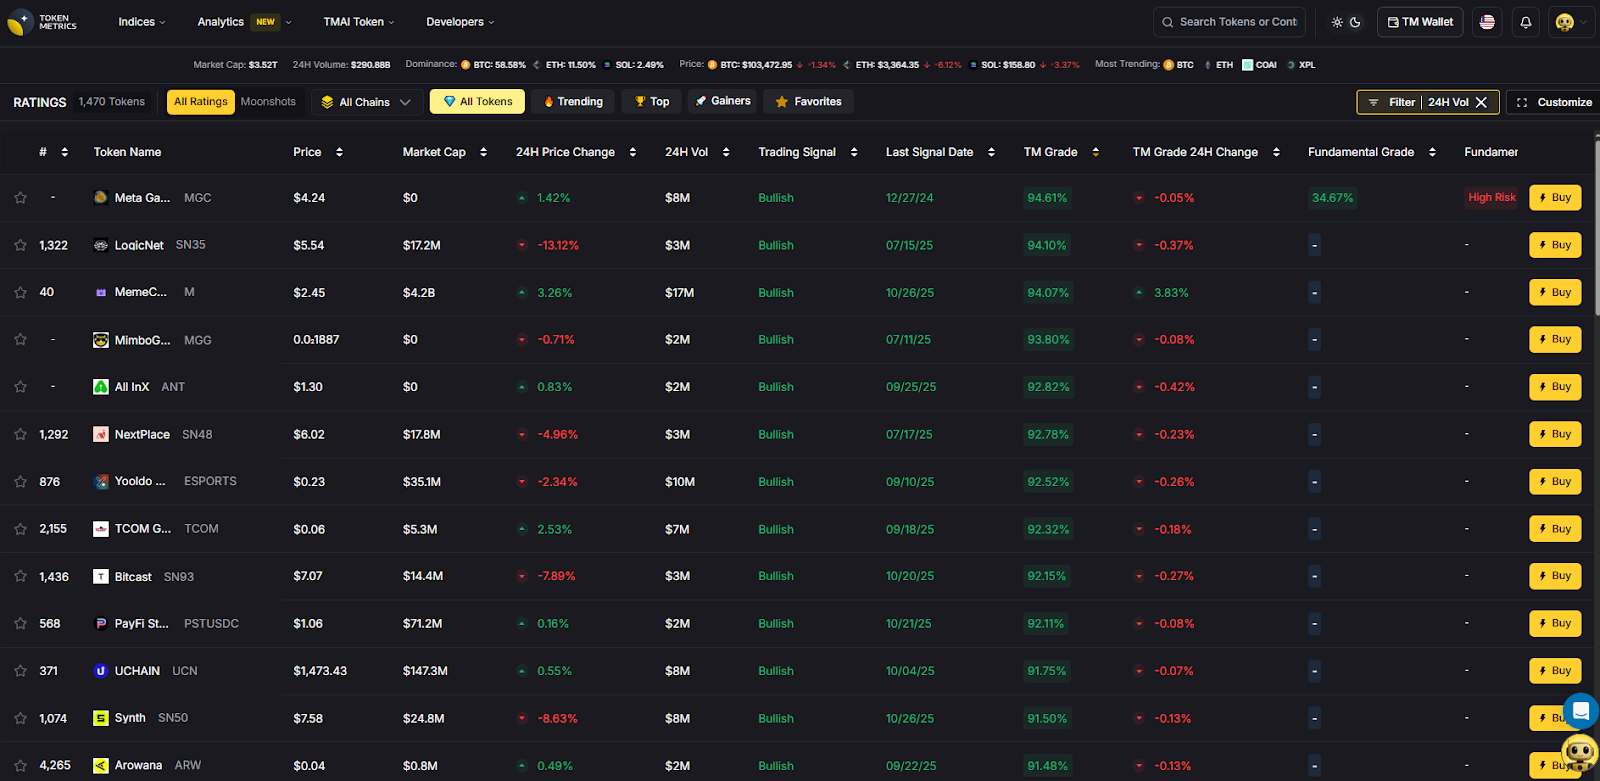
The key for investors lies in monitoring critical indicators: the market sentiment gauge, Bitcoin vs Altcoin season metrics, and individual token momentum scores. When over 60% of market returns shift to altcoins while the overall market shows strong buy signals, it typically indicates an optimal profit-taking opportunity.
For those navigating this complex environment, focusing on tokens with strong fundamentals, high trader grades (80%+), and positive momentum indicators remains the most prudent approach. While the current market presents challenges, it also offers opportunities for those who can correctly identify and time the strongest performers in each narrative cycle.
The crypto market's evolution continues, and while short-term volatility is inevitable, the underlying infrastructure and institutional adoption trends suggest a maturing asset class with significant long-term potential.
Build Smarter Crypto Apps & AI Agents in Minutes, Not Months
Real-time prices, trading signals, and on-chain insights all from one powerful API.
Token Metrics: AI-powered crypto research and ratings platform. We help investors make smarter decisions with unbiased Token Metrics Ratings, on-chain analytics, and editor-curated “Top 10” guides. Our platform distills thousands of data points into clear scores, trends, and alerts you can act on.
See unbiased Token Metrics Ratings for BTC, ETH, and top alts.
Thank you! Your submission has been received!
Oops! Something went wrong while submitting the form.
No credit card | 1-click unsubscribe
Token Metrics Team
The Token Metrics Team comprises blockchain and cryptocurrency experts dedicated to providing accurate information and empowering investors. Through our blog, we aim to educate and inspire readers to navigate the world of cryptocurrencies confidently.
Token Metrics Team
The Token Metrics Team comprises blockchain and cryptocurrency experts dedicated to providing accurate information and empowering investors. Through our blog, we aim to educate and inspire readers to navigate the world of cryptocurrencies confidently.
Create Your Free Token Metrics Account
Access our Ratings Page for valuable token insights
Explore our Market Page for a comprehensive market overview
Stay in the loop with exclusive weekly Newsletters filled with insider tips and updates
Join our private Telegram group for exclusive community access
Who this guide is for: DeFi liquidity providers seeking automated management of concentrated liquidity positions on AMMs like Uniswap v3, v4, and other CLAMMs (Concentrated Liquidity Automated Market Makers).
Top three picks:
Gamma Strategies — Best for multi-chain automated vault strategies with proven track record
Arrakis Finance — Best for institutional-grade liquidity management and token launch support
Steer Protocol — Best for off-chain compute and cross-chain strategy deployment
Key caveat: Concentrated liquidity managers cannot eliminate impermanent loss; they optimize range management to maximize fee generation, but market volatility can still result in divergence loss. Always verify supported chains and fee structures before depositing.
Introduction: Why AMM Concentrated Liquidity Managers Matter in November 2025
Concentrated liquidity has transformed DeFi capital efficiency since Uniswap v3's 2021 launch, allowing liquidity providers to concentrate capital within specific price ranges for higher fee generation. However, managing these positions requires active monitoring, frequent rebalancing, and sophisticated strategies to remain in-range and profitable—a challenge for most LPs.
AMM concentrated liquidity managers are protocols that automate the complex task of managing concentrated liquidity positions across decentralized exchanges. These platforms use algorithmic strategies to rebalance ranges, compound fees, and optimize capital deployment, transforming concentrated liquidity from an active management burden into a passive income opportunity.
With Uniswap v4's January 2025 launch introducing hooks and new customization capabilities, the concentrated liquidity management landscape has expanded dramatically. LPs now need solutions that can navigate multiple AMMs, chains, and strategy types while maximizing returns and minimizing risks like impermanent loss and out-of-range periods.
This guide evaluates the leading concentrated liquidity managers serving retail LPs, DAOs, and protocols in 2025, helping you select platforms that align with your risk tolerance, capital requirements, and yield objectives.
How We Picked (Methodology & Scoring)
We evaluated 20+ concentrated liquidity management platforms and selected the top 10 based on weighted criteria:
Liquidity Under Management — 30%: Total value locked (TVL) and managed positions across chains
UX & Accessibility — 5%: Interface quality, documentation, and ease of use
Data sources: Official protocol documentation, pricing pages, security audit reports, blockchain explorers, and TVL data from DefiLlama (cross-checked only; not linked in article body).
Last updated: November 2025
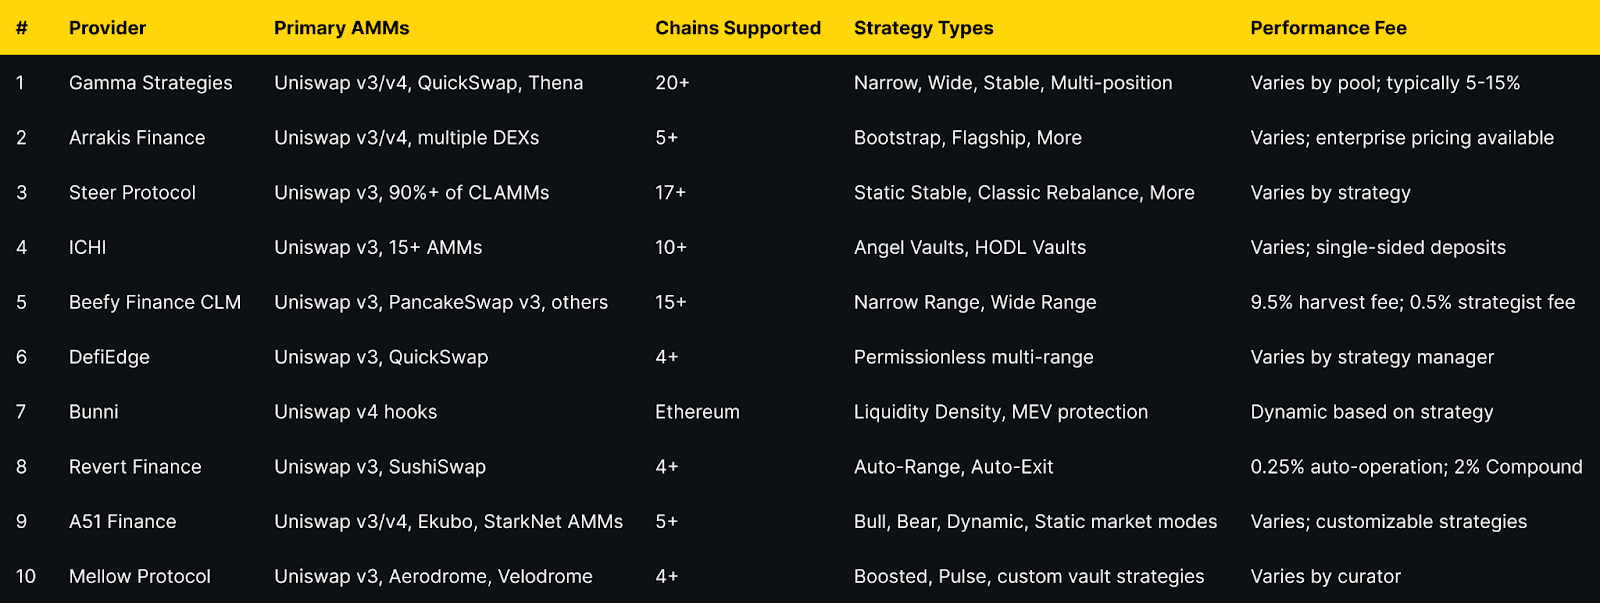
Best AMM Concentrated Liquidity Managers in November 2025 (Comparison Table)
Top 10 AMM Concentrated Liquidity Managers in November 2025
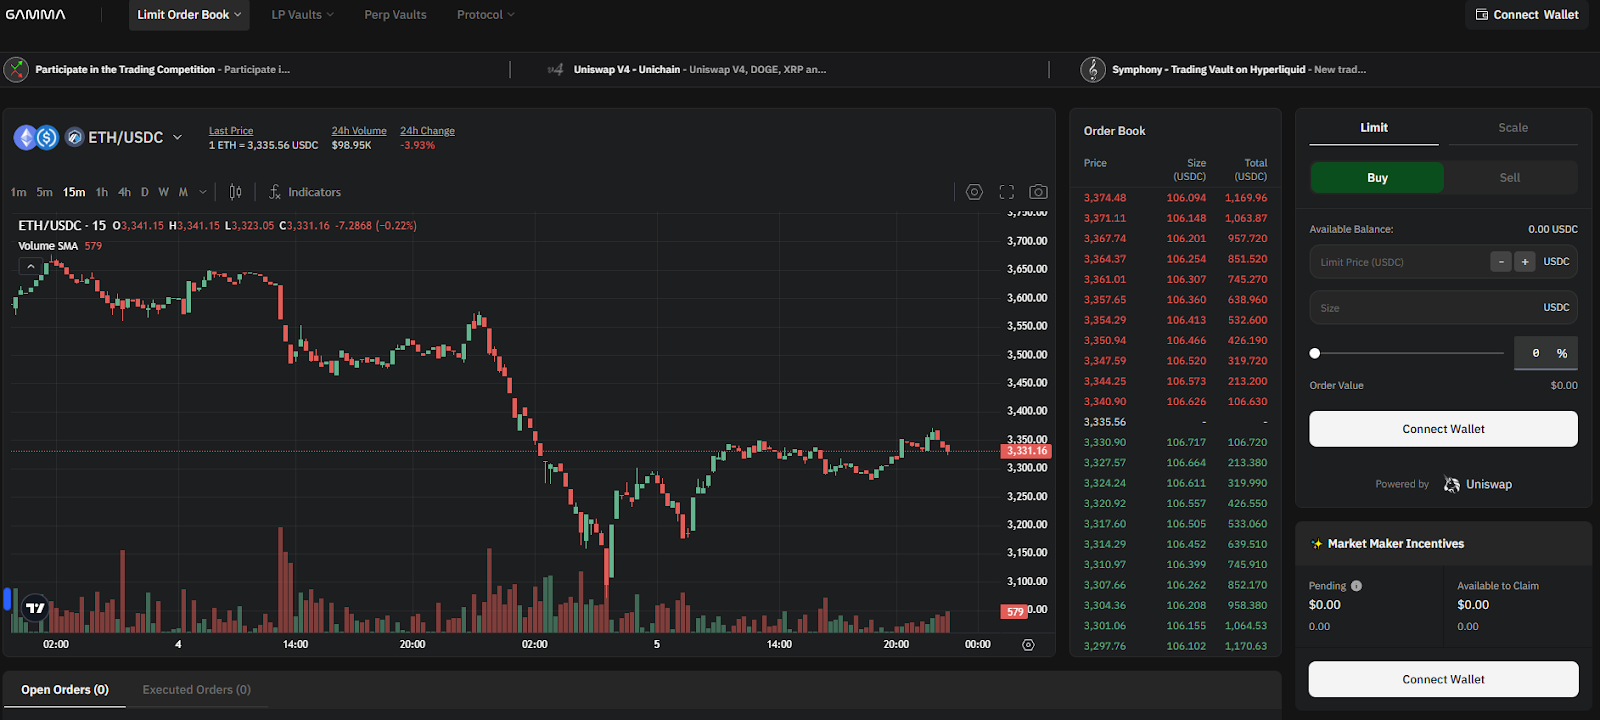
Gamma Strategies operates as the most established concentrated liquidity manager with over four years of production history since March 2021. Their Hypervisor vault system automatically rebalances positions, compounds fees, and manages ranges across 20+ blockchains and multiple AMM protocols. Gamma's non-custodial approach means LPs retain control while benefiting from algorithmic management that maximizes capital efficiency and fee generation.
DAOs and protocols requiring active liquidity management
LPs wanting automated fee compounding without manual intervention
Users preferring ERC-20 LP tokens over NFT positions
Notable Features
Hypervisor smart contracts with automated rebalancing
Supports dual-position and multi-position strategies (up to 20 positions on Uniswap v4)
ERC-20 LP tokens for composability in DeFi
Integration with major DEXs including Uniswap v3/v4, QuickSwap, Thena, Beamswap
GAMMA token staking for fee-sharing
Consider If: Supported on 20+ chains but fee structures vary by pool; verify specific pool performance fees before depositing. Some pools charge 10-15% of generated fees.
Regions: Global; no geographic restrictions
Alternatives: Arrakis Finance, Steer Protocol
2. Arrakis Finance — Best for Institutional Liquidity Management
Why Use It
Arrakis Finance delivers MEV-aware onchain market making specifically designed for token issuers and institutional liquidity providers. Their Arrakis Pro service offers white-glove liquidity management with strategic templates including Bootstrap for TGE, Flagship for mature projects, and Treasury Diversification for passive accumulation. Arrakis has become the go-to solution for protocols like ether.fi, Euler, and Stargate seeking professional-grade liquidity infrastructure.
Steer Protocol distinguishes itself through decentralized off-chain computation that enables sophisticated strategy execution without on-chain gas overhead. Supporting 17+ chains and over 90% of concentrated liquidity AMMs, Steer provides automated range management using strategies like Elastic Expansion (Bollinger Bands), Moving Volatility Channel (Keltner), and Static Stable for pegged assets. Their infrastructure powers liquidity automation for platforms like QuickSwap, Taiko, and Kinetic.
ICHI's Yield IQ vaults revolutionize concentrated liquidity provision by accepting single-token deposits, eliminating the need for LPs to hold both sides of a trading pair. Using algorithmic strategies that maintain an 80:20 ratio, ICHI enables users to earn concentrated liquidity fees while effectively holding a single asset. Their Angel Vaults create buy-side liquidity that supports price stability for project tokens.
Best For
LPs wanting single-token exposure without impermanent loss on both sides
Projects seeking buy-side liquidity support
Long-term holders wanting to earn yield without selling tokens
DAOs managing treasury diversification
Notable Features
Single-sided liquidity deposits (Angel Vaults and HODL Vaults)
Automated rebalancing with Chainlink Keepers
80:20 asset ratio maintenance
Support for 15+ AMMs across 10+ networks
Integration with concentrated liquidity incentive programs
Consider If: 80:20 rebalancing means you'll still experience some token ratio changes; not pure single-asset exposure. Best for those comfortable with managed rebalancing.
Fees Notes: Varies by vault; performance fees typically 5-10% of yields
Regions: Global; available on multiple L1s and L2s
Beefy's Concentrated Liquidity Manager (CLM) extends their proven auto-compounding infrastructure to concentrated liquidity pools, providing automated range management integrated with Beefy's broader yield optimization ecosystem. Their "Cow Token" system converts non-fungible CL positions into fungible ERC-20 tokens while maximizing capital utilization through strategies that keep positions in-range and fully active.
Best For
Existing Beefy users expanding into concentrated liquidity
LPs seeking integrated yield farming and CLM
Multi-chain passive investors
Users wanting fungible CL position tokens
Notable Features
Integration with Beefy's yield optimizer ecosystem
Supports 15+ chains including BSC, Arbitrum, Polygon, Base, Avalanche
Narrow and wide range strategies
ERC-20 "Cow Tokens" for fungible CL positions
Automatic fee compounding
Consider If: 9.5% harvest fee is higher than some competitors; suitable for long-term holders where compounding benefits outweigh fees.
Fees Notes: 9.5% performance fee on harvest; 0.5% to strategist; variable harvest call fee
DefiEdge creates a permissionless layer over concentrated liquidity AMMs where strategy managers can deploy custom strategies supporting up to 20 price ranges and built-in limit orders. This marketplace approach allows LPs to select from community-created strategies or deploy their own, providing unprecedented flexibility in concentrated liquidity management.
Bunni emerged as the leading Uniswap v4 hook implementation, using programmable Liquidity Density Functions (LDFs) to create custom liquidity shapes within concentrated ranges. Their Shapeshifting feature dynamically adjusts positions, while MEV protection through am-AMM auctions and Surge Fees recaptures value that would otherwise go to arbitrageurs. Bunni also rehypothecates idle capital to Aave and Yearn for additional yield.
Revert Finance combines powerful analytics tools with automated management features, enabling LPs to backtest strategies, analyze top-performing positions, and then deploy automation like Auto-Range (automatic rebalancing) and Auto-Exit (stop-loss protection). Their Initiator tool allows LPs to simulate historical performance before committing capital, making Revert ideal for data-driven liquidity providers.
Best For
Analytical LPs wanting to backtest before deploying
A51 Finance (formerly Unipilot) offers autonomous liquidity provisioning with highly customizable parameters including market modes (Bull, Bear, Dynamic, Static), rebasing strategies, and liquidity distribution patterns. Supporting Uniswap v3/v4 and expanding to StarkNet, A51 empowers LPs to design advanced strategies using hooks while addressing loss-versus-rebalancing (LVR) through sophisticated hedging mechanisms.
Mellow Protocol provides infrastructure for institutional-grade vaults with sophisticated curator models where professional risk managers and funds deploy strategies on behalf of LPs. While their focus has shifted toward broader vault infrastructure, Mellow's ALM toolkit remains integrated with Aerodrome and Velodrome, offering optimized range management with automated reward harvesting on SuperChain DEXs.
Integration with Aerodrome/Velodrome on Base and Optimism
Curator marketplace with professional risk management
Automated reward harvesting and compounding
Audited by ChainSecurity and BlockSec
Consider If: Less focused on pure CLM compared to dedicated platforms; best for users seeking broader DeFi yield strategies including staking and lending.
Fees Notes: Varies by curator and vault; typically 10-20% performance fees
☑ Performance Metrics — Review historical APRs accounting for impermanent loss
☑ Composability Needs — If using LP tokens elsewhere, verify ERC-20 support vs. NFTs
Red Flags:
🚩 No audits or anonymous teams without established track record
🚩 Unclear fee structures or hidden withdrawal penalties
🚩 Very high performance fees (>20%) without justified value-add
🚩 Limited chain support if you need multi-chain exposure
Use Token Metrics With Any Concentrated Liquidity Manager
Token Metrics complements your concentrated liquidity strategy by providing:
AI Ratings — Screen tokens for quality and momentum before selecting trading pairs for liquidity provision
Narrative Detection — Identify emerging DeFi themes early to position liquidity in high-growth sectors
Portfolio Optimization — Balance concentrated liquidity positions across chains and risk profiles
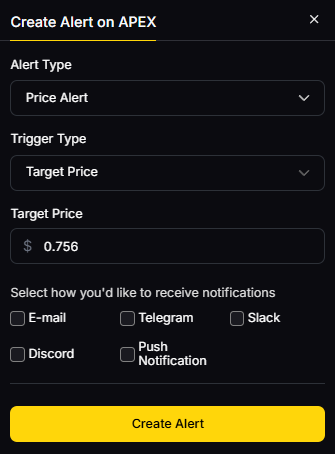
Alerts & Signals — Time liquidity entries and exits based on technical and on-chain indicators
Workflow Example:
Research → Use Token Metrics AI to identify high-quality token pairs
Select CLM → Choose appropriate concentrated liquidity manager based on chain and strategy
Deploy → Provide liquidity through automated vault or custom range
Monitor → Track performance with Token Metrics alerts for rebalancing or exit signals
Start free trial to screen assets and optimize your concentrated liquidity strategy with AI-powered insights.
Security & Compliance Tips
Protect Your Concentrated Liquidity Positions:
Verify Contract Addresses — Always confirm official contract addresses on protocol documentation before depositing; bookmark official sites
Check Audit Reports — Review smart contract audits from firms like Consensys, ChainSecurity, Hydn, or BlockSec before using new platforms
Start Small — Test new CLM platforms with modest capital before committing significant liquidity
Monitor Phishing — Be wary of fake CLM interfaces; never share seed phrases or sign suspicious transactions
Understand Permissions — Review what approvals you're granting; consider using revoke.cash to audit token approvals
Track IL Exposure — Concentrated liquidity amplifies impermanent loss; monitor positions regularly and understand divergence loss implications
Diversify CLM Providers — Don't concentrate all liquidity with a single manager; spread risk across multiple audited platforms
Check Rebalancing Limits — Understand if CLMs have daily rebalancing limits or gas thresholds that might delay adjustments
Verify Withdrawal Process — Test small withdrawals to ensure liquidity is accessible and fees match expectations
Stay Informed — Follow CLM protocol announcements for security updates, parameter changes, or migration requirements
This article is for research and educational purposes only, not financial advice. Always conduct your own due diligence and consider consulting with financial advisors before providing liquidity.
Beginner Mistakes to Avoid
Ignoring Impermanent Loss — CLMs optimize fee generation but cannot eliminate IL; highly volatile pairs will still result in divergence loss
Chasing High APRs Without Context — Displayed APRs often exclude impermanent loss and may reflect short-term incentives, not sustainable yields
Not Understanding Fee Structures — Performance fees compound over time; a 15% fee on yields can significantly impact long-term returns
Depositing Without Strategy Alignment — Narrow ranges earn higher fees but require more active management; ensure strategy matches your risk tolerance
Overlooking Gas Costs — Rebalancing and compounding operations cost gas; on Ethereum mainnet, frequent rebalancing may erode returns for small positions
Assuming "Set and Forget" — While automated, CLM positions require periodic review; market regime changes may necessitate strategy adjustments
Not Tracking Net Performance — Always calculate returns vs. simply holding tokens; CLM fees + IL may underperform holding in ranging markets
Concentrating in Illiquid Pairs — Low-volume pairs may have insufficient fee generation to cover management costs and rebalancing slippage
FAQs
What is a concentrated liquidity manager?
A concentrated liquidity manager (CLM) is a DeFi protocol that automates the management of concentrated liquidity positions on AMMs like Uniswap v3. CLMs handle range selection, rebalancing, fee compounding, and position optimization, converting active liquidity provision into a passive strategy. They typically provide ERC-20 LP tokens representing managed positions, making them composable across DeFi.
Are concentrated liquidity managers safe?
Security varies by platform. Established CLMs like Gamma Strategies, Arrakis, and Steer have multiple audits and years of operational history without major exploits. However, smart contract risk always exists; never deposit more than you can afford to lose, and prioritize audited platforms with proven track records. Review audit reports and monitor protocol security updates.
What fees do concentrated liquidity managers charge?
Most CLMs charge performance fees ranging from 5-15% of generated yields. Some add harvest fees (like Beefy's 9.5%), automation fees (Revert's 0.25% per operation), or swap fees for rebalancing. Always review the specific fee structure before depositing, as fees compound over time and can significantly impact net returns.
Which chains support concentrated liquidity managers?
Major CLMs support Ethereum, Polygon, Arbitrum, Optimism, and Base. Gamma Strategies leads with 20+ chains including BSC, Avalanche, Fantom, and newer L2s. Steer Protocol supports 17+ chains with 90%+ CLAMM coverage. Always verify your target chain is supported before selecting a CLM platform.
Can I use concentrated liquidity managers on mobile?
Most CLMs offer web interfaces compatible with mobile wallets like MetaMask Mobile, Coinbase Wallet, or WalletConnect. However, complex features like strategy backtesting (Revert) or custom position building may be better suited for desktop. Core functions like depositing, withdrawing, and monitoring positions work well on mobile.
Do CLMs work with Uniswap v4?
Yes. Gamma Strategies, Bunni, and A51 Finance support Uniswap v4, which launched in January 2025. Bunni is the leading v4 hook implementation, offering advanced features like Liquidity Density Functions. Arrakis is also developing v4 modules. Expect more CLMs to add v4 support as the protocol matures.
How do CLMs handle impermanent loss?
CLMs cannot eliminate impermanent loss—they optimize range management to maximize fee generation that can offset IL. Some platforms (Bunni, ICHI) offer specific strategies to mitigate IL through MEV protection or single-sided deposits, but divergence loss remains inherent to providing liquidity in volatile pairs.
What's the difference between CLMs and regular yield optimizers?
Regular yield optimizers (like Beefy for Uniswap v2) auto-compound rewards from liquidity mining programs. CLMs specifically manage concentrated liquidity positions, handling range selection and rebalancing. Some platforms (Beefy CLM) combine both, offering concentrated liquidity management integrated with yield optimization.
Conclusion + Related Reads
Concentrated liquidity managers have matured into essential DeFi infrastructure, transforming active LP strategies into accessible passive income opportunities. For multi-chain diversification and proven track record, Gamma Strategies remains the industry standard. Token launch teams and protocols requiring institutional-grade management should consider Arrakis Finance, while those seeking cutting-edge Uniswap v4 features can explore Bunni. LPs prioritizing single-sided deposits will find ICHI most suitable, and analytics-focused investors should evaluate Revert Finance.
Remember that no CLM eliminates impermanent loss—they optimize for fee generation and capital efficiency. Always verify fee structures, audit status, and supported chains before deploying capital. Start with smaller positions to understand platform mechanics and performance before scaling up.
Who this guide is for. Token teams, exchanges, funds, and DAOs comparing liquidity management and market-making tools to tighten spreads, balance inventories, and support healthy markets.
Top three picks.
Flowdesk — compliance-first platform + MMaaS across 140+ venues. (flowdesk.co)
Wintermute — leading algorithmic liquidity partner across CeFi/DeFi. (wintermute.com)
One key caveat. Fees and engagement models vary widely (retainer, inventory loan/call, performance); confirm scope, reporting, and legal terms before signing. (flowdesk.co)
Introduction: Why Crypto Liquidity Management & Market-Making Tools Matter in November 2025
In crypto, liquidity management and market-making tools keep order books tight, reduce slippage, and stabilize price discovery across centralized and decentralized venues. The primary keyword here is liquidity management and market-making tools, and the right stack blends execution algorithms, risk controls, analytics, and clear reporting so projects can support listings and users can trade efficiently.
In 2025, onchain liquidity is increasingly concentrated and active on AMMs while institutions expect 24/7 coverage and API connectivity across spot, perps, and options. Mature providers now offer compliance-forward processes, automated vaults for concentrated liquidity, and multi-venue execution with transparent documentation. This guide ranks ten credible options, explains trade-offs (costs, custody, venues), and gives you a practical checklist to choose confidently.
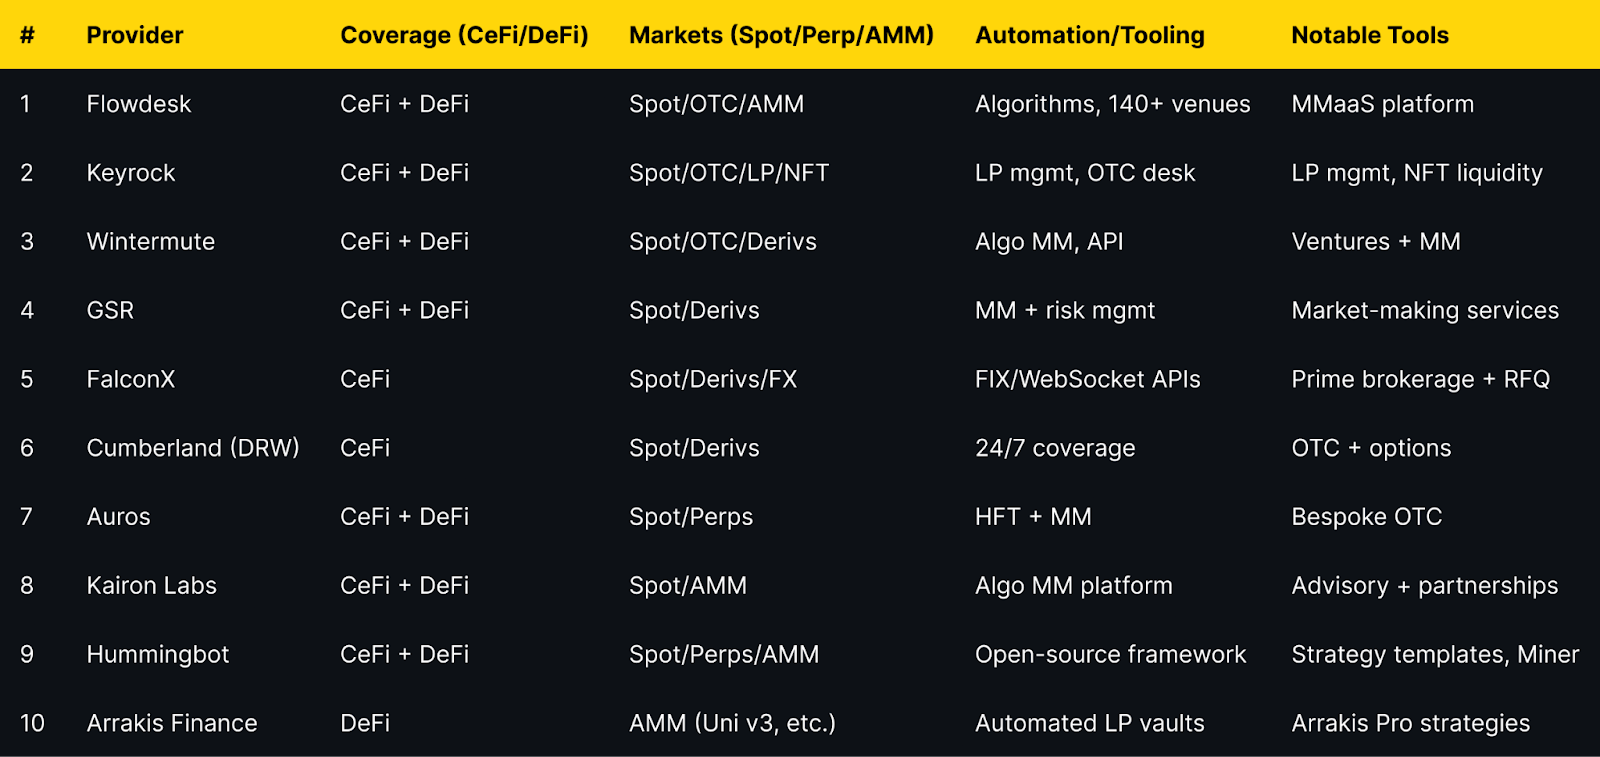
Best Crypto Liquidity Management & Market-Making Tools in November 2025 (Comparison Table)
Evidence for venue coverage and capabilities appears in provider sections below.
Top 10 Crypto Liquidity Management & Market-Making Tools in November 2025
1. Flowdesk — Best for compliance-first MMaaS at global scale
Why Use It. Flowdesk runs a compliance-first market-making and OTC platform with proprietary execution algos and integrations across 140+ centralized and decentralized exchanges, suitable for token issuers that need unified coverage and reporting. (flowdesk.co) Best For. Token issuers; exchanges; DAOs with multi-venue liquidity needs; teams prioritizing compliance. Notable Features. Low-latency infrastructure; MMaaS with 24/7 teams; 140+ venue connectivity; internal policies & compliance center. (flowdesk.co) Consider If. You want documented models (retainer vs loan/call) and clear KPIs before engagement. (flowdesk.co) Fees Notes. Custom; contract-based; network/exchange fees apply. Regions. Global; subject to local licensing and restrictions (France DASP registration referenced on site). (flowdesk.co) Alternatives. Keyrock; GSR.
2. Keyrock — Best for full-stack liquidity (MM, OTC, LP, NFTs)
Why Use It. Keyrock delivers market making, OTC trading, treasury solutions, and liquidity pool management for token issuers and venues; it also offers NFT liquidity and publishes security awareness and terms. (Keyrock) Best For. Issuers needing both CeFi and DeFi coverage; platforms adding NFT or LP liquidity. Notable Features. Liquidity pool management; OTC/options; NFT liquidity; research/insights. (Keyrock) Consider If. You want a single counterparty handling MM + LP mgmt with documented terms. (Keyrock) Fees Notes. Custom; scope-based; network/exchange fees may apply. Regions. Global; services subject to applicable laws and platform eligibility. Alternatives. Flowdesk; Wintermute.
3. Wintermute — Best for algorithmic crypto liquidity at scale
Why Use It. Wintermute is a leading algorithmic trading firm and liquidity partner that supports efficient markets across centralized and decentralized venues, with a broader ventures arm for strategic projects. (wintermute.com) Best For. Larger token issuers and institutions that want deep, programmatic liquidity and breadth of venues. Notable Features. Algorithmic MM; OTC; venture support; expanding US presence. (fnlondon.com) Consider If. You need institutional processes and policy engagement in the US market. (fnlondon.com) Fees Notes. Custom; inventory/retainer structures typical. Regions. Global. Alternatives. GSR; FalconX.
4. GSR — Best for crypto liquidity + risk management depth
Why Use It. GSR offers market-making and risk management across spot and derivatives, working with exchanges, token issuers, and institutions; it publishes regular research and insights. (gsr.io) Best For. Issuers seeking experienced MM with derivatives coverage and institutional process. Notable Features. Trading + market making services; exchange connectivity; research hub. (gsr.io) Consider If. You need structured reporting and risk frameworks across venues. Fees Notes. Custom; scope-based; exchange/network fees apply. Regions. Global. Alternatives. Wintermute; Flowdesk.
5. FalconX — Best prime brokerage + deep crypto liquidity access
Why Use It. FalconX is a prime broker with $2T+ executed and access to 400+ tokens, offering unified spot/derivs/FX execution, OTC, and APIs (WebSocket/FIX/REST). (falconx.io) Best For. Institutions wanting a single counterparty with RFQ, streaming, and FIX integration. Notable Features. Deep liquidity pool; algorithmic/TWAP tools; ETF issuer liquidity support; Talos integrations. (falconx.io) Consider If. You want prime services plus execution algos rather than a pure MM retainer. Fees Notes. Custom; execution- and volume-based; venue/network fees apply. Regions. Global (token availability may vary). (falconx.io) Alternatives. Cumberland; GSR.
Why Use It. A DRW subsidiary active since 2014 in digital assets, Cumberland provides 24/7 institutional liquidity across spot, listed derivatives, bilateral options, and NDFs, with relationship coverage. (cumberland.io) Best For. Institutions needing OTC block liquidity and derivatives structures. Notable Features. OTC/RFQ; BTC/ETH options; futures basis; DRW backing. (cumberland.io) Consider If. You need large, bespoke trades and derivatives hedging under institutional processes. Fees Notes. Custom; RFQ spreads/commissions; venue/network fees apply. Regions. Global, subject to applicable regulations. Alternatives. FalconX; Wintermute.
7. Auros — Best for HFT-driven market-making with bespoke design
Why Use It. Auros combines high-frequency trading and strategic market making across CeFi and DeFi with bespoke OTC and transparency-oriented reporting for token stability. (Auros) Best For. Projects seeking a partner for token launch support and stability across venues. Notable Features. HFT + MM stack; CeFi/DeFi coverage; insights & reporting. (Auros) Consider If. You want tailored strategies and comms during volatility. Fees Notes. Custom; scope-based; network/venue fees apply. Regions. Global. Alternatives. Kairon Labs; GSR.
8. Kairon Labs — Best issuer-focused market-making + advisory
Why Use It. Kairon Labs provides algorithmic market making, liquidity provision, partnerships, and advisory for issuers, with educational content on MM models (designated vs principal). (kaironlabs.com) Best For. Small–mid cap issuers needing hands-on guidance plus execution. Notable Features. Issuer-centric services; partnerships support; model education. (kaironlabs.com) Consider If. You want advisory plus MM under one roof. Fees Notes. Custom; scope-based; exchange/network fees apply. Regions. Global. Alternatives. Auros; Flowdesk.
9. Hummingbot — Best open-source framework for DIY market making
Why Use It. Hummingbot is an open-source Python framework to run automated strategies on any CEX/DEX, with built-in templates for pure market making and perpetual MM and extensive docs. (hummingbot.org) Best For. Developers, quant hobbyists, and small desks wanting DIY automation. Notable Features. Strategy library; Docker/API quickstarts; Miner rewards marketplace. (hummingbot.org) Consider If. You accept self-hosting and operational overhead instead of a service contract. Fees Notes. Software is free; trading/withdrawal/network fees still apply. Regions. Global (open-source). Alternatives. Arrakis (for LP vaults); Keyrock (for managed LP).
10. Arrakis Finance — Best for automated onchain LP management (Uni v3 & more)
Why Use It. Arrakis provides automated LP vaults and Arrakis Pro strategies for token issuers to manage concentrated liquidity with rebalancing and inventory targeting. (arrakis.finance) Best For. Projects prioritizing DeFi AMM depth and capital efficiency on Uniswap v3-style DEXs. Notable Features. Ongoing inventory management; automated rebalancing; issuer-specific vault programs. (arrakis.finance) Consider If. You need onchain, non-custodial liquidity programs over CeFi MM retainers. Fees Notes. Protocol/vault fees; gas costs on supported chains. Regions. Global (onchain). Alternatives. Hummingbot (DIY); GSR (CeFi/MM).
Costs — 15% (fee clarity, model fit, onchain costs)
UX — 10% (integration, tooling, reporting)
Support — 5% (24/7 coverage, responsiveness)
Data sources: official product, docs, pricing/terms, security/policies, and status pages; reputable market datasets used only to cross-check scale and venues. Last updated November 2025.
FAQs
What are liquidity management and market-making tools? Software platforms and service providers that supply bids/asks, balance inventory, and manage onchain liquidity so markets remain liquid with tighter spreads and lower slippage (CeFi and DeFi).
Are managed market makers or DIY bots safer? Managed providers handle execution, risk, and reporting under contracts; DIY bots like Hummingbot provide control but require operational expertise and monitoring. Choose based on team capacity and risk tolerance. (hummingbot.org)
How do providers charge? Common models include retainers, inventory loan/call structures, execution fees/spreads, and protocol/vault fees on DeFi. Clarify model, caps, and KPI targets before engagement. (flowdesk.co)
Can I combine CeFi MM with DeFi vaults? Yes. Many issuers use a CeFi MM for order books plus an onchain LP manager (e.g., Arrakis) for AMM depth, with shared reporting and risk limits. (arrakis.finance)
Do these tools work in the US/EU/APAC? Most providers are global but subject to local regulations, listings, and counterparty restrictions. Check each provider’s terms/compliance pages and confirm venue eligibility. (flowdesk.co)
Conclusion + Related Reads
If you want compliance-centric, multi-venue coverage, start with Flowdesk or Keyrock. For institutional scale, add Wintermute or GSR. If you need prime services and execution, consider FalconX or Cumberland. For DIY or onchain-first, evaluate Hummingbot and Arrakis.
One key caveat. Availability varies by jurisdiction (many CEX launchpads restrict U.S. users and require KYC). Always check your platform’s official eligibility and KYC pages. (Binance)
Introduction: Why Crypto Launchpads & IDO/IEO Platforms Matter in November 2025
Definition (snippet-ready): A crypto launchpad is a platform that hosts early token distribution events (IDO/IEO) with defined participation rules, allocations, and settlement.
In 2025, primary-market access has consolidated around large exchanges and a handful of battle-tested decentralized platforms. For investors, best crypto launchpads 2025 decisions hinge on liquidity, security/compliance, costs, and eligibility. Centralized exchange (CEX) launchpads (e.g., Binance, OKX, Bybit) emphasize KYC and region filters, while decentralized launchpads (e.g., Polkastarter, DAO Maker) lean on wallet-based participation and project curation. We scored providers using transparent weights, verified details only from official pages, and noted regional restrictions where platforms disclose them. Freshness: Updated November 2025.
How We Picked (Methodology & Scoring)
We shortlisted ~20 credible platforms, then selected TOP_N = 10 based on official evidence (docs/help/pricing/status/security pages). Third-party data was used only for cross-checks, not cited.
Support — 5% (help center clarity, announcements cadence)
Data sources: Official product, help, terms, and announcement pages; platform status/audit pages where available. Last updated: November 2025.
Best Crypto Launchpads & IDO/IEO Platforms in November 2025 (Comparison Table)
* Always confirm current eligibility on the platform’s official Terms/Help pages before participating. ** Some decentralized pools may require external KYC/allowlists set by the project.
Top 10 Crypto Launchpads & IDO/IEO Platforms in November 2025
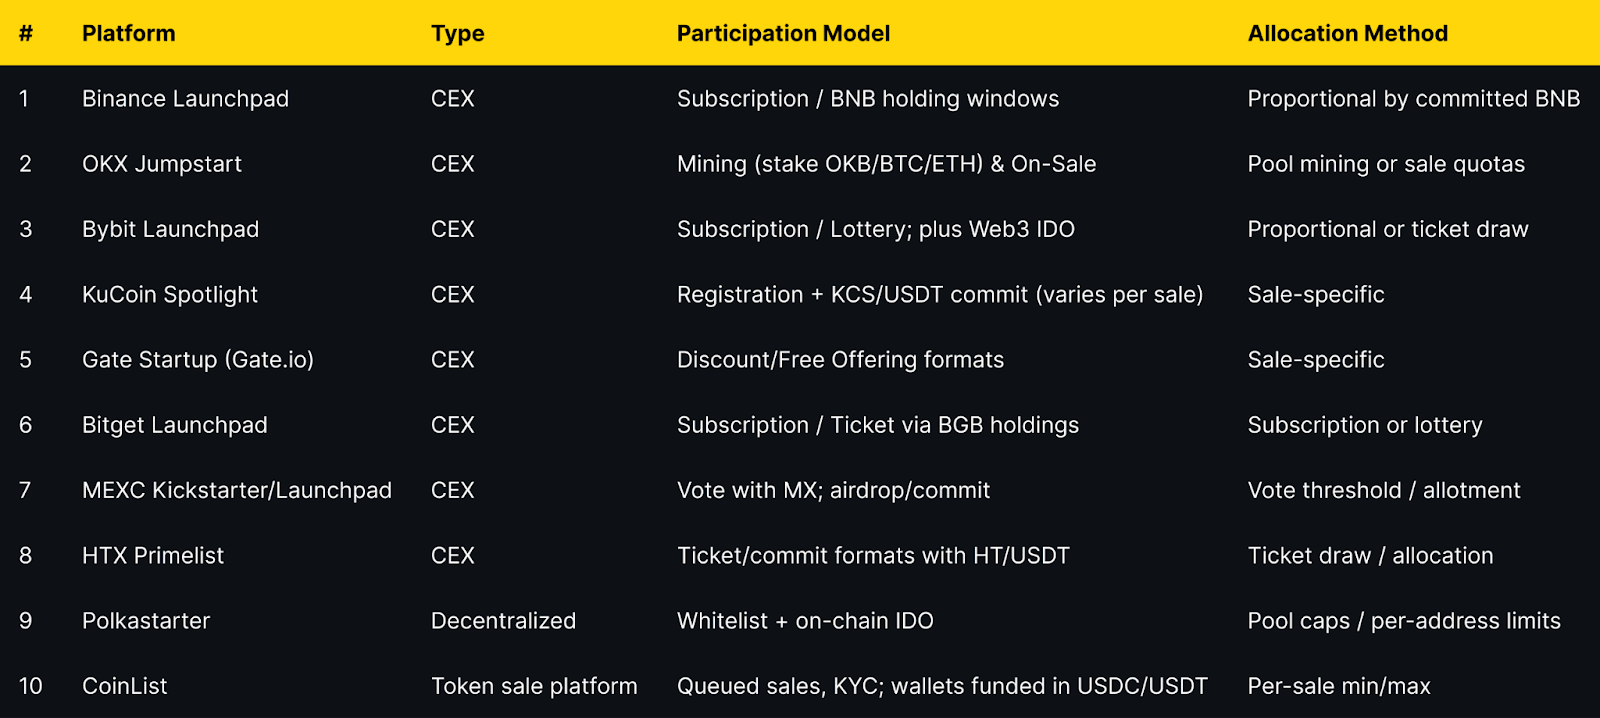
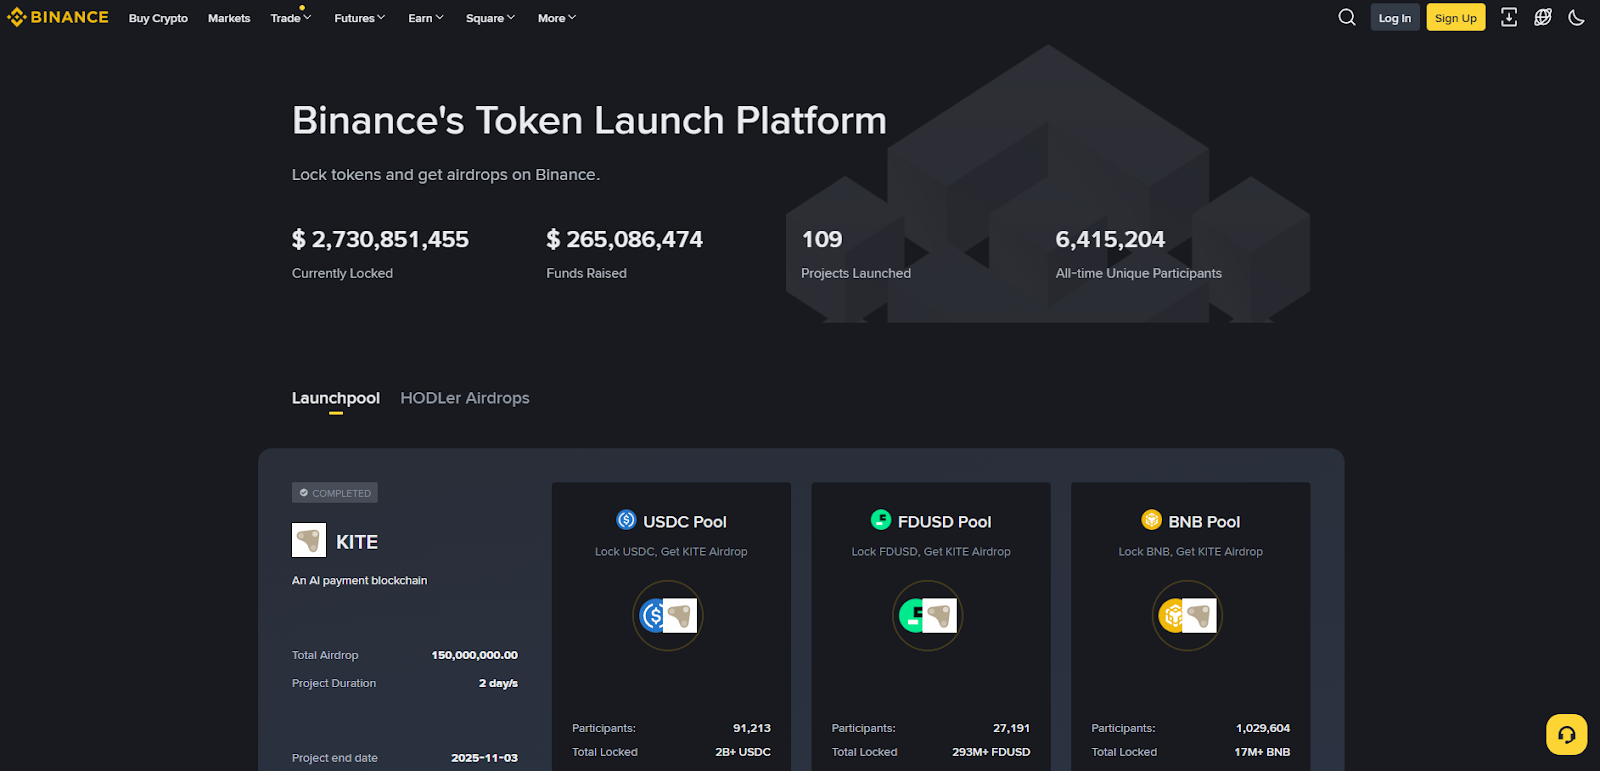
Why Use It. Binance Launchpad runs subscription-style sales that typically require BNB holdings across a snapshot window, then proportional allocation by committed BNB. The process is well documented and integrated with Binance listings, giving post-sale liquidity depth. (Binance Launchpad | Binance) Best For. Allocation hunters, liquidity-first traders, portfolio builders seeking large-venue listings. Notable Features. Subscription model; BNB commitment windows; integrated post-listing ecosystem; robust help center. (Binance) Consider If. Not available in prohibited jurisdictions; KYC required. (Binance) Fees Notes. Varies; trading/network fees apply. Regions. Global, with restricted countries noted in Terms. (Binance) Alternatives. OKX Jumpstart, Bybit Launchpad.
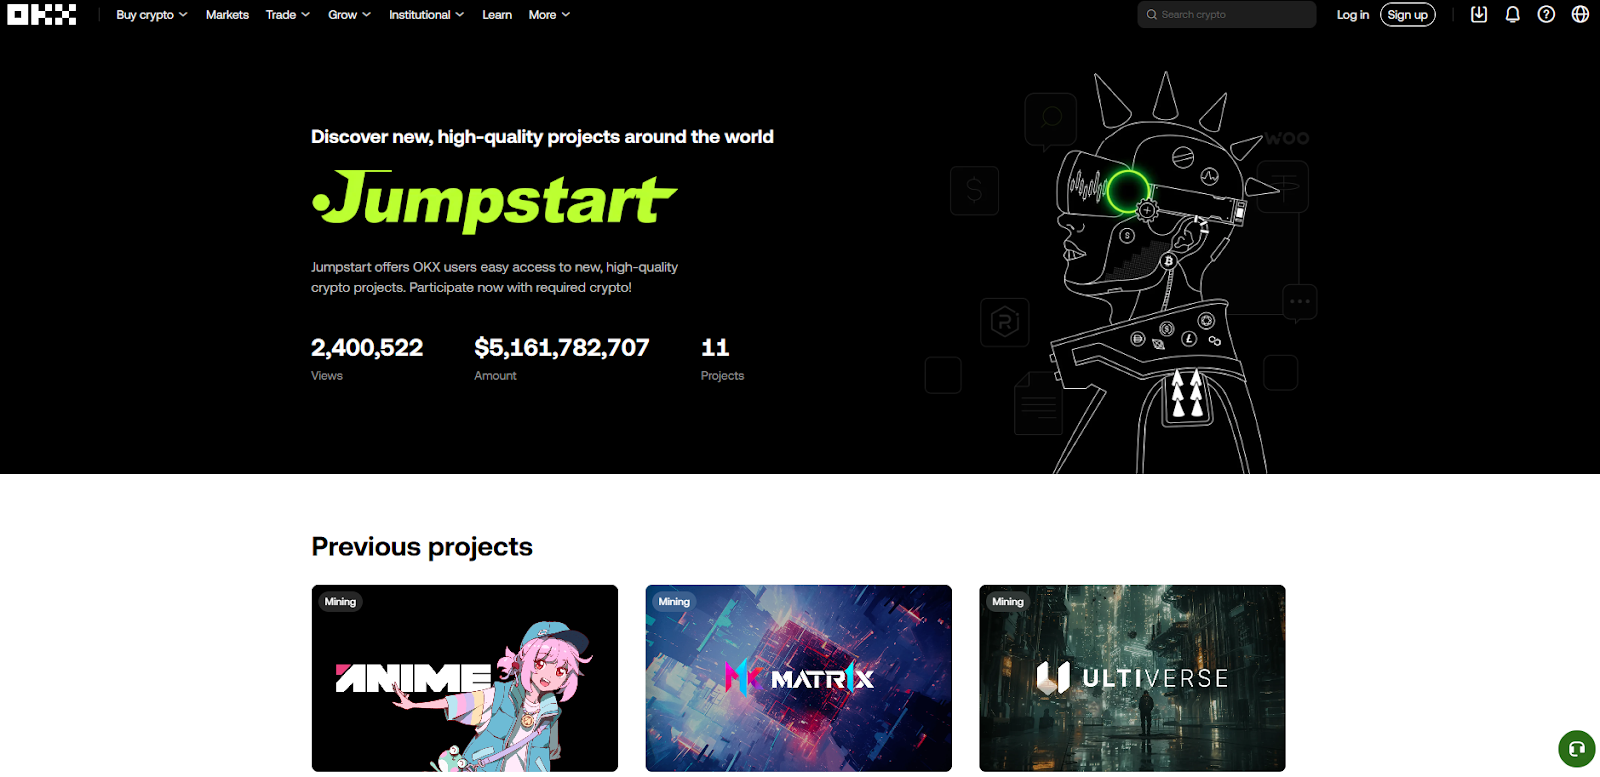
2. OKX Jumpstart — Best for simple mining + sale formats
Why Use It. Jumpstart offers Mining events where users stake assets (e.g., OKB, BTC, ETH) to earn new tokens, alongside occasional On-Sale formats. Participation rules are clearly posted per event. (OKX) Best For. Long-only users holding OKB/BTC/ETH, set-and-forget miners, diversified hunters of frequent drops. Notable Features. Mining & sale dual formats; event pages with tokenomics; frequent announcements. (OKX) Consider If. Jurisdiction limits apply; verify your eligibility. (OKX) Fees Notes. Varies; network fees apply. Regions. Global with restrictions per OKX policies. Alternatives. Binance Launchpad, Gate Startup.
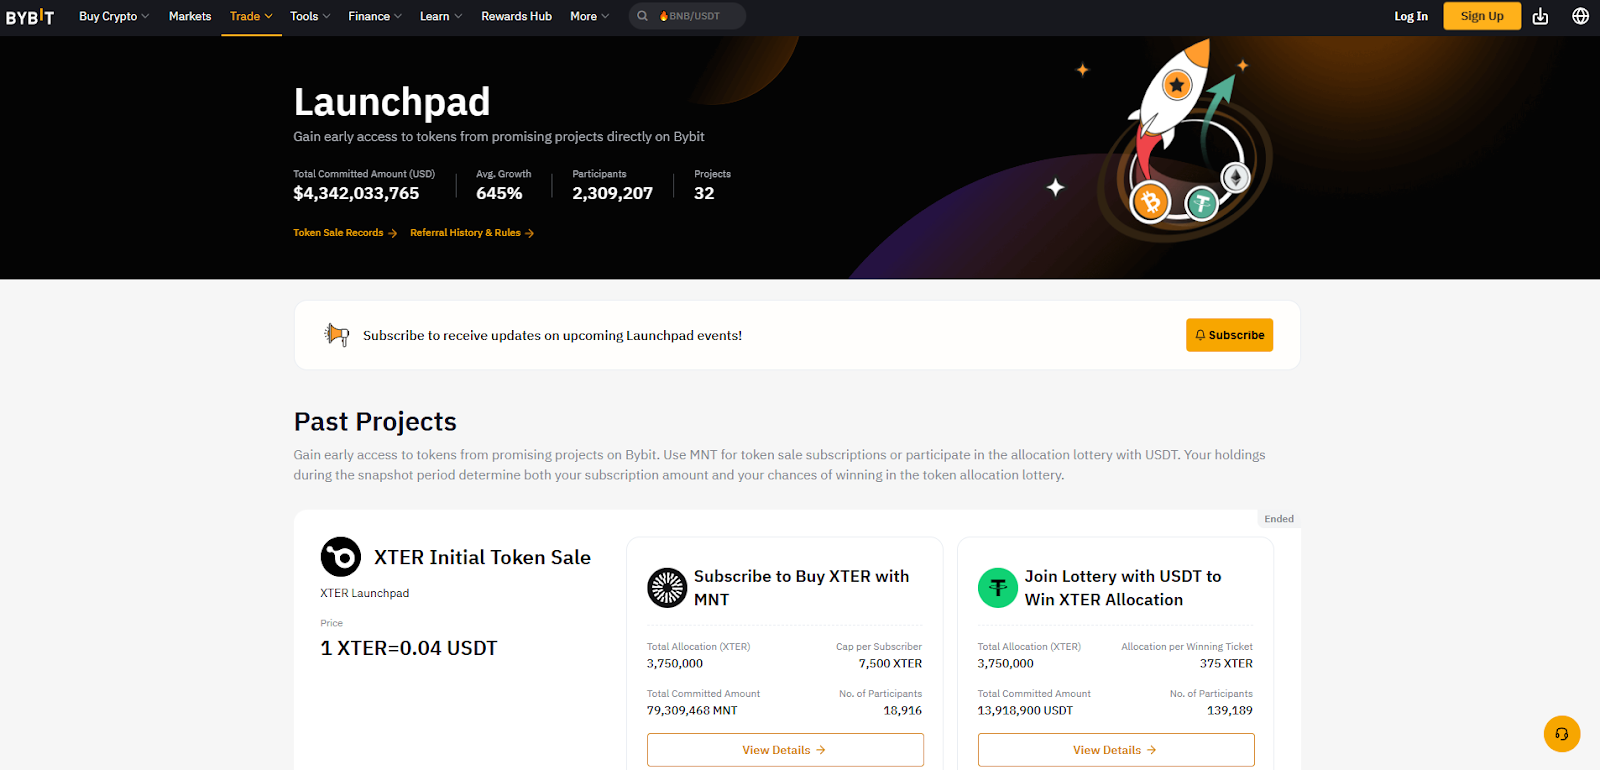
Why Use It. Bybit runs subscription/lottery sales on the exchange and also operates a Web3 IDO platform for wallet-based participation. Clear KYC tiers and frequent help-center updates support new users. (bybit.com) Best For. Users who want both exchange launchpad and Web3 IDO in one brand, ticket/lottery mechanics. Notable Features. Subscription and lottery formats; Web3 IDO portal; detailed KYC guidance. (bybit.com) Consider If. Not available in excluded jurisdictions (e.g., U.S.). (bybit.com) Fees Notes. Varies; network fees apply. Regions. Global (excluded jurisdictions listed by Bybit). (bybit.com) Alternatives. Binance Launchpad, Bitget Launchpad.
4. KuCoin Spotlight — Best for altcoin discovery on a major exchange
Why Use It. Spotlight aggregates new listings and has hosted high-profile events. Participation generally requires KYC and following sale-specific rules posted in help/announcement pages. (KuCoin) Best For. Altcoin-oriented users who want curated sales and subsequent exchange liquidity. Notable Features. Dedicated Spotlight center; sale how-to guides; history of ended sales. (KuCoin) Consider If. U.S. users are restricted per KuCoin Terms. (KuCoin) Fees Notes. Varies; network fees apply. Regions. Global (U.S. and other locations restricted). (KuCoin) Alternatives. Gate Startup, MEXC Kickstarter.
Why Use It. Gate’s Startup page offers discount and free-offering formats, with active cadence and explicit instructions in announcements and help articles. KYC is required for participation. (Gate.com) Best For. Deal hunters, high-frequency participants, multi-format collectors. Notable Features. Discount and free-offering modes; constant announcements; centralized hub. (Gate.com) Consider If. Make sure you’ve completed Gate KYC before events. (Gate.com) Fees Notes. Varies; network fees apply. Regions. Global (subject to KYC and eligibility). Alternatives. OKX Jumpstart, MEXC Kickstarter.
6. Bitget Launchpad — Best for BGB-based subscription or ticket access
Why Use It. Bitget runs subscription and ticket models, often tied to BGB holdings/trading activity. Official FAQ and blog posts detail eligibility and formats. (bitget.com) Best For. Users already in the Bitget ecosystem; lottery-style allocation seekers. Notable Features. BGB-linked ticketing; subscription flows; event records page. (bitget.com) Consider If. Region limits apply and formats can vary by event. Fees Notes. Varies; network fees apply. Regions. Global with restrictions. Alternatives. Bybit Launchpad, HTX Primelist.
Why Use It.Kickstarter lets MX holders vote to support pre-launch projects and receive airdrops when thresholds are met; official FAQs outline steps and eligibility. (MEXC) Best For. Airdrop hunters, MX token holders, event-driven users. Notable Features. Vote-to-airdrop; quick-commit across events; MX minimums. (MEXC) Consider If. Rewards, formats, and eligibility can change per event—read each page. Fees Notes. Varies; network fees apply. Regions. Global with restrictions. Alternatives. Gate Startup, Bitget Launchpad.
8. HTX Primelist — Best for ticket/commit sale mechanics
Why Use It. Primelist runs ticket/commit structures where users may lock HT/USDT or complete tasks to obtain tickets; official announcements describe cadence and rules. (htx.com) Best For. Users comfortable with ticket allocations and exchange-based listings. Notable Features. Ticket draws; commitment options; frequent listing promos. (htx.com) Consider If. Check jurisdiction limits and sale-specific rules each time. Fees Notes. Varies; network fees apply. Regions. Global with restrictions. Alternatives. Bitget Launchpad, Bybit Launchpad.
9. Polkastarter — Best decentralized IDO for whitelists and on-chain caps
Why Use It. Polkastarter hosts curated on-chain IDOs with per-address caps and allowlists, giving transparent pool limits and wallet-based participation. Project pages and a launch portal outline the process. (polkastarter.com) Best For. Users preferring self-custody, on-chain settlement, and project allowlists. Notable Features. On-chain pools; whitelist workflows; project directories. (polkastarter.com) Consider If. Some projects impose geofences/KYC—always read pool terms. Fees Notes. Network gas; project-level terms. Regions. Global; project-dependent restrictions may apply. Alternatives. DAO Maker, CoinList.
10. CoinList — Best for fully KYC’d token sales and wallet funding
Why Use It. CoinList runs queued token sales with per-sale minimums/maximums and strict KYC. Help articles detail wallet funding in USDC/USDT and purchase flows. (CoinList) Best For. Users who prefer structured, compliance-forward public sales with clear limits. Notable Features. Queue systems; per-sale caps; explicit instructions; wallet funding guides. (CoinList) Consider If. Eligibility varies by sale; expect KYC and sometimes region-specific exclusions. Fees Notes. Stated per sale; network fees apply. Regions. Global (U.S. participation depends on each sale’s terms). Alternatives. Polkastarter, Binance Launchpad.
Using the wrong wallet type for Web3 IDO vs. CEX subscription. (bybit.com)
Overlooking vesting/claim deadlines and token distribution mechanics. (OKX)
Falling for unofficial links or phishing around high-demand sales.
Committing more than you can afford under volatile market conditions.
How We Picked (Methodology & Scoring)
We evaluated ~20 providers (including Seedify, TrustPad, BSCPad, PinkSale, BullPerks, Enjinstarter, Poolz, WeStarter, GameFi, ApeTerminal, and Republic Crypto) for liquidity (30), security (25), coverage (15), costs (15), UX (10), support (5) using only official pages for claims. We excluded defunct/region-ineligible platforms for Global readers or those lacking current official documentation. Last updated November 2025.
FAQs
What is a crypto launchpad? A platform that hosts early token distributions (IDO/IEO) with rules for eligibility, allocation, and settlement, either on an exchange or on-chain.
Are launchpads safe? Safety depends on the platform and the project. Prefer venues with clear KYC/eligibility, transparent rules, and official documentation, and use strong account security. (Binance)
What fees should I expect? Some platforms state sale/processing terms on event pages; otherwise expect network gas and standard trading fees after listing. Always read each sale’s official page.
Can U.S. users participate? Many CEX launchpads restrict U.S. users per their Terms. Check platform eligibility before committing. (Binance)
Do I need KYC? Most CEX launchpads require KYC. Decentralized IDOs may be wallet-only but can still impose allowlists or geofences per project. (bybit.com)
How do allocation methods differ? Common approaches include proportional subscription, lottery/tickets, staking/mining, and whitelist caps for on-chain pools. (Binance)
Conclusion + Related Reads
If you want the broadest liquidity and simple participation, start with Binance Launchpad or OKX Jumpstart. For CEX + Web3 flexibility, Bybit stands out. Prefer self-custody? Explore Polkastarter and read each project’s terms carefully. Pair your launchpad activity with Token Metrics research, alerts, and portfolio tools to manage risk.


%201.svg)
%201.svg)


.svg)


%201.svg)

.png)


.svg)


.png)