Token Metrics API

How to Build Crypto Trading Dashboard Using the Token Metrics Crypto Data API on Dune

Use the Token Metrics Crypto Data API with Dune to create live trading dashboards using the best crypto API. Analyze top tokens, bullish signals, and trading alpha today.
Token Metrics Team
8 min
MIN

In today’s fast-paced crypto world, real-time data isn’t a luxury—it’s a necessity. For traders, analysts, and developers, being able to access live, actionable insights can mean the difference between profit and loss. That’s why the integration of the Token Metrics Crypto Data API with Dune is a game-changer for anyone seeking to create live dashboards backed by intelligent trading data.

In this post, we’ll walk through how to use this top crypto API to build dynamic dashboards on Dune. Whether you’re tracking bullish signals, backtesting trading strategies, or identifying top-performing tokens, this integration makes it possible—without any paid license.

Let’s dive into how you can use the best free crypto API available today to transform your trading.

What Is the Token Metrics Crypto Data API?

The Token Metrics Crypto Data API is a developer-focused gateway to powerful, AI-driven crypto data. It’s one of the top crypto APIs in 2025, giving you access to:

  • Real-time and historical trading signals
  • Proprietary trader and investor grades
  • Alpha metrics comparing trading vs. holding performance
  • Bullish and bearish token flags

This API is used by both professional quant traders and beginners seeking to automate insights. And the best part? Token Metrics provides free crypto API access to selected datasets, allowing you to create powerful dashboards without spending a dime.

Why Dune + Token Metrics API = Power Tools for Traders

Dune is a blockchain analytics platform that allows you to write SQL queries and create dashboards using on-chain and off-chain data. Now that Token Metrics datasets are available on Dune, you can combine the best of both worlds:

  • Free access to high-signal proprietary metrics
  • Real-time data visualizations via Dune’s drag-and-drop dashboard builder
  • Actionable insights based on AI-driven trading intelligence

This integration unlocks a whole new level of transparency and utility for crypto analysts, portfolio managers, and DeFi enthusiasts.

Getting Started: Accessing Token Metrics Data on Dune

To begin, create a free Dune account. Once logged in, navigate to the Token Metrics datasets. These are publicly accessible and updated regularly. You’ll find tables for:
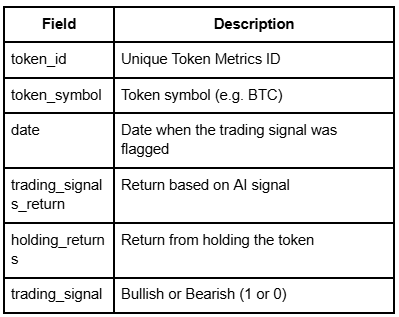
  • trading_signals
  • trader_grades
  • investors_grades
  • tokens

Start a new SQL query and choose the dataset you want to explore. Here’s what you’ll find in the trading signals table:

‍

‍

Step-by-Step: Creating an Actionable Dashboard with Token Metrics Data

1. Query the Trading Signal Returns

Write a SQL query to calculate the average return of trading vs. holding strategies. For example:

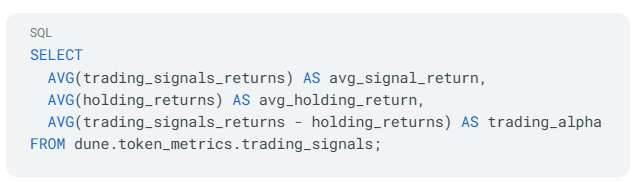
This gives you the alpha—how much better the Token Metrics strategy performs compared to just HODLing.

In one real example, the average signal return across all tokens was 1630%, while holding returned just 400%. That’s a 12X improvement powered by this top crypto API.

2. Identify Top-Performing Tokens

Now let’s list tokens with the highest average alpha:

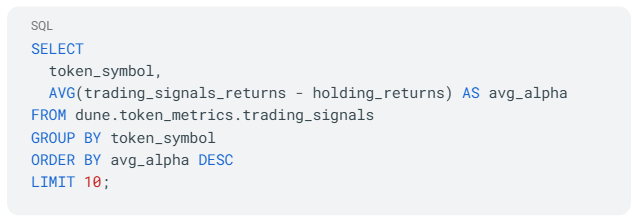
Tokens like BTC, ETH, BNB, and even newer ones like Virtuals stand out due to exceptional alpha performance.

3. Visualize Trader Grades vs. Alpha

The trader grade is a proprietary score from Token Metrics that predicts how favorable a token is for short-term traders.

Use a scatter plot to correlate trader grades with average alpha:

  • X-axis: Trader Grade
  • Y-axis: Average Alpha
  • Group by: Token Symbol

This helps you visually determine which tokens score high and offer exceptional returns—an essential tool for making actionable trading decisions.

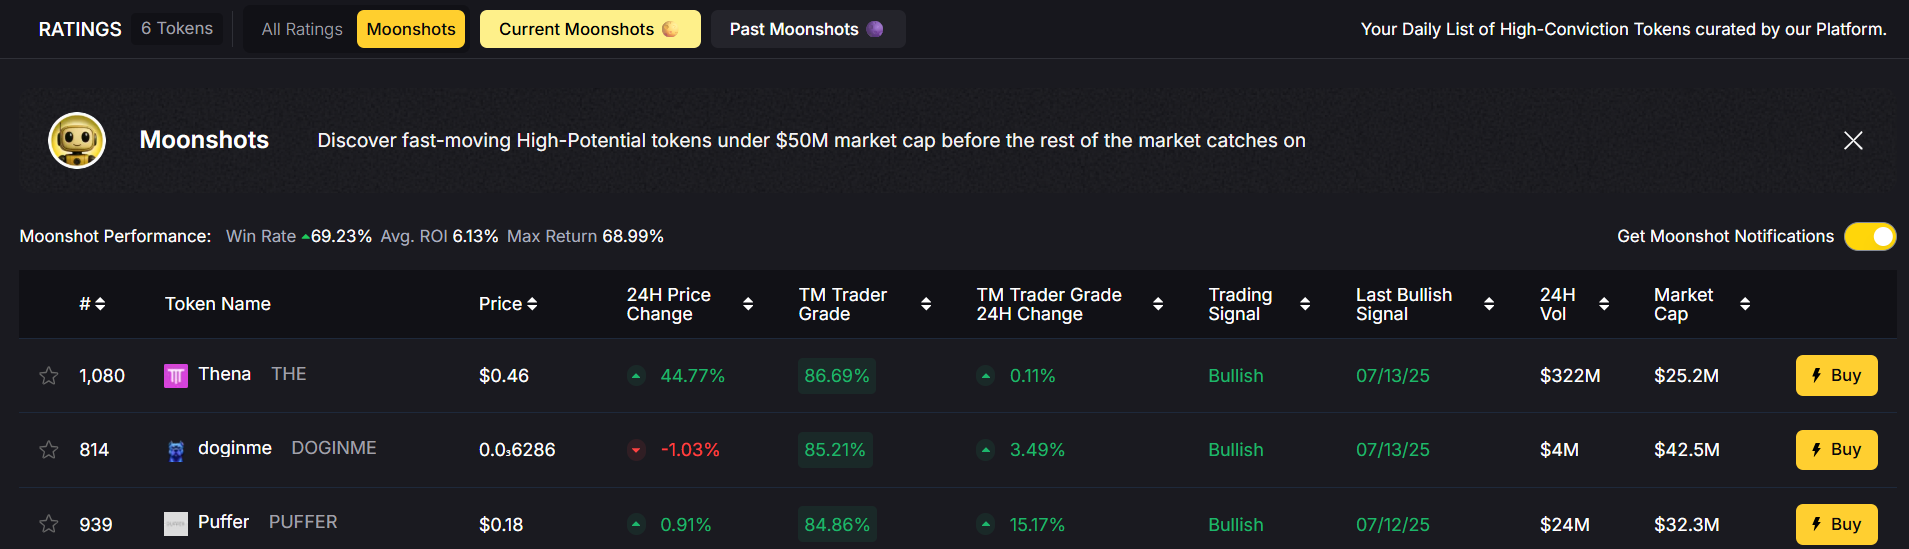
4. Track the Latest Bullish Signals

Want to know which tokens are bullish right now? Here’s a query to find the most recent tokens flagged as bullish:

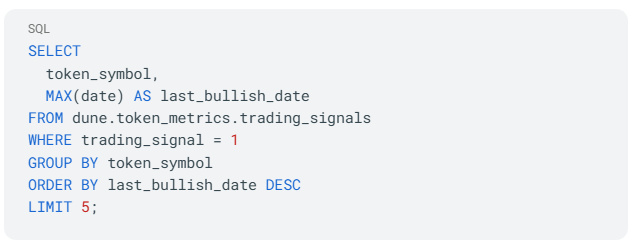
For example, on July 4th, tokens like BNB, XRP, and BTC were among the most recent bullish signals—perfect for immediate trade setups.

5. Build and Share Your Dashboard

Once you’ve run your queries:

  • Click “Add Visualization” in Dune
  • Choose from chart types (bar, scatter, progress bar, etc.)
  • Customize colors and filters
  • Combine multiple charts into a single dashboard

Your final product will be a real-time dashboard powered by the best crypto API, delivering insights that you—and your team—can act on instantly.

Why Token Metrics Is the Best Free Crypto API for Traders

Here’s why Token Metrics stands out among other APIs:

✅ AI-Driven Signals

Most APIs deliver raw data. Token Metrics provides curated signals, generated from machine learning models trained on market cycles, indicators, and price action.

✅ Proprietary Metrics

Access unique indicators like trader grade and investor grade, unavailable anywhere else.

✅ Real Historical Alpha

Use the API to backtest strategies. In the example shown, the AI strategy outperformed the market by over 1000X for some tokens.

✅ Seamless Integration

Whether you're using Dune, Zapier, OpenAI, or Eliza OS, Token Metrics is easy to integrate and query—making it the top crypto API for developers and analysts alike.

Final Thoughts

The combination of Token Metrics’ intelligent data and Dune’s visualization tools puts immense power in your hands. Whether you’re tracking market trends, building bots, or guiding portfolio decisions, this integration gives you everything you need to trade smarter.

With free access to real-time trading signals, alpha comparisons, and powerful visualizations, Token Metrics proves why it's the best crypto API for today’s data-driven investor.

Ready to try it out?
👉 Explore the Free Crypto API
👉 Start Building on Dune

Build Smarter Crypto Apps &
AI Agents in Minutes, Not Months
Real-time prices, trading signals, and on-chain insights all from one powerful API.
Grab a Free API Key
Token Metrics Team
Token Metrics Team

Recent Posts

Crypto Basics

Is Moonshot Legit? Uncovering the Truth About Token Metrics Moonshots in 2025

Token Metrics Team
8 min
MIN

In the fast-paced world of crypto, everyone’s chasing the next 100x altcoin. But with thousands of tokens launching every month—and scams lurking around every corner—it’s natural to ask: “Is Moonshot legit?”

In 2025, one platform has gained massive attention for its AI-powered ability to surface early-stage altcoins before they explode: Token Metrics Moonshots.

This article takes a deep dive into what Moonshots are, how they work, and whether they’re truly legit—or just another overhyped crypto tool.

What Is a Moonshot in Crypto?

A moonshot refers to a low-market-cap cryptocurrency with the potential to grow exponentially—sometimes delivering 10x, 50x, or even 100x returns.

Moonshots typically:

  • Are early-stage projects with high risk and high reward
  • Operate in trending sectors like AI, DePIN, Gaming, or Real World Assets
  • Have strong tokenomics or narrative appeal
  • Haven’t yet hit mainstream exchanges like Coinbase or Binance

But identifying moonshots early is hard without deep technical knowledge, insider access, or hours of research—until Token Metrics came along.

What Is Token Metrics Moonshots?

Token Metrics Moonshots is an AI-powered feature inside the Token Metrics platform that uses real-time data and advanced machine learning to surface high-potential altcoins before they pump.

Key Highlights:

  • Scans 6,000+ tokens daily
  • Evaluates each using 80+ data points: technicals, on-chain data, fundamentals, sentiment, and more
  • Surfaces a handpicked shortlist of “Moonshot” tokens each day
  • Tracks real-time ROI so you can monitor past performance transparently

Unlike meme calls on Telegram or Twitter influencers shilling bags, Moonshots are backed by structured data and AI analysis.

How to Use Token Metrics to Find Moonshots

Token Metrics makes finding potential 100x coins as easy as clicking a few buttons. Here’s the exact process:

Step 1: Go to the Ratings Page

  • Log into Token Metrics and navigate to the Ratings tab.
  • This is the engine room—where all tokens are ranked by Trader Grade and Investor Grade, using AI to spot breakout momentum.

Step 2: Click on the Moonshots Tab

  • Inside Ratings, select the Moonshots tab.
  • Instantly, you'll see a curated list of tokens flagged by AI as having exceptional upside potential.

‍

Step 3: Review Key Metrics

Each Moonshot includes:

  • Trader Grade and how much it has changed
  • 24H volume and market cap
  • Date of Moonshot entry
  • Live ROI since entry

Want to know if the algorithm works? Toggle to Past Moonshots to track actual results over 7–14 days. Many have shown 3x–9x returns in just a few days.

Step 4: Choose a Token to Explore

  • Click on any Moonshot token to open its Token Details Page.
  • Review charts, fundamentals, exchange listings, and top wallet holders.
  • AI gives you data. You make the call.

Step 5: Buy in Seconds

  • Ready to act? Click the “Buy” button directly on the Moonshots page.
  • Token Metrics opens a swap widget, letting you purchase the token instantly—without leaving the platform.

Is Moonshot Legit? Let’s Look at the Evidence

✅ Transparent Results

Token Metrics shows the live performance of every current and past Moonshot. You can verify:

  • Entry price and date
  • Current ROI
  • Performance over 7/14 days

This transparency builds trust. You’re not guessing—you’re measuring results.

✅ AI-Driven, Not Influencer-Driven

Most “100x picks” online are based on hype or paid promotions. Moonshots are based on data—real metrics like:

  • Liquidity trends
  • Momentum score
  • Exchange activity
  • Token fundamentals

That means no emotion, no bias, no hidden agendas.

✅ Real Use Cases & Track Record

In 2025, Moonshots helped users catch tokens before they were listed on major exchanges. Real examples from Q2 2025 include:

All of these were surfaced by Moonshots before they appeared in trending lists or news headlines.

✅ Built Into a Trusted Platform

Token Metrics is a well-known crypto research platform used by retail and institutional investors alike. Its tools have been featured in:

  • Forbes
  • Nasdaq
  • CoinTelegraph

The Moonshots feature is just one layer of a larger AI analytics platform that includes:

  • Trader/Investor Grades
  • Bullish/Bearish Signals
  • Prebuilt Indices
  • Custom Alerts
  • Developer API

If you’re already using Token Metrics, Moonshots is the fastest way to find early-stage altcoins backed by AI research.

Common Questions About Moonshots

❓Are all Moonshots winners?

No. Like any strategy in crypto, not every Moonshot performs. But the system is designed to identify tokens with strong probability of breakout, not guarantees.

That’s why you should:

  • Do your own research using the Token Details page
  • Spread risk across multiple picks
  • Use position sizing to manage downside

❓Can I trust AI to pick tokens?

In 2025, AI is outperforming human traders in speed, objectivity, and signal processing. Token Metrics trains its models on thousands of historical and real-time data points—delivering consistent, data-driven picks without emotional bias.

❓What plan do I need to access Moonshots?

Moonshots are available on the Advanced Plan and higher. You can start with a 7-day free trial to test it out yourself.

Final Verdict: Is Moonshot Legit?

Yes—Token Metrics Moonshots is a legit, AI-powered discovery tool for finding early-stage altcoins before they go viral.

It’s not a guaranteed win button. But it levels the playing field, giving everyday users access to tools once reserved for hedge funds and crypto insiders.

If you're tired of missing the next big altcoin pump or relying on influencer tips, Moonshots gives you back control—backed by real data.

How to Get Started

  1. Sign up for a free trial at tokenmetrics.com
  2. Go to Ratings → Moonshots
  3. Explore today’s picks and past performance
  4. Click “Buy” to act directly in the app

Set custom alerts to get notified of new Moonshots

Research

Cryptocurrency Price Predictions and Forecasts for 2025: A Deep Dive with Token Metrics AI 📈

Token Metrics Team
8 min
MIN

In mid‑2025, the crypto market is surging. Bitcoin (BTC) has blasted past $118,000, Ethereum (ETH) is over $3,000, and altcoins like XRP, ADA, and DOGE are back in focus. There’s one source powering many traders’ forecasts: Token Metrics, a leading AI‑driven crypto research and prediction platform. This extensive 1500‑word guide takes you through price forecasts, key drivers, risks, and how Token Metrics helps you stay ahead.

🌕 Why the 2025 Bull Market Is Different

Before the altcoin specifics, it’s crucial to note that many digital assets are moving in tandem with Bitcoin. Token Metrics issued a bullish signal on Bitcoin on June 28, which quickly propelled BTC past the $110,000 resistance—a breakthrough that underscores fresh institutional momentum and on‑chain supply dynamics.

đŸ”„ Bitcoin Price Prediction: $150,000–$230,000 Range

Key Drivers

  • Institutional inflows: Billions pouring into spot Bitcoin ETFs; BlackRock, Fidelity, and others now hold substantial crypto exposure.
  • Policy support: U.S. lawmakers are openly discussing Bitcoin as a reserve asset.
  • Supply squeeze: Exchange‑wallet BTC reserves fell from 3.25 million to 2.55 million.
  • Macroeconomic tailwinds: Weakening U.S. dollar, escalating trade tensions, and rising geopolitical uncertainty.
  • On‑chain momentum: Token Metrics’ data shows continued accumulation, confirmed by the bullish signal.

Risks

  • Geopolitical shocks: Israel–Iran tensions remain volatile.
  • Climate concerns: PoW energy debate resurfaces, especially with Bitcoin’s carbon footprint.
  • Regulation risk: Varying crypto frameworks globally could dampen institutional participation.

Forecast

Token Metrics predicts $150,000–$230,000 range by 2026, averaging around $190,000, based on its AI model factoring in ETF flows, macro sentiment, and supply‑side trends.

🌐 Ethereum Price Prediction: $5,000–$10,000

Key Growth Levers

  1. Pectra upgrade: Targets scalability improvements and L2 ecosystems.
  2. ETH ETF AUM: Reached $12 billion, showing institutional appetite.
  3. DeFi ecosystem strength: TVL remains high at $72.64 billion.
  4. Layer‑2 adoption: Optimism, Arbitrum, Base, and zkSync are expanding, reducing fees and increasing usage.

Risks

  • Competition: High‑performance chains like Solana are drawing developer interest.
  • Gas spikes: Usage surges may spike transaction fees, limiting adoption.
  • Regulatory clarity: Ongoing debates over securities definitions could incite volatility.

Forecast

If Bitcoin stays strong, Token Metrics forecasts ETH testing $5,000 to $10,000 by year‑end.

  • Breakout level: Above $4,000 confirms bullish cycle.
  • Support to watch: A drop below $2,500 could signal correction.

💧 XRP Price Prediction: $5–$10

Catalysts

  • SEC settlement: XRP cleared a landmark lawsuit (paid $50M), restoring regulatory confidence.
  • RLUSD stablecoin launch: Strengthens institutional appeal and liquidity.
  • High ETF odds: 90%+ probability of XRP ETF approval by 2025.
  • Global use: Ripple’s network includes 300+ institutions (e.g., Santander); Wormhole integration adds cross‑chain utility.

Risks

  • Regulatory grayness: Other regions, like EU and UK, still establish XRP rulings.
  • Stablecoin competition: USDT, USDC, and SWIFT‑like networks remain XRP competitors.

Forecast

Bullish scenario: $5–$7 before year‑end, boosting to $10 if Bitcoin remains strong and the bullish momentum holds.

  • Key breakout: Above $3.40 signals new ATH;
  • Support level: $2.10 pivotal for pullbacks.

⛓ Cardano (ADA) Price Prediction: $1.10–$1.65

Catalysts

  1. Plomin Hard Fork (Q1 2025): Boosted on‑chain governance and network evolution.
  2. DeFi TVL: Up 21% since April due to growth in Minswap, Indigo, Liqwid.
  3. Stablecoin integration: RLUSD project could pave the way for more stablecoin‑based protocols on ADA.
  4. Institutional inflows: ~$73M flowed into ADA YTD.
  5. ETF potential: Analysts give ADA a 75% chance of ETF approval.

Risks

  • Low network activity: Only ~30,000 daily users vs high user chains.
  • Steep competition: Ethereum and Solana dominate developers and liquidity.

Forecast

If ADA breaks $0.80, Token Metrics predicts $1.10–$1.65 by year‑end. Key zones:

  • Breakout: $0.80
  • Support: $0.62–$0.50

🐕 Dogecoin (DOGE) Price Prediction: $0.55–$1.25

Catalysts

  1. $0.20 resistance test: Strong on‑chain technical pattern, including golden cross.
  2. Merchant adoption: DOGE accepted by Tesla (Musk’s online store), SpaceX merch, and others via the America Party.
  3. Elon Musk tweets: His social momentum drives new cycles.
  4. ETF speculation: Analysts foresee a 65%+ chance of a DOGE ETF in 2025.
  5. Whale builds: Major accumulation since March, exchange reserves declining.

Risks

  • Infinite supply: Annual inflation compresses long‑term value.
  • Meme volatility: Highly sentiment‑driven and prone to sharp crashes, especially if Bitcoin corrects.

Forecast

  • Conservative: $0.55
  • Moderate: $1.07
  • Bullish if ETF buzz peaks: $1.25, especially if Bitcoin holds $150K.
  • Critical support: $0.15
  • Sell‑off trigger: Failure at $0.20.

🧠 The Token Metrics AI Advantage

With predictions like this, it’s essential to choose a research tool that delivers accuracy, objectivity, and automation. Token Metrics ticks every box:

1. Signal-Driven Forecasts

  • AI detected BTC signal on June 28 instead of endlessly lagging on charts.
  • Real-time ETH, XRP, ADA, DOGE buy/sell signals help traders time entries precisely.

2. Accuracy-Ranked Grades

  • Each token is assigned a Trader Grade (short‑term outlook) and an Investor Grade (long‑term fundamentals), using 80+ metrics.
  • Daily updates keep grades current and aligned with market shifts.

3. AI-Powered Price Predictions

  • Models incorporate on‑chain indicators, macro factors, whale activity, and ETF flows to generate multi‑year forecasts grounded in data.
  • Multi-currency, multi-metric predictive modeling is unlikely replicated in any other platform.

4. Moonshots & Altcoin Discoveries

  • Token Metrics highlights low‑cap picks ready to capture momentum during bull runs.
  • Includes live ROI tracking and swap integration for execution directly from the platform.

5. Data Visualization & Alerts

  • Custom dashboards show price, grade, TVL, exchange flow, whale builds, and social volume.
  • Alerts via Telegram, Slack, Discord, or email ensure you never miss critical moves or signals.

6. API & MCP Server

  • Developers can use Token Metrics’ Multi‑Client Protocol to integrate into OpenAI Agents, IDEs, slide tools, and backtesting bots—all with consistent data across platforms.

🔒 Strategy Guide for Institutional & Retail Investors

▶ Entry Criteria

  • Watch Token Metrics signals: If crypto1 go bullish, adjacently pump patterns follow.

  • Confirm breakouts at critical resistance levels:

    • BTC: >$118K
    • ETH: >$4K
    • XRP: >$3.40
    • ADA: >$0.80
    • DOGE: >$0.20

📌 Holding Strategy

  • Use Trader Grades to decide short-term holding periods.
  • Switch to Investor Grades for swing or long-term positions.
  • Track DeFi TVL, staking, and bullish fundamentals.

📉 Risk Management

  • Set alerts for bearish signals or grade downgrades.
  • Use stop‑losses near key support:

    • BTC: $90K
    • ETH: $2.5K
    • XRP: $2.10
    • ADA: $0.62
    • DOGE: $0.15

📈 Scaling Approach

  • If forecasts hit 50% of target, take partial profits.
  • Let the rest ride on break‑out confirmation signals.

🔁 Summary Table: 2025 Price Predictions

✅ The Takeaway: Trade Smarter with AI, Not Emotion

We're witnessing one of the most powerful crypto bull cycles since 2021. Institutional capital, macro turbulence, and smart contract expansion are fueling gains across the board.

But this isn't about blind optimism—it's about precision entry, objective signals, and dynamic portfolio management.

That’s why Token Metrics stands out. Its AI forecasting platform offers tools that help investors:

  • Navigate evolving market cycles
  • Forecast realistic price targets
  • Catch altcoin breakouts
  • Mitigate risk with data‑driven signals
  • Stay long-term aligned through governance, DeFi, and macro roots

Get Started with Token Metrics Today

Whether you're trading Bitcoin, Ethereum, or altcoins, Token Metrics equips you with tools to stay ahead. From real‑time signals, AI-predicted price targets, and custom alerts, to developer‑grade APIs, Token Metrics delivers a comprehensive crypto edge.

👉 Sign up now and level‑up your crypto portfolio strategy: tokenmetrics.com

Research

What Is Cryptocurrency? A Beginner’s Guide + How Token Metrics Helps You Invest Smarter

Token Metrics Team
8 min
MIN

Cryptocurrency is no longer just a buzzword — it’s a financial revolution. Since Bitcoin's creation in 2009, digital currencies have disrupted traditional finance, creating an entirely new class of assets. But what exactly is cryptocurrency, how does it work, and how can investors navigate this complex market with the help of tools like Token Metrics?

This comprehensive and SEO-optimized guide explains what cryptocurrency is, how it works, the different types available, and how platforms like Token Metrics help investors make smarter, AI-powered decisions.

🔍 What Is Cryptocurrency?

Cryptocurrency is a digital or virtual form of money that uses cryptography for security. Unlike traditional fiat currencies like the U.S. Dollar or Euro, cryptocurrencies operate on decentralized networks — typically blockchain technology — that aren't controlled by governments or central banks.

Key Features of Cryptocurrencies:

  • Decentralized: Most cryptocurrencies run on decentralized networks called blockchains.
  • Secure: Transactions are secured by cryptographic protocols.
  • Transparent: Blockchain ledgers are public and can be audited in real time.
  • Limited Supply: Many cryptocurrencies, like Bitcoin, have fixed maximum supplies.
  • Borderless: Anyone with an internet connection can use and trade crypto globally.

💡 How Does Cryptocurrency Work?

At the heart of cryptocurrency is blockchain technology — a distributed ledger that records all transactions across a network of computers (called nodes). Each block contains a list of transactions, and once verified, it's added to the chain permanently.

Example:

If Alice sends 1 Bitcoin to Bob, this transaction is verified by nodes and added to the Bitcoin blockchain. No bank is involved, and no one can alter the record.

đŸȘ™ Types of Cryptocurrencies

Thousands of cryptocurrencies exist today, but they typically fall into these categories:

1. Bitcoin (BTC)

The original and most well-known cryptocurrency. It's often viewed as "digital gold" due to its scarcity and store-of-value properties.

2. Altcoins

Any crypto that's not Bitcoin. Examples include:

  • Ethereum (ETH) – Enables smart contracts and decentralized apps.
  • Cardano (ADA) – Focuses on peer-reviewed scientific research.
  • Solana (SOL) – Known for high-speed transactions and low fees.

3. Stablecoins

Digital assets pegged to fiat currencies. Example: USDT (Tether), and USDC. These offer price stability and are widely used for trading and DeFi.

4. Meme Coins

Tokens like Dogecoin (DOGE) or Shiba Inu (SHIB), driven largely by community hype and social media.

5. Utility Tokens

Tokens used within specific platforms, such as BNB for Binance or TMAI for Token Metrics.

📈 Why Do People Invest in Cryptocurrency?

  1. High Return Potential
    Many early adopters have seen exponential gains, particularly in bull markets. Moonshot altcoins can deliver 10x to 100x returns.

  2. Diversification
    Crypto offers exposure outside traditional assets like stocks or bonds.

  3. 24/7 Trading
    Unlike traditional markets, crypto trades nonstop across global exchanges.

  4. Ownership & Transparency
    Blockchain gives users full control and verifiable records of their holdings.

⚠ Risks of Crypto Investing

  • Volatility: Prices can rise or fall rapidly within hours.
  • Security Risks: Hacks and scams are common in poorly secured projects.
  • Regulatory Uncertainty: Rules differ across countries and can change quickly.
  • Market Hype: Many investors get swayed by trends without research.

đŸ€– How Token Metrics Helps You Trade Smarter

Given the complexity and volatility of crypto, using a data-driven platform like Token Metrics can make a huge difference.

What is Token Metrics?

Token Metrics is an AI-powered crypto analytics and investment research platform that helps investors:

  • Discover high-potential altcoins
  • Time market entries and exits
  • Compare tokens across key metrics
  • Set personalized alerts and trading signals

Key Features:

1. AI Price Predictions

Token Metrics uses machine learning to forecast future price ranges for Bitcoin, Ethereum, and 6,000+ altcoins.

2. Trader & Investor Grades

‍

Each token is assigned a Trader Grade (short-term performance) and an Investor Grade (long-term fundamentals), updated daily using 80+ on-chain, technical, and sentiment data points.

3. Moonshot Rankings

Discover small-cap tokens with massive upside using the Moonshots tab, ranked by ROI, volume, grade changes, and time of entry.

4. Real-Time Alerts

Receive instant alerts via Telegram, email, Discord, or SMS for:

  • Price targets
  • Bullish or bearish signals
  • Grade increases or downgrades

5. Token Details Dashboard

Dive deep into any project — fundamentals, top holders, historical grades, AI forecasts, and charting — all in one place.

6. Integrated Swap Widget

Once you’ve done your research, trade instantly through Token Metrics with integrated swap functionality.

🧠 How Beginners Can Use Token Metrics

Step 1: Sign Up for Free
Visit tokenmetrics.com and choose a plan. Free users get 5,000 API calls per month and access to basic analytics.

Step 2: Visit the Ratings Page This page ranks top-performing coins using AI grades and recent performance metrics.

Step 3: Click on Moonshots Looking for the next 100x gem? The Moonshots tab highlights tokens with exceptional short-term upside potential.

Step 4: Set Custom Alerts
Never miss a breakout. Customize alerts for price changes, grade shifts, or buy/sell signals.

Step 5: Explore Deep Research
Use Token Metrics’ detailed pages to analyze tokenomics, volume, investor behavior, and social sentiment.

🔼 The Future of Cryptocurrency

Cryptocurrency is rapidly evolving. With institutional adoption rising, central banks exploring CBDCs, and retail interest growing, the market is entering a more mature phase.

Key trends:

  • Bitcoin ETFs and reserve adoption
  • Layer-2 scaling solutions like Arbitrum and Optimism
  • AI and DeFi integration
  • Tokenized real-world assets (RWAs)

Platforms like Token Metrics will become essential as investors need intelligent, unbiased tools to navigate this increasingly sophisticated market.

✅ Final Thoughts

Cryptocurrency is changing how we think about money, ownership, and investing. But with great opportunity comes complexity. Whether you're a beginner or a seasoned trader, tools like Token Metrics give you the edge you need to:

  • Cut through noise
  • Discover winning trades
  • Manage risk
  • Stay ahead of the curve

Token Metrics isn’t just a research platform — it’s your AI-powered co-pilot in the crypto space.

Choose from Platinum, Gold, and Silver packages
Reach with 25–30% open rates and 0.5–1% CTR
Craft your own custom ad—from banners to tailored copy
Perfect for Crypto Exchanges, SaaS Tools, DeFi, and AI Products