What is VWAP Indicator and How to Use it for Market Analysis?
Learn everything about VWAP (Volume-Weighted Average Price) indicator and discover how to leverage it for analyzing market trends and making well-informed trading decisions.
Token Metrics Team
9 Minutes
Want Smarter Crypto Picks—Free?
See unbiased Token Metrics Ratings for BTC, ETH, and top alts.
Thank you! Your submission has been received!
Oops! Something went wrong while submitting the form.
No credit card | 1-click unsubscribe
In the ever-evolving world of finance and trading, having the right tools and strategies is crucial for success. One such tool that has gained popularity among traders is the VWAP indicator.
Whether you're a seasoned trader or just starting out, understanding the VWAP indicator and how to utilize it for market analysis can significantly improve your trading decisions.
This guide will delve into the intricacies of the VWAP indicator, providing you with valuable insights and practical tips to harness its power.
What is Volume Weighted Average Price (VWAP)?
The VWAP indicator, short for Volume Weighted Average Price, is a technical analysis tool widely used by traders to determine the average price at which a security has been traded throughout the day, weighted by the trading volume at each price level.
By factoring in both price and volume, the VWAP indicator provides a comprehensive picture of market trends and helps traders make informed decisions.
How is VWAP Calculated?
To calculate the VWAP, each trade's price is multiplied by its corresponding volume and then divided by the total volume traded during a given period. The formula is as follows:
VWAP = Cumulative Typical Price x Volume/Cumulative Volume Where Typical Price = High price + Low price + Closing Price/3 Cumulative = total since the trading session opened.
Traders can customize the VWAP indicator to their desired time frame, such as intraday, daily, weekly, or even longer periods. By adjusting the time frame, traders can analyze different market dynamics and adapt their strategies accordingly.
Why is the VWAP Indicator Important?
The VWAP indicator is crucial for market analysis as it offers several benefits. Firstly, it helps identify the average price at which traders are entering or exiting positions, indicating areas of potential support or resistance.
Additionally, it provides insights into the market's overall sentiment and helps distinguish between temporary price fluctuations and significant trend changes. By using the VWAP indicator, traders can effectively gauge market dynamics and optimize their trading strategies.
How to Use VWAP Indicator for Market Analysis?
Now that we have a good understanding of the VWAP indicator and its interpretation, let's explore how to use it effectively for market analysis. Here are some steps to incorporate VWAP into your trading strategy:
Step 1: Plotting the VWAP Indicator
Most trading platforms offer the VWAP indicator as a built-in tool. Start by plotting the VWAP on your price chart. Adjust the time frame according to your trading preferences, whether it's intraday, daily, or longer-term analysis.
Step 2: Assessing VWAP in Conjunction with Price Movements
Analyze the relationship between the VWAP and price movements. When the price is consistently above the VWAP, it suggests a bullish trend, while a price below the VWAP indicates a bearish trend. Pay attention to price interactions with the VWAP, such as bounces off the indicator or breakouts through the VWAP line.
Step 3: Identifying Support and Resistance Levels
Use the VWAP as a dynamic support and resistance level. When the price approaches the VWAP from below and bounces off it, it may act as a support level. Conversely, if the price approaches the VWAP from above and encounters resistance, it may act as a resistance level.
Step 4: Monitoring VWAP Divergence
Watch for divergences between the VWAP and price movements. Divergence occurs when the price and the VWAP indicator move in opposite directions. This can signal a potential trend reversal or weakening momentum, providing valuable insights for traders.
Step 5: Combining VWAP with Other Indicators
Consider combining the VWAP indicator with other technical indicators to validate your market analysis. Popular indicators like moving averages, relative strength index (RSI), or stochastic oscillators can provide additional confirmation signals when used in conjunction with VWAP.
Step 6: Practice Risk Management
Remember to always practice proper risk management techniques when using the VWAP indicator or any other trading tool. Set stop-loss orders to protect your capital and use proper position sizing to manage risk effectively.
Interpreting VWAP Indicator Readings
When using the VWAP indicator for market analysis, it's essential to interpret the readings accurately. Here are some key insights that can be derived from VWAP analysis:
1. VWAP as a Reference Point
The VWAP indicator acts as a reference point for traders, highlighting the average price at which a security has been traded. Traders can compare the current price with the VWAP to determine whether the market is bullish or bearish. If the price is above the VWAP, it indicates bullish sentiment, whereas a price below the VWAP suggests bearish sentiment.
2. VWAP as Support and Resistance
The VWAP indicator can also serve as a dynamic support or resistance level. When the price is above the VWAP, it often acts as a support level, indicating that buyers are in control. Conversely, when the price falls below the VWAP, it may act as a resistance level, suggesting that sellers have the upper hand.
3. VWAP and Volume Divergence
Divergence between the VWAP indicator and volume can provide valuable insights into market trends. If the price is increasing, but the VWAP is declining, it may indicate weakening buying pressure, potentially leading to a reversal. Conversely, if the price is decreasing, but the VWAP is rising, it may signal decreasing selling pressure and a potential market upturn.
4. VWAP Breakouts
Traders often monitor VWAP breakouts to identify potential trading opportunities. A VWAP breakout occurs when the price of a security crosses above or below the VWAP line with a significant increase in volume. This breakout can indicate a shift in market sentiment and the start of a new trend. Traders may look to enter positions when a breakout occurs, anticipating further price movements in the direction of the breakout.
5. VWAP Bands
VWAP bands are another useful tool for market analysis. These bands are created by adding and subtracting a standard deviation from the VWAP line. VWAP bands provide an indication of the price range within which the majority of trading activity is occurring. Traders can use VWAP bands to identify potential overbought or oversold conditions, helping them make more informed trading decisions.
How to Trade With VWAP?
To trade with VWAP, traders can start by plotting the VWAP line on their price charts. This line represents the average price weighted by the trading volume. By comparing the current price of an asset to the VWAP line, traders can identify potential buying or selling opportunities.
If the price is above the VWAP line, it may indicate a bullish trend, suggesting a buy signal. Conversely, if the price falls below the VWAP line, it may signal a bearish trend, indicating a potential sell signal.
Additionally, traders can also use VWAP as a benchmark to assess whether their trades are performing better or worse than the overall market average. However, it is essential to consider other technical indicators, market conditions, and risk management strategies to make well-informed trading decisions.
Is Volume Weighted Average Price (VWAP) Reliable?
The Volume Weighted Average Price (VWAP) is widely used by traders and investors as a reliable indicator of the average price at which a security has traded throughout the day, taking into account the volume of shares traded at each price level.
VWAP is particularly useful for assessing the execution quality of trades and identifying potential entry and exit points. It provides a more comprehensive view of market activity compared to simple average price calculations.
However, like any indicator, VWAP should not be relied upon solely and should be used in conjunction with other technical and fundamental analysis tools. Factors such as market volatility, liquidity, and order flow can influence the accuracy of VWAP readings.
Therefore, it is important for traders and investors to consider the broader market context and their specific trading strategies when using VWAP as a decision-making tool.
FAQs (Frequently Asked Questions)
Q1. What time frame should I use for VWAP analysis?
The time frame for VWAP analysis depends on your trading strategy and preferences. Intraday traders may use shorter time frames, such as 5-minute or 15-minute charts, while swing traders may focus on daily or weekly charts. Experiment with different time frames to find what works best for you.
Q2. Can the VWAP indicator be used for any market?
Yes, the VWAP indicator can be used for various markets, including stocks, crypto and more. It is a versatile tool that provides valuable insights into market dynamics across different trading instruments.
Q3. Does the VWAP indicator work well in volatile markets?
Yes, the VWAP indicator can be particularly useful in volatile markets. Its ability to factor in volume helps smooth out price fluctuations and provides a more accurate representation of market trends. However, as with any indicator, it's important to consider other factors and use proper risk management techniques.
Q4. Can the VWAP indicator be used for long-term investing?
While the VWAP indicator is commonly used for short-term trading and intraday analysis, it can also be applied to long-term investing strategies. Investors can use the VWAP to assess the average price at which a security has been traded over a specified period, helping them make informed decisions about entry or exit points.
Q5. Are there any limitations or drawbacks to using the VWAP indicator?
Like any trading indicator, the VWAP has its limitations. It is primarily based on historical data and may not predict future market movements with 100% accuracy. Additionally, the VWAP is most effective during regular trading hours when volume is high. It may be less reliable during pre-market or after-hours trading when volume is low.
Q6. How can I optimize my VWAP analysis?
To optimize your VWAP analysis, consider incorporating other technical indicators or chart patterns. Combining the VWAP with indicators such as moving averages, MACD, or Bollinger Bands can provide additional confirmation signals and enhance your market analysis.
The Bottom Line
VWAP proves to be an invaluable instrument for mitigating uncertainty and haphazard trades. It furnishes day traders with the mean weighted price, empowering them to capitalize on their day trading activities and achieve multiple profits.
By incorporating additional technical analysis tools such as channel bands, pivot points, and trendlines alongside VWAP, an array of novel trading strategies can be formulated. It is imperative for traders to exercise caution, employ the VWAP indicator prudently, and steer clear of misleading signals.
Disclaimer
The information provided on this website does not constitute investment advice, financial advice, trading advice, or any other sort of advice and you should not treat any of the website's content as such.
Token Metrics does not recommend that any cryptocurrency should be bought, sold, or held by you. Do conduct your own due diligence and consult your financial advisor before making any investment decisions.
Build Smarter Crypto Apps & AI Agents in Minutes, Not Months
Real-time prices, trading signals, and on-chain insights all from one powerful API.
Token Metrics: AI-powered crypto research and ratings platform. We help investors make smarter decisions with unbiased Token Metrics Ratings, on-chain analytics, and editor-curated “Top 10” guides. Our platform distills thousands of data points into clear scores, trends, and alerts you can act on.
See unbiased Token Metrics Ratings for BTC, ETH, and top alts.
Thank you! Your submission has been received!
Oops! Something went wrong while submitting the form.
No credit card | 1-click unsubscribe
Token Metrics Team
The Token Metrics Team comprises blockchain and cryptocurrency experts dedicated to providing accurate information and empowering investors. Through our blog, we aim to educate and inspire readers to navigate the world of cryptocurrencies confidently.
Token Metrics Team
The Token Metrics Team comprises blockchain and cryptocurrency experts dedicated to providing accurate information and empowering investors. Through our blog, we aim to educate and inspire readers to navigate the world of cryptocurrencies confidently.
Create Your Free Token Metrics Account
Access our Ratings Page for valuable token insights
Explore our Market Page for a comprehensive market overview
Stay in the loop with exclusive weekly Newsletters filled with insider tips and updates
Join our private Telegram group for exclusive community access
Bitcoin and Ethereum stand as the two most influential digital assets in the crypto market, commanding the largest market capitalization and driving innovation across the cryptocurrency space. While both leverage blockchain technology and represent leading digital assets, they serve fundamentally different purposes and operate through distinct technical architectures.
Understanding how bitcoin differs from ethereum requires examining their core philosophies, technical implementations, and real-world applications. Bitcoin functions primarily as a decentralized digital currency and store of value, while Ethereum operates as a flexible platform for smart contracts and decentralized applications. These fundamental differences ripple through every aspect of their design, from consensus mechanisms to investment considerations.
This comprehensive analysis explores the key differences between these blockchain pioneers, helping investors and enthusiasts understand their unique value propositions in the evolving global markets.
Core Purpose and Philosophy
Bitcoin was conceived as digital gold and a decentralized digital currency, launched in 2009 by the pseudonymous Satoshi Nakamoto. The bitcoin network was designed to address the fundamental problem of double-spending in digital transactions without requiring a central authority. Bitcoin aims to serve as an alternative to traditional monetary systems, emphasizing censorship resistance, predictability, and long-term value preservation.
Ethereum emerged in 2015 through the vision of Vitalik Buterin and the ethereum foundation, serving as a programmable blockchain platform for smart contracts and decentralized applications. Rather than competing directly with bitcoin as digital money, Ethereum positions itself as a “world computer” that can execute complex financial transactions and automate agreements through smart contract technology.
The philosophical divide runs deep: Bitcoin prioritizes security, decentralization, and conservative monetary policy with minimal changes to its core protocol. Bitcoin focuses on being the most secure and reliable digital asset, maintaining backward compatibility and requiring overwhelming consensus for any protocol modifications.
Ethereum emphasizes innovation, flexibility, and rapid development of decentralized technologies. Ethereum developers actively pursue technical improvements to enhance scalability, reduce energy consumption, and expand functionality. This approach enables Ethereum to evolve quickly but introduces more complexity and potential points of failure.
Bitcoin’s simplicity and laser focus on monetary use cases contrasts sharply with Ethereum’s ambitious goal to decentralize internet services and create a new foundation for digital finance and Web3 applications.
Technical Architecture Differences
The technical architecture reveals fundamental differences in how these networks operate and validate transactions. Bitcoin uses a Proof-of-Work consensus mechanism requiring energy-intensive mining operations, where bitcoin miners compete to solve cryptographic puzzles and secure the bitcoin blockchain. This process generates new blocks approximately every 10 minutes, ensuring predictable transaction settlement and robust security.
Ethereum originally used Proof-of-Work but completed its transition to Proof-of-Stake through “The Merge” in September 2022. The ethereum network now relies on validators who stake ETH to propose and validate new blocks every 12 seconds. This shift dramatically reduced ethereum’s energy consumption while enabling more rapid transaction processing and network upgrades.
Bitcoin supports limited scripting capabilities focused on secure value transfer and basic programmable transactions. Recent upgrades like Taproot have expanded Bitcoin’s scripting abilities while maintaining its conservative approach to functionality. The bitcoin blockchain prioritizes reliability and predictability over programmability.
Ethereum features Turing-complete smart contracts through the Ethereum Virtual Machine (EVM), enabling developers to build complex decentralized applications without intermediaries. The ethereum blockchain serves as the core infrastructure for thousands of decentralized finance protocols, NFT marketplaces, and Web3 applications.
Transaction throughput differs significantly: Bitcoin processes approximately 5-7 transactions per second on its base layer, while Ethereum handles 12-15 transactions per second. Both networks face scalability constraints on their base layers, leading to different approaches for increasing capacity.
Supply Models and Monetary Policy
Bitcoin’s monetary policy represents one of its most distinctive features: a fixed supply capped at 21 million coins with halving events every four years that reduce new issuance. This finite supply creates predictable scarcity and positions bitcoin as a hedge against inflation and currency debasement. Bitcoin’s supply schedule remains unchanged since its launch, providing long-term certainty for holders.
Ethereum implements a dynamic supply model with no fixed cap, currently maintaining around 120 million ETH in circulation. Unlike bitcoin’s supply, Ethereum’s tokenomics have evolved significantly since launch. The implementation of EIP-1559 introduced fee burning, where a portion of transaction fees gets permanently removed from circulation, creating deflationary pressure during periods of high network activity.
Bitcoin’s halving events create predictable supply reduction approximately every four years, cutting mining rewards in half and historically driving significant price appreciation. These events are programmed into the protocol and cannot be changed without overwhelming network consensus.
Ethereum’s supply adjusts based on network usage and validator participation. During periods of high transaction volume and DeFi activity, ethereum’s fee burning can exceed new ETH issuance, making the native cryptocurrency deflationary. This mechanism ties ethereum’s monetary policy directly to network utility and adoption.
The contrasting approaches reflect each network’s priorities: Bitcoin emphasizes monetary predictability and long-term store of value characteristics, while Ethereum aligns its economics with platform usage and technological development.
Smart Contracts and Applications
Bitcoin supports basic scripting for simple programmable transactions, multi-signature wallets, and time-locked contracts. Recent technical improvements through Taproot have enhanced Bitcoin’s scripting capabilities while maintaining its focus on security and simplicity. These features enable applications like atomic swaps and more sophisticated payment channels, but Bitcoin deliberately limits complexity to preserve network security.
Ethereum pioneered smart contracts, enabling complex decentralized applications that operate without intermediaries or central control. Smart contract functionality allows developers to create autonomous financial protocols, governance systems, and digital asset management platforms. The ethereum blockchain hosts the vast majority of decentralized finance activity, NFT trading, and tokenized assets.
Ethereum’s programmability has spawned an entire ecosystem of decentralized applications across numerous sectors. DeFi protocols on Ethereum facilitate lending, borrowing, trading, and yield farming with billions of dollars in total value locked. NFT marketplaces, gaming platforms, and decentralized autonomous organizations (DAOs) represent additional use cases unique to programmable blockchains.
Bitcoin applications focus primarily on payments, store of value, and Layer-2 solutions like bitcoin’s lightning network. The Lightning Network enables instant, low-cost Bitcoin payments through payment channels, expanding Bitcoin’s utility for everyday transactions while preserving the main chain’s security and decentralization.
Ethereum’s flexibility enables diverse use cases from supply chain management to insurance protocols, but this complexity introduces additional security considerations and potential smart contract vulnerabilities that don’t exist in Bitcoin’s simpler model.
Scalability Solutions
Bitcoin and Ethereum pursue different scaling philosophies to address throughput limitations. Bitcoin scales primarily through off-chain solutions that preserve the base layer’s simplicity, security, and decentralization. This approach maintains full node accessibility with minimal hardware requirements, ensuring anyone can validate the bitcoin network independently.
Bitcoin’s lightning network represents the primary scaling solution, creating payment channels that enable instant, low-cost transactions without broadcasting every payment to the main blockchain. While promising for micropayments and frequent transactions, the Lightning Network requires additional technical complexity and liquidity management.
Ethereum uses a multi-layered scaling approach combining Layer-2 rollups with planned on-chain improvements like sharding. Layer-2 solutions such as Arbitrum, Optimism, and Polygon process transactions off the main ethereum blockchain while inheriting its security guarantees. These scaling solutions already handle thousands of transactions per second with significantly lower fees.
Ethereum’s modular scaling architecture aims to boost capacity through multiple parallel solutions rather than increasing base layer throughput. This approach allows specialized Layer-2 networks to optimize for specific use cases while maintaining composability with the broader ethereum ecosystem.
The planned implementation of sharding will further increase ethereum’s capacity by dividing the network into multiple parallel chains. Combined with Layer-2 rollups, this architecture could enable millions of transactions per second across the ethereum network while maintaining decentralization and security.
Market Performance and Volatility
Bitcoin typically exhibits lower volatility compared to Ethereum and often serves as a portfolio diversifier during broader market uncertainty. As the original cryptocurrency and largest digital asset by market cap, Bitcoin tends to lead market cycles and attract institutional investment as a digital store of value and inflation hedge.
Ethereum historically shows approximately 30% higher volatility than Bitcoin due to its exposure to decentralized finance activity, NFT trading volumes, and smart contract platform competition. Ethereum’s price reflects not just investment demand but also utility demand from users paying transaction fees and interacting with decentralized applications.
Bitcoin’s price correlates strongly with adoption as digital gold, institutional investment flows, and macroeconomic factors affecting traditional safe-haven assets. Major institutional announcements, regulatory developments, and central bank monetary policy significantly impact Bitcoin’s valuation.
Ethereum’s value reflects usage in DeFi protocols, NFT marketplaces, and smart contract deployment. Network congestion, Layer-2 adoption, and competition from alternative smart contract platforms influence ethereum’s price beyond pure investment demand.
Both bitcoin and ethereum respond to broader macroeconomic factors, but Ethereum shows stronger correlation to technology sector performance due to its role as a platform for innovation. Investment companies and hedge funds often hold both assets to balance stability with exposure to blockchain technology growth.
Developer Ecosystems and Governance
Bitcoin development follows a conservative, consensus-driven approach through Bitcoin Improvement Proposals (BIPs) that require extensive testing and broad community agreement. Bitcoin developers prioritize backward compatibility and security over rapid feature deployment, resulting in slower but more deliberate protocol evolution.
Ethereum development moves rapidly through Ethereum Improvement Proposals (EIPs) and coordinated leadership from the ethereum foundation and core development teams. This governance model enables faster innovation but concentrates more decision-making authority in the hands of key developers and researchers.
Bitcoin’s decentralized development process prevents unilateral changes to the protocol, requiring overwhelming consensus from users, miners, and developers. This approach protects against contentious forks and preserves Bitcoin’s monetary policy, but can slow adoption of beneficial upgrades.
Ethereum regularly implements protocol upgrades to improve functionality, reduce fees, and address scalability challenges. The coordinated development process enables ambitious technical roadmaps but raises questions about centralization of development decisions.
The underlying technology differences extend to developer tooling and ecosystem support. Ethereum offers extensive development frameworks, testing environments, and educational resources for building decentralized applications. Bitcoin development focuses more narrowly on protocol improvements and second-layer solutions.
Both networks benefit from active open-source communities, but Ethereum attracts more application developers while Bitcoin emphasizes protocol and infrastructure development.
Energy Consumption and Environmental Impact
Energy consumption represents one of the most significant differences between Bitcoin and Ethereum post-Merge. Bitcoin’s Proof-of-Work mining consumes substantial energy but secures the world’s most valuable cryptocurrency network with unmatched computational power and geographic distribution.
Current estimates place Bitcoin’s annual energy consumption between 70-130 TWh, comparable to small countries. However, bitcoin miners increasingly utilize renewable energy sources and drive clean energy adoption by monetizing stranded renewable capacity and excess energy production.
Ethereum’s transition to Proof-of-Stake reduced energy consumption by approximately 99.9% after The Merge, making it one of the most energy-efficient blockchain networks. Ethereum’s PoS consensus requires ETH staking rather than energy-intensive mining operations, dramatically reducing its environmental footprint.
The energy debate influences institutional adoption decisions, with some investment companies preferring ethereum’s lower environmental impact while others value Bitcoin’s proven security model despite higher energy usage. Environmental, social, and governance (ESG) considerations increasingly factor into cryptocurrency investment decisions.
Bitcoin proponents argue that energy consumption secures the network and incentivizes renewable energy development, while Ethereum supporters emphasize the efficiency gains from Proof-of-Stake consensus. Both perspectives reflect valid priorities in balancing security, decentralization, and environmental responsibility.
Investment Considerations
Bitcoin serves as an inflation hedge and uncorrelated asset for portfolio diversification, appealing to investors seeking exposure to digital gold characteristics without traditional precious metals storage challenges. Bitcoin’s established track record, regulatory clarity, and institutional adoption make it attractive for conservative cryptocurrency allocation.
Ethereum offers exposure to Web3 growth and decentralized finance innovation, providing leverage to the expanding blockchain application ecosystem. Investors choosing Ethereum bet on the continued growth of smart contract platforms and decentralized applications beyond simple value transfer.
Both assets face similar regulatory challenges, but Bitcoin benefits from clearer legal status in many jurisdictions due to its commodity-like characteristics. Ethereum’s classification remains more complex due to its programmable features and the potential for securities regulations to apply to certain tokens and applications.
Bitcoin provides returns primarily through price appreciation, though lending platforms offer yields similar to staking rewards. Ethereum enables native staking rewards of approximately 3-5% annually plus potential price appreciation, providing income generation alongside capital gains potential.
Portfolio construction often includes both bitcoin and ethereum to balance stability with growth potential. Many institutional investors and investment strategy frameworks recommend exposure to both assets given their different risk profiles and correlation patterns with traditional asset classes.
The choice between bitcoin vs ethereum often depends on investment objectives, risk tolerance, and beliefs about the future of digital money versus programmable blockchain platforms.
Future Outlook and Development Roadmaps
Bitcoin’s development roadmap focuses on gradual improvements like Taproot adoption, sidechains development, and bitcoin’s lightning network expansion. Future development emphasizes incremental enhancements to privacy, scripting capabilities, and second-layer scaling while maintaining the core protocol’s simplicity and security.
Ethereum pursues ambitious upgrades including sharding implementation, proto-danksharding for rollup scaling, and continued Layer-2 ecosystem development. Ethereum’s future events include account abstraction for improved user experience and continued optimization of the Proof-of-Stake consensus mechanism.
Bitcoin’s conservative approach prioritizes stability and gradual feature addition, with major changes requiring years of testing and community consensus. This methodology protects against unintended consequences but may limit Bitcoin’s ability to compete with more flexible blockchain platforms.
Ethereum faces competition from newer Layer-1 blockchains offering faster transactions and lower fees, but maintains significant advantages in developer mindshare, ecosystem maturity, and network effects. Ethereum’s roadmap addresses scalability concerns while preserving decentralization and security.
Both networks continue evolving to meet different needs in the expanding cryptocurrency ecosystem. Bitcoin solidifies its position as digital gold and the leading store of value cryptocurrency, while Ethereum develops as the primary platform for decentralized applications and financial innovation.
The fundamental differences between these networks suggest complementary rather than competitive futures, with each serving distinct roles in the broader digital asset landscape. Future performance will depend on continued technical development, regulatory clarity, and mainstream adoption across different use cases.
Key Takeaways
Understanding how bitcoin differs from ethereum reveals two complementary approaches to blockchain technology and digital assets. Bitcoin excels as a decentralized digital currency and store of value with predictable monetary policy and uncompromising security focus. Ethereum leads in programmable blockchain capabilities, enabling complex decentralized finance applications and serving as the foundation for Web3 innovation.
The key differences span every aspect from consensus mechanisms and energy consumption to governance philosophies and investment characteristics. Bitcoin’s Proof-of-Work mining and fixed supply contrast sharply with Ethereum’s Proof-of-Stake validation and dynamic tokenomics. Both bitcoin and ethereum offer distinct value propositions for different investor goals and risk profiles.
Rather than viewing these as competing cryptocurrencies, many investors and institutions recognize both bitcoin and ethereum as foundational digital assets serving different purposes in a diversified portfolio. Bitcoin provides stability and inflation hedging characteristics, while Ethereum offers exposure to technological innovation and the growing decentralized application ecosystem.
As the cryptocurrency space continues maturing, both networks face ongoing challenges around scalability, regulation, and competition. However, their established network effects, developer communities, and institutional adoption suggest continued relevance in the evolving digital asset landscape.
For investors considering exposure to cryptocurrency markets, understanding these fundamental differences enables more informed decision-making about portfolio allocation and investment strategy. Whether choosing Bitcoin’s digital gold characteristics or Ethereum’s programmable platform capabilities, both assets represent significant innovations in monetary technology and decentralized systems.
This content is for educational purposes only and should not be considered investment advice. Cryptocurrency investments carry significant risks, and past performance does not guarantee future results. Always consult with qualified financial advisors and conduct thorough research before making investment decisions.
The digital asset landscape has evolved dramatically, with web3 wallets becoming the essential gateway for managing cryptocurrencies, NFTs, and interacting with decentralized applications. As the cryptocurrency market reaches a staggering $2.3 trillion valuation in 2025, understanding how to securely store and manage your digital assets has never been more critical.
Unlike traditional banking apps that merely display account balances, web3 wallets provide users complete control over their crypto assets while enabling direct interaction with blockchain networks and smart contracts. This revolutionary approach to digital asset management has attracted over 150 million users globally, fundamentally changing how we think about ownership and financial sovereignty.
Whether you’re new to cryptocurrency or looking to enhance your Web3 security practices, this comprehensive guide will help you navigate the complex world of web3 wallets, understand the different types available, and choose the right solution for your needs.
What Are Web3 Wallets and Why You Need One
A web3 wallet serves as your digital gateway to the decentralized web, functioning as both a secure storage solution for valuable digital assets and an interface for interacting with blockchain-based services. Unlike custodial wallets managed by centralized exchanges, these digital wallet solutions give users direct control over their private keys and, consequently, their funds.
The key difference between web3 wallets and traditional financial apps lies in their ability to connect directly with decentralized applications. When you use a crypto wallet to interact with DeFi protocols, NFT marketplaces, or blockchain games, you’re not relying on intermediary services. Instead, your wallet software communicates directly with smart contracts on various blockchain networks.
This direct interaction capability has made web3 wallets indispensable in today’s crypto ecosystem. Users can collect NFTs, participate in decentralized finance protocols, vote in DAOs, and manage multiple digital assets across multiple chains—all from a single interface. The wallet serves as your digital identity on the blockchain, allowing you to sign transactions and authorize interactions with complete autonomy.
The gateway function extends beyond simple asset storage. Modern web3 wallets support multichain operations, enabling users to manage assets across multiple networks like Ethereum, Solana, Polygon, and dozens of other blockchain networks. This multi-chain support has become essential as the Web3 ecosystem has expanded beyond Ethereum to include diverse blockchain protocols optimized for different use cases.
How Web3 Wallets Function
Understanding the technical mechanics behind web3 wallets helps users make informed decisions about security and functionality. At their core, these wallets operate using cryptographic key pairs: a public key that serves as your wallet address for receiving funds, and a private key that proves ownership and enables you to sign transactions.
The seed phrase, typically consisting of 12 to 24 randomly generated words, serves as the master backup for wallet recovery. This recovery phrase mathematically generates your private keys, meaning anyone with access to your seed phrase can recreate your entire wallet on any compatible device. This system ensures that users maintain access to their assets even if their original device is lost or damaged.
When you initiate a transaction, your wallet software creates a digital signature using your private key. This signature proves to the network that you own the assets being transferred without revealing your private key itself. The transaction is then broadcast to the relevant blockchain network, where miners or validators verify and process it according to the network’s consensus rules.
Smart contract interaction represents one of the most powerful features of modern web3 wallets. When you connect to a decentralized application, the wallet doesn’t just send simple transactions—it can interact with complex programmable contracts that execute automatically based on predefined conditions. This enables sophisticated DeFi operations like yield farming, liquidity provision, and automated trading strategies.
Connection to blockchain nodes ensures real-time data synchronization and transaction verification. Most wallet software connects to multiple node providers to ensure reliability and prevent single points of failure. This distributed approach maintains the decentralized ethos while providing users with fast, reliable access to blockchain data.
Types of Web3 Wallets
The web3 wallet ecosystem offers three primary categories, each designed for different user needs and security requirements. Understanding these distinctions is crucial for choosing the right solution for your digital asset management strategy.
Non-Custodial Wallets
Non custodial wallets represent the purest form of Web3 asset management, providing users complete control over their private keys and eliminating reliance on third-party services. This self-custody approach aligns with Web3’s core principles of decentralization and user sovereignty.
MetaMask leads this category with over 30 million monthly active users, primarily serving the Ethereum ecosystem and EVM-compatible networks. Its browser extension design makes it the preferred choice for DeFi interactions, while its mobile app extends functionality to on-the-go asset management.
Phantom has captured the Solana ecosystem with 7 million users, offering specialized features for the high-speed, low-cost blockchain. The wallet’s integration with Solana’s unique architecture provides users with near-instant transactions and access to the growing Solana DeFi ecosystem.
Trust Wallet appeals to mobile-first users with support for 65+ blockchain networks and 60 million users worldwide. Its mobile apps for iOS and Android prioritize ease of use while maintaining non custodial principles, making it an excellent entry point for users transitioning from custodial solutions.
The primary advantage of non custodial wallets lies in true ownership—no company or government can freeze your assets or restrict your access. Users enjoy enhanced security practices through direct private key control and can interact with any compatible decentralized application without permission.
However, this freedom comes with significant responsibility. Users must secure their private keys offline and manage their own recovery options. Losing access to your seed phrase means permanently losing your assets, with no customer support team available to help recover lost funds.
Custodial Wallets
Custodial wallets bridge the gap between traditional finance and Web3, offering familiar login systems while providing access to blockchain networks. Major providers like Coinbase Wallet, Binance, and Kraken manage private keys on behalf of users, implementing enterprise-grade security measures and regulatory compliance protocols.
These platforms typically require KYC verification, collecting personal information to comply with financial regulations. While this reduces privacy compared to non custodial alternatives, it enables features like password recovery, customer support, and integration with traditional financial services.
The customer support availability represents a significant advantage for users who prefer having assistance when problems arise. Lost passwords can be recovered through email verification, and customer service teams can help resolve account issues—luxuries unavailable with self-custody solutions.
Integration with centralized exchanges provides seamless trading experiences, allowing users to move between spot trading, derivatives, and DeFi interactions without complex wallet connections. This unified experience appeals to users who want comprehensive crypto services from a single provider.
However, custodial solutions contradict Web3’s core principles of self-sovereignty. Users must trust the platform’s security measures and remain vulnerable to company policies, regulatory actions, and potential platform failures.
Smart Contract Wallets
Smart contract wallets represent the next generation of digital asset management, utilizing account abstraction technology to provide programmable wallet features that traditional wallets cannot offer. These innovative solutions address many pain points associated with conventional wallet designs.
Multi-signature security allows users to set customizable approval thresholds, requiring multiple parties to sign transactions before execution. This feature proves invaluable for organizations, families, or individuals managing significant digital asset portfolios who want enhanced security without sacrificing functionality.
Social recovery options eliminate dependency on seed phrases by allowing users to designate trusted contacts who can help recover wallet access. This system significantly reduces the risk of permanent asset loss while maintaining decentralized principles.
Gasless transactions and batched operations improve user experience by allowing wallet providers or dApps to sponsor transaction fees. Users can interact with blockchain networks without holding native tokens for gas, removing a major barrier to mainstream adoption.
Leading examples include Safe (formerly Gnosis Safe), which has secured billions in digital assets for organizations and power users. Argent focuses on mobile-first smart contract wallets with social recovery, while ZenGo implements Multi-Party Computation (MPC) technology to eliminate private keys entirely.
The enhanced security features come with increased complexity in setup and operation. Smart contract wallets often require more technical understanding and may have higher transaction costs due to their programmable nature.
Top Web3 Wallets in 2025
The current wallet landscape offers diverse solutions tailored to different blockchain ecosystems and user preferences. Understanding each wallet’s strengths helps users make informed decisions based on their specific needs and primary blockchain networks.
MetaMask dominates the Ethereum ecosystem with over 30 million monthly active users accessing its browser extension and mobile apps. The wallet’s early entry into the market and consistent development have made it synonymous with Web3 interactions for many users.
The wallet supports Ethereum, Polygon, Arbitrum, Optimism, and over 500 other networks, making it the most versatile option for users active across multiple blockchain networks. Its extensive network support enables users to access virtually any EVM-compatible dApp or protocol.
Built-in token swaps through aggregators like 1inch and Paraswap provide competitive rates without leaving the wallet interface. This integration streamlines the trading process and helps users avoid the complexity of connecting to multiple decentralized exchanges.
Hardware wallet integration with Ledger and Trezor devices allows users to maintain maximum security for long term storage while enjoying the convenience of hot wallet interactions. This hybrid approach appeals to users managing significant digital asset portfolios.
Portfolio tracking and NFT gallery features help users monitor their holdings across multiple networks and view their digital collectibles in an organized interface. These features have become essential as users accumulate diverse digital assets across various protocols.
Phantom has established itself as the primary wallet for Solana with over 7 million users, capitalizing on the blockchain’s high-speed, low-cost transactions to create a superior user experience. The wallet’s design prioritizes speed and simplicity, reflecting Solana’s technical advantages.
Multi-chain expansion to Ethereum and Polygon in 2024 has broadened Phantom’s appeal beyond Solana natives. This strategic expansion allows users to manage assets across multiple networks while maintaining the wallet’s signature user experience.
The integrated NFT marketplace and staking interface provide native access to Solana’s vibrant NFT ecosystem and staking opportunities. Users can stake SOL directly from their wallet interface and browse trending NFT collections without connecting to external platforms.
Low transaction fees averaging $0.00025 on Solana make Phantom particularly attractive for users who frequently interact with dApps or trade frequently. This cost advantage has driven significant adoption among DeFi power users and NFT traders.
Built-in DeFi protocol connections and token swaps leverage Solana’s ecosystem of high-performance applications. The wallet’s integration with Jupiter aggregator ensures users receive competitive swap rates across Solana’s various DEXs.
Trust Wallet serves 60 million users with comprehensive support for 65+ blockchain networks, positioning itself as the leading mobile-first wallet solution. Its acquisition by Binance has provided resources for continuous development while maintaining its decentralized, non custodial approach.
The mobile-first design philosophy prioritizes smartphone usability, recognizing that many users prefer managing their crypto assets on mobile devices. The iOS and Android apps offer intuitive interfaces optimized for touch interactions and mobile security features.
Integrated DEX aggregator and staking options for 20+ cryptocurrencies provide comprehensive DeFi access without requiring complex external connections. Users can stake popular tokens directly from their mobile interface and access liquidity across multiple networks.
WalletConnect support enables seamless connections to dApps across the web, allowing mobile users to interact with desktop-based protocols and services. This standard has become essential for mobile wallet functionality as the dApp ecosystem has expanded.
The recently launched browser extension in late 2024 has expanded Trust Wallet’s reach to desktop users, providing a unified experience across devices while maintaining the wallet’s mobile-optimized design principles.
Web3 Wallet Security Best Practices
Securing digital assets requires understanding and implementing multiple layers of protection. With over $50 billion in user assets at stake across various wallet platforms, following established security practices becomes critical for preventing loss through hacks, scams, or user error.
Private Key and Seed Phrase Protection
The fundamental rule of crypto security centers on protecting your private key and seed phrase—the cryptographic elements that provide access to your funds. These sensitive pieces of information should never be shared with anyone, regardless of their claims about wallet validation, technical support, or investment opportunities.
Store seed phrases offline in secure physical locations, avoiding digital storage methods that could be compromised by hackers. Consider using metal backup plates for important wallets, as these resist fire, water, and physical damage better than paper storage methods.
Use hardware wallets for holdings above $10,000, as these devices keep private keys offline and require physical confirmation for transactions. Leading hardware wallet providers like Ledger offer enhanced security for valuable digital assets through specialized secure elements and offline transaction signing.
Create multiple backup copies of your seed phrase and store them in different secure locations. This redundancy protects against localized disasters or theft while ensuring you maintain access to your assets if one backup becomes unavailable.
Avoid storing seed phrases in cloud services, email accounts, or smartphone photos, as these digital storage methods remain vulnerable to hacking, account compromise, or accidental exposure. Even encrypted cloud storage introduces unnecessary risk for such critical information.
Transaction Security
Always verify transaction details before signing, including recipient addresses, token amounts, and gas fees. Modern wallet software provides transaction previews, but users must develop habits of careful review before approving any blockchain interaction.
Use test transactions for large transfers above $1,000, sending small amounts first to verify addresses and network compatibility. This practice helps prevent costly mistakes and ensures successful delivery for significant transfers.
Check contract addresses on blockchain explorers like Etherscan before interacting with new protocols or tokens. Scammers frequently deploy fake contracts with similar names to legitimate projects, targeting users who don’t verify contract authenticity.
Enable transaction simulation features when available, as these tools predict transaction outcomes and identify potential issues before execution. Wallet guard features and simulation services help users understand complex smart contract interactions.
Monitor wallet activity regularly for unauthorized transactions or suspicious approvals. Many security breaches remain undetected for extended periods, allowing attackers to gradually drain funds or wait for optimal timing to exploit approvals.
Phishing and Scam Prevention
Only download wallets from official websites and app stores, verifying publisher information and reading user reviews before installation. Fake wallet apps on unofficial stores often contain malware designed to steal private keys or redirect funds to attacker-controlled addresses.
Verify URLs before connecting wallets to dApps, as phishing sites frequently use similar domain names to legitimate protocols. Bookmark trusted DeFi protocols and NFT marketplaces to avoid accidentally connecting to malicious copies.
Be cautious of unsolicited direct messages offering crypto opportunities, technical support, or claiming to represent wallet companies. Legitimate companies do not initiate contact through social media or messaging platforms to request sensitive information.
Never enter seed phrases on websites claiming to “validate” wallets, sync accounts, or resolve technical issues. Legitimate services never require seed phrase entry through web interfaces, and such requests always indicate scam attempts.
Use bookmarks for trusted DeFi protocols and NFT marketplaces rather than searching for them repeatedly. This practice reduces exposure to malicious advertisements and fake websites that may appear in search results.
Choosing the Right Web3 Wallet for Your Needs
Selecting an appropriate wallet requires evaluating your experience level, asset value, intended use cases, and technical requirements. The decision framework should prioritize security for significant holdings while considering convenience factors for frequent interactions.
Blockchain compatibility requirements vary significantly based on your preferred ecosystem. Ethereum users need robust EVM support, while Solana enthusiasts benefit from native integration with that ecosystem’s unique features. Multi-chain users should prioritize wallets offering seamless network switching and broad protocol support.
Feature prioritization depends on your primary activities within Web3. DeFi users benefit from integrated DEX aggregators and protocol connections, while NFT collectors need robust gallery features and marketplace integration. Traders might prioritize low fees and fast transaction processing.
Cost considerations include transaction fees, hardware wallet prices, and potential premium features. Ethereum’s higher gas costs make efficient transaction batching important, while Solana’s low fees enable more frequent interactions. Hardware wallets represent significant upfront costs but provide essential security for substantial holdings.
For Beginners
Start with custodial wallets like Coinbase Wallet for easy recovery and customer support while learning Web3 fundamentals. These platforms provide training wheels for the crypto ecosystem, allowing users to gain experience before taking on full self-custody responsibilities.
Use small amounts initially to learn wallet mechanics and understand transaction processes. Practice sending small amounts between addresses, connecting to simple dApps, and managing basic portfolio activities before committing significant funds.
Focus on major cryptocurrencies like Bitcoin and Ethereum during the learning phase, avoiding complex DeFi protocols or exotic tokens until you understand basic wallet operations. This conservative approach reduces risk while building foundational knowledge.
Gradually transition to non custodial options as confidence grows and understanding improves. This progression allows users to benefit from Web3’s self-sovereignty while developing necessary security habits and technical skills.
Take advantage of educational resources and tutorials provided by wallet companies and Web3 education platforms. Many wallet providers offer comprehensive guides and practice environments for learning safe usage patterns.
For Advanced Users
Implement a multi-wallet strategy combining hot and cold storage solutions based on usage frequency and security requirements. This approach optimizes both convenience for frequent interactions and security for long-term holdings.
Use hardware wallets for significant holdings and long term storage, keeping only necessary amounts in hot wallets for daily transactions and dApp interactions. This segmentation significantly reduces exposure to online threats while maintaining operational flexibility.
Consider smart contract wallets for DeFi activities and DAO participation, as these solutions provide enhanced security features and programmable functionality that benefit power users managing complex interactions.
Maintain multiple wallet addresses for privacy and security segmentation, using different addresses for different activities or protocols. This practice improves privacy and reduces the impact of potential security compromises.
Conduct regular security audits and wallet rotation practices, reviewing permissions granted to dApps and revoking unnecessary approvals. Many users accumulate hundreds of token approvals over time, creating unnecessary security risks.
Web3 Wallet Integration with Trading Platforms
Modern web3 wallets serve as more than storage solutions—they function as comprehensive interfaces for accessing the broader crypto ecosystem, including advanced trading platforms and research tools like Token Metrics. Understanding how wallets connect to various services helps users maximize their crypto experience while maintaining security.
WalletConnect protocol enables secure dApp interactions by creating encrypted connections between wallets and decentralized applications. This standard allows mobile users to connect their non custodial wallet to desktop dApps through QR code scanning, maintaining security while enabling complex interactions.
The integration capabilities extend beyond simple asset swaps to include sophisticated trading strategies and portfolio management. Advanced users can connect their wallets to platforms that provide comprehensive market analysis, trading signals, and portfolio optimization tools.
Token Metrics stands out as the leading cryptocurrency trading and research platform, offering AI-powered analytics that help users make informed decisions about their digital asset investments. The platform’s integration with web3 wallets provides seamless access to professional-grade research tools, including real-time market analysis, trading signals, and portfolio tracking features.
When connecting your wallet to trading platforms, Token Metrics offers unique advantages through its comprehensive research capabilities. The platform analyzes thousands of cryptocurrencies using artificial intelligence and machine learning algorithms, providing users with actionable insights that significantly improve trading outcomes.
The portfolio tracking features available through Token Metrics integration help users monitor their wallet holdings across multiple networks and protocols. This comprehensive analysis includes profit/loss calculations, risk assessment, and optimization recommendations based on current market conditions.
For users serious about cryptocurrency trading and investment, Token Metrics provides unparalleled research depth through its wallet integrations. The platform’s AI-driven approach to market analysis, combined with secure wallet connectivity, creates an optimal environment for making informed trading decisions while maintaining full control over your digital assets.
Future of Web3 Wallets
The evolution of web3 wallets continues accelerating as developers address current limitations and expand functionality. Several key trends are shaping the next generation of digital asset management solutions, promising improved user experiences and enhanced security.
Account abstraction adoption is reducing user experience friction by implementing smart contract-based wallets that eliminate many technical barriers to Web3 participation. This technology enables gasless transactions, social recovery options, and programmable wallet features that traditional wallets cannot provide.
Cross-chain interoperability improvements in 2025 are making multi-chain asset management more seamless and intuitive. New protocols and bridging solutions allow users to move assets between blockchain networks with minimal friction, while wallets integrate these capabilities natively.
Social recovery mechanisms are gradually replacing seed phrases as the primary backup method for wallet access. These systems allow users to designate trusted contacts who can help recover wallet access without compromising security or decentralization principles.
Biometric authentication and Multi-Party Computation (MPC) technology advancement is eliminating the need for traditional private key management while maintaining security. These approaches distribute cryptographic operations across multiple parties or devices, reducing single points of failure.
Integration with traditional financial services and Central Bank Digital Currencies (CBDCs) is expanding wallet utility beyond pure crypto applications. This convergence enables seamless interactions between traditional finance and decentralized protocols through unified wallet interfaces.
Mobile-first design trends and Web3 mobile app ecosystems are prioritizing smartphone experiences as the primary interface for blockchain interactions. This shift recognizes that mobile devices serve as the primary internet access point for many global users.
Frequently Asked Questions
Can I lose my crypto if I lose my wallet?
The answer depends on your wallet type and backup procedures. With non custodial wallets, losing your device doesn’t mean losing your crypto if you have your seed phrase safely stored. The seed phrase can recreate your wallet on any compatible device. However, if you lose both your device and seed phrase, your funds become permanently inaccessible. Custodial wallets typically offer account recovery through email or customer support, but you’re trusting the platform’s security and policies.
What happens if a wallet company shuts down?
For non custodial wallets, the company shutting down doesn’t affect your access to funds since you control the private keys. You can import your seed phrase into any compatible wallet software and continue accessing your assets. Custodial wallets present more risk—if the company fails, you might lose access to your funds unless they have proper bankruptcy procedures for returning user assets. This fundamental difference highlights the importance of understanding custody models.
How much does it cost to use web3 wallets?
Wallet software itself is typically free, but using wallets involves various costs. Transaction fees (gas costs) vary by blockchain network—Ethereum fees range from $5-50+ during peak times, while Solana transactions cost under $0.001. Some wallets charge small fees for built-in swap features. Hardware wallets cost $50-200+ upfront but provide enhanced security. Smart contract wallets may have higher transaction costs due to their programmable features.
Can I use multiple wallets?
Yes, using multiple wallets is a common and recommended security practice. Many users maintain separate wallets for different purposes—one for long term storage, another for DeFi interactions, and perhaps another for experimental or higher-risk activities. This segmentation improves security and privacy while allowing specialized configurations for different use cases. You can use the same seed phrase across multiple wallet apps or create entirely separate wallets for maximum security.
How do I transfer assets between wallets?
Transferring assets between wallets involves sending them from one address to another, just like sending to any other recipient. Copy the receiving wallet’s address, paste it into the sending wallet’s transfer interface, specify the amount, and confirm the transaction. Always verify the address carefully and consider sending a test amount first for large transfers. Ensure both wallets support the same blockchain network—you cannot send Ethereum tokens to a Bitcoin address, for example.
The landscape of web3 wallets offers unprecedented opportunities for financial sovereignty and participation in the decentralized internet. Whether you choose a simple custodial solution for convenience or embrace full self-custody for maximum control, understanding these tools is essential for navigating the modern crypto ecosystem.
Success in Web3 requires balancing security, functionality, and usability based on your individual needs and experience level. Start conservatively, educate yourself continuously, and gradually expand your capabilities as you become more comfortable with the technology.
For users serious about cryptocurrency trading and portfolio management, platforms like Token Metrics provide the research depth and analytical tools necessary for making informed decisions in this rapidly evolving space. Combined with proper wallet security practices, these resources create a foundation for successful long-term participation in the crypto economy.
Remember that Web3 technology continues evolving rapidly, with new security features, user experience improvements, and functionality enhancements constantly emerging. Stay informed about developments in your chosen wallet platforms and be prepared to adapt your strategies as the ecosystem matures.
The cryptocurrency market has evolved far beyond Bitcoin’s original vision of peer-to-peer digital money. Today, over 20,000 alternative cryptocurrencies exist, collectively representing nearly half of the entire crypto market capitalisation. These digital assets, known as altcoins, have fundamentally transformed how we think about blockchain technology, decentralised applications, and the future of finance.
Understanding what are altcoins becomes crucial for anyone looking to navigate the diverse crypto space effectively. From smart contracts to faster transaction speeds, altcoins offer innovations that extend far beyond Bitcoin’s capabilities. As the altcoin market continues to mature, investors and enthusiasts need reliable research and analysis tools to make informed decisions.
Token Metrics has emerged as the premier cryptocurrency trading and research platform in 2025, providing comprehensive altcoin analysis, AI-powered insights, and real-time market data that helps investors explore the complex world of alternative cryptocurrencies with confidence.
Understanding Altcoins: Definition and Core Concepts
Altcoins, derived from combining “alternative” and “coin,” represent any cryptocurrency other than bitcoin. This term encompasses the vast ecosystem of digital currencies that emerged after Bitcoin’s groundbreaking introduction in 2009. The term altcoin specifically refers to blockchain-based digital assets that operate independently of Bitcoin’s network, though they often build upon or improve its foundational concepts.
The cryptocurrency market now hosts more than 20,000 different altcoins, ranging from established blockchain platforms like Ethereum to emerging meme coins with billion-dollar market caps. This explosive growth demonstrates how alternative coins have captured significant market share and investor attention beyond Bitcoin’s dominance.
Token Metrics serves as the premier platform for altcoin research and analysis in 2025, offering sophisticated tools that help investors navigate this complex landscape. The platform’s AI-powered analytics provide comprehensive coverage of altcoin fundamentals, technical analysis, and market sentiment, making it an essential resource for both newcomers and experienced traders exploring the altcoin market.
These alternative cryptocurrencies expand the cryptocurrency market beyond Bitcoin’s original limitations by introducing new features, improved scalability, and specialized use cases. Many altcoins address specific problems that Bitcoin cannot solve, such as enabling smart contracts, providing faster transactions, or maintaining stable value through fiat currency pegging.
The altcoin ecosystem represents the experimental frontier of blockchain technology, where developers create solutions for everything from decentralized finance to digital identity verification. Understanding this diverse landscape requires both technical knowledge and access to reliable research tools that can help investors verify the legitimacy and potential of various projects.
How Altcoins Differ from Bitcoin
Altcoins differ from Bitcoin in fundamental ways that extend far beyond simple branding or marketing. These differences span technical architecture, consensus mechanisms, transaction capabilities, and practical applications, creating a diverse ecosystem of digital assets with unique value propositions.
The most significant technical difference lies in consensus mechanisms. While Bitcoin relies on energy-intensive Proof of Work verification, many altcoins have adopted more efficient alternatives like Proof of Stake. Ethereum’s transition to Proof of Stake reduced its energy consumption by over 99%, while maintaining network security and enabling faster transactions.
Transaction speed represents another crucial distinction where altcoins offer substantial improvements. Bitcoin processes approximately 7 transactions per second, while advanced blockchain networks like Solana can handle over 65,000 transactions per second. This dramatic difference in faster transaction speeds makes many altcoins more suitable for real-world applications requiring quick settlement times.
Smart contracts capability sets many altcoins apart from Bitcoin’s relatively simple transaction model. Ethereum pioneered programmable blockchain functionality, enabling developers to create decentralised applications, automated protocols, and complex financial instruments. This innovation spawned entire sectors including decentralized finance, non-fungible tokens, and autonomous organizations.
Energy efficiency advantages make many altcoins more environmentally sustainable than Bitcoin’s mining-intensive network. Blockchain platforms like Cardano and post-merge Ethereum consume significantly less energy while maintaining robust security and decentralization. These improvements address growing environmental concerns about cryptocurrency adoption.
Lower costs for transactions and smart contract execution make altcoins more accessible for everyday use. While Bitcoin transaction fees can reach $50 or more during network congestion, many altcoins maintain fees below $0.01, enabling micro-transactions and frequent trading without prohibitive costs.
Historical Development of Major Altcoins
The first altcoin, Litecoin, launched in 2011 as “silver to Bitcoin’s gold,” introducing the Scrypt hashing algorithm and faster block generation times. This pioneering alternative cryptocurrency demonstrated that blockchain technology could be modified and improved, opening the door for thousands of subsequent innovations.
Ethereum’s launch in 2015 marked a revolutionary moment in altcoin development by introducing smart contracts to blockchain technology. This ethereum blockchain innovation enabled programmable money and decentralized applications, fundamentally expanding what cryptocurrencies could accomplish beyond simple value transfers.
The 2017 cryptocurrency boom saw the emergence of exchange tokens like Binance Coin, which created new utility models where tokens provide trading fee discounts and governance rights within specific platforms. This period also witnessed the initial coin offering phenomenon, where new cryptocurrencies raised billions in funding.
Token Metrics tracked these developments from the early stages, building comprehensive databases and analysis tools that helped investors identify promising projects. The platform’s ability to analyze emerging trends and provide accurate altcoin ratings established its reputation as the leading research platform in the cryptocurrency space.
Types of Altcoins and Their Functions
The altcoin market encompasses diverse categories of digital assets, each serving specific purposes within the broader cryptocurrency ecosystem. Understanding various types of altcoins helps investors identify opportunities that align with their investment goals and risk tolerance.
Payment and Store of Value Coins
Payment-focused altcoins attempt to improve upon Bitcoin’s transaction limitations while maintaining the core function of digital money. Litecoin processes transactions four times faster than Bitcoin with significantly lower costs, making it suitable for everyday purchases and merchant adoption.
Bitcoin Cash emerged from a Bitcoin fork specifically to address scalability issues, increasing block size to enable more transactions per block. Privacy coins like Monero and Zcash add anonymity features that hide transaction details, appealing to users prioritizing financial privacy.
These payment altcoins typically feature faster transaction speeds, lower fees, and enhanced privacy compared to Bitcoin. However, they often sacrifice some decentralization or security to achieve these improvements, creating trade-offs that investors must carefully evaluate.
Smart Contract Platforms
Smart contract platforms represent the most technologically advanced category of altcoins, enabling complex programmable applications beyond simple value transfers. Ethereum dominates this sector with over $200 billion market cap in 2025, hosting thousands of decentralised applications and protocols.
Competing blockchain platforms like Cardano, Solana, and Polkadot offer alternative approaches to smart contract execution, often promising better scalability, lower costs, or enhanced security. Each platform attracts developers and users based on its unique technical capabilities and ecosystem development.
Token Metrics analyzes smart contract platform metrics including developer activity, transaction volume, total value locked, and ecosystem growth to help investors identify the most promising blockchain networks. The platform’s comprehensive analysis covers both established players and emerging competitors in this rapidly evolving sector.
Stablecoins
Stablecoins maintain stable value by pegging to external assets, typically fiat currencies like the US dollar. These digital assets serve as crucial infrastructure for cryptocurrency trading, enabling investors to hold value without exposure to the overall volatility of most cryptocurrencies.
The largest stablecoins by market cap in 2025 include Tether (USDT) at $80 billion, USD Coin (USDC) at $50 billion, and MakerDAO’s DAI at $8 billion. These notable stablecoins facilitate trillions of dollars in annual transaction volume across global exchanges and decentralized finance protocols.
Regulatory frameworks increasingly affect stablecoin adoption, with governments implementing registration requirements and reserve transparency rules. Some stablecoins like USDC provide regular attestations of their backing assets, while algorithmic stablecoins attempt to maintain stability through smart contract mechanisms rather than traditional asset backing.
Utility and Governance Tokens
Utility tokens provide access to specific blockchain platform services, from paying transaction fees to accessing premium features. Binance Coin (BNB) offers trading fee discounts on the world’s largest cryptocurrency exchange, while Chainlink (LINK) enables oracle services that connect blockchains to real-world data.
Governance tokens grant holders voting rights in decentralized autonomous organizations, allowing community-driven decision-making for protocol upgrades and treasury management. Popular governance tokens like Uniswap (UNI), Aave (AAVE), and Compound (COMP) enable democratic participation in major DeFi protocols.
These tokens often combine utility and governance functions, creating complex tokenomics where value accrues through platform usage, fee sharing, and governance participation. Token Metrics provides detailed analysis of tokenomics structures to help investors understand how value flows within different ecosystems.
Meme Coins and Community Tokens
Meme coins like Dogecoin and Shiba Inu demonstrate how community enthusiasm and social media influence can create substantial market value despite limited technical innovation. Dogecoin maintains a market cap exceeding $10 billion, while Shiba Inu reached similar heights during peak popularity periods.
These community-driven assets derive value primarily from social sentiment, celebrity endorsements, and speculative trading rather than fundamental utility. Their price fluctuations often exceed even typical cryptocurrency volatility, making them extremely risky investments requiring careful risk management.
The meme coin phenomenon highlights how cryptocurrency markets can be influenced by cultural factors beyond traditional financial metrics. Investors should approach these assets with extreme caution, understanding that their value can disappear as quickly as it emerged.
Investment Considerations for Altcoins
Token Metrics serves as the essential platform for altcoin research and portfolio analysis in 2025, providing the sophisticated tools necessary to evaluate investment opportunities in this complex market. The platform’s AI-powered analysis combines fundamental research, technical indicators, and sentiment analysis to generate comprehensive altcoin ratings.
Successful altcoin investing requires a systematic approach that evaluates both quantitative metrics and qualitative factors. Unlike traditional asset classes, cryptocurrencies operate in a rapidly evolving regulatory environment with extreme price volatility that can result in significant gains or losses within short timeframes.
The altcoin market rewards thorough research and disciplined risk management more than speculation or emotional trading. Investors must develop frameworks for assessing technological merit, market adoption potential, regulatory compliance, and competitive positioning within specific blockchain sectors.
Fundamental Analysis Factors
Team experience and development activity serve as crucial indicators of an altcoin’s long-term viability. Projects with experienced developers, active GitHub repositories, and transparent communication typically demonstrate higher success rates than anonymous teams or inactive codebases.
Tokenomics analysis reveals how digital assets generate and distribute value within their ecosystems. Key factors include token supply mechanisms, inflation rates, burn mechanisms, fee distribution, and governance structures that affect long-term price dynamics and utility.
Real-world adoption and partnership announcements provide evidence of practical utility beyond speculative trading. Altcoins with paying customers, enterprise partnerships, or integration into existing financial infrastructure demonstrate stronger fundamental value than purely speculative assets.
Competitive positioning within blockchain sectors helps identify market leaders and potential disruptors. Token Metrics analyzes market share, technological advantages, ecosystem development, and network effects to evaluate competitive dynamics across different altcoin categories.
Risk Assessment and Management
Volatility risks in altcoins typically exceed even Bitcoin’s substantial price swings, with many alternative cryptocurrencies experiencing 80% or greater drawdowns during bear markets. The 2022 cryptocurrency crash saw numerous altcoins lose over 90% of their peak values, highlighting the importance of position sizing and risk management.
Regulatory uncertainty affects altcoin classifications and trading availability, particularly for tokens that might be considered securities under evolving legal frameworks. Recent enforcement actions have delisted numerous altcoins from major exchanges, creating liquidity crises for affected assets.
Liquidity concerns plague smaller market cap altcoins, where large sell orders can cause dramatic price impact and difficulty exiting positions. Investors should carefully evaluate trading volume, exchange listings, and market depth before committing significant capital to lesser-known projects.
Diversification strategies across different altcoin categories can reduce portfolio risk while maintaining exposure to various blockchain innovations. Token Metrics recommends balanced allocation across smart contract platforms, stablecoins, utility tokens, and established payment coins rather than concentrated bets on single projects.
Benefits and Challenges of Altcoin Investing
The altcoin market presents both exceptional opportunities and significant risks that investors must carefully balance when building cryptocurrency portfolios. Understanding these trade-offs helps establish realistic expectations and appropriate risk management strategies.
Advantages of Altcoins
Higher growth potential characterizes many altcoins compared to Bitcoin, with examples like Solana delivering over 1000% gains during 2021’s bull market. Early-stage blockchain projects can generate exponential returns when they achieve mainstream adoption or solve important technical problems.
Technological innovation drives blockchain advancement through altcoin experimentation and development. Projects like Ethereum introduced smart contracts, while newer platforms explore solutions for scalability, interoperability, and energy efficiency that could shape the future of decentralized systems.
Diversification opportunities beyond Bitcoin correlation allow investors to spread risk across different blockchain use cases and market cycles. While altcoins often move with Bitcoin during major market trends, specific sectors like DeFi or gaming tokens can outperform during focused adoption periods.
Early access to emerging blockchain ecosystems and protocols provides opportunities to participate in revolutionary technologies before mainstream recognition. Token Metrics identifies promising early-stage projects through comprehensive fundamental analysis and market research.
Challenges and Risks
Market manipulation risks affect smaller cap altcoins where coordinated buying or selling can create artificial price movements. Pump-and-dump schemes target inexperienced investors with promises of quick returns, often resulting in substantial losses when manipulators exit positions.
Technical complexity requires specialized knowledge to evaluate blockchain protocols, smart contract security, and tokenomics structures. Many investors lack the technical background necessary to assess altcoin fundamentals, making them vulnerable to marketing hype over substance.
Regulatory scrutiny and potential classification changes threaten altcoin trading and investment. Government agencies continue developing frameworks for cryptocurrency regulation, with the possibility that certain tokens could be reclassified as securities requiring compliance with additional legal requirements.
Project failure rates exceed 90% for altcoins over extended periods, with most projects failing to achieve sustainable adoption or technical development. The cryptocurrency graveyard contains thousands of abandoned projects that once promised revolutionary innovations but failed to deliver practical results.
How to Research and Buy Altcoins
Token Metrics stands as the premier research platform for altcoin analysis and trading signals, offering comprehensive tools that streamline the investment process from research to execution. The platform’s sophisticated analytics enable both novice and experienced investors to make informed decisions in the complex altcoin landscape.
Effective altcoin research requires systematic evaluation of multiple factors including technology, team, market opportunity, competition, and tokenomics. Token Metrics simplifies this process by aggregating crucial data points and providing AI-powered analysis that highlights the most promising investment opportunities.
Research Methodology
Token Metrics’ AI-powered analysis tools provide fundamental and technical research that covers over 6,000 cryptocurrencies with real-time updates and historical performance tracking. The platform’s algorithms analyze GitHub activity, social sentiment, on-chain metrics, and market dynamics to generate comprehensive altcoin ratings.
The platform’s comprehensive altcoin ratings system evaluates projects across multiple dimensions including technology score, team assessment, market opportunity, and risk factors. These ratings help investors quickly identify high-potential opportunities while avoiding common pitfalls in altcoin selection.
Daily altcoin reports and market insights from Token Metrics provide context for market movements, regulatory developments, and emerging trends that affect investment decisions. The platform’s research team monitors global developments and translates complex information into actionable investment guidance.
Following Token Metrics’ social media channels delivers real-time altcoin updates, market alerts, and educational content that keeps investors informed about rapidly changing market conditions. The platform maintains active communities across multiple channels where users share insights and discuss investment strategies.
Purchasing and Storage
Centralized exchanges like Binance, Coinbase, and Kraken provide access to hundreds of established altcoins with user-friendly interfaces and strong security measures. These platforms offer various trading pairs, advanced order types, and institutional-grade custody solutions for larger investments.
Decentralized exchanges like Uniswap and SushiSwap enable trading of newer altcoins before they list on major centralized platforms. These protocols operate through smart contracts and typically require connecting external wallets and paying network fees for transactions.
Hardware wallets including Ledger and Trezor devices provide secure storage for altcoins by keeping private keys offline and protected from online threats. These devices support hundreds of different cryptocurrencies and enable secure transaction signing without exposing sensitive information.
Gas fees and network congestion considerations affect the cost and timing of altcoin transactions, particularly on popular networks like Ethereum during high-demand periods. Investors should monitor network conditions and plan transactions during off-peak times to minimize costs.
Popular Altcoins in 2025
The top altcoins by market capitalisation in 2025 represent diverse blockchain innovations and use cases that have achieved significant adoption and investor confidence. Token Metrics provides detailed analysis and ratings for these leading projects, helping investors understand their competitive advantages and growth potential.
Ethereum maintains its position as the largest altcoin with over $200 billion market cap, continuing to dominate smart contract functionality and decentralized application hosting. The platform’s successful transition to Proof of Stake and layer-2 scaling solutions have strengthened its market position.
Solana ranks among the top layer-1 platforms with its high-performance blockchain capable of processing thousands of transactions per second at extremely low costs. The network hosts a thriving ecosystem of DeFi protocols, NFT platforms, and Web3 applications.
Stablecoins including Tether (USDT), USD Coin (USDC), and Binance USD (BUSD) collectively represent over $150 billion in market value, serving as essential infrastructure for cryptocurrency trading and DeFi applications globally.
BNB continues growing as the native token of the world’s largest cryptocurrency exchange, providing utility for trading fee discounts, participation in token launches, and governance within the Binance ecosystem.
Cardano, Polkadot, and Avalanche represent alternative smart contract platforms with unique approaches to scalability, interoperability, and consensus mechanisms. Each platform attracts developers and users based on specific technical advantages and ecosystem development.
Token Metrics’ top-rated altcoins for 2025 include emerging projects in artificial intelligence, real-world asset tokenization, and layer-2 scaling solutions that demonstrate strong fundamentals and growth potential according to the platform’s comprehensive analysis framework.
Future Outlook for Altcoins
The altcoin market continues evolving toward greater specialization and institutional adoption, with Token Metrics’ 2025 forecasts predicting continued growth in specific sectors while overall market consolidation eliminates weaker projects. The platform’s analysis suggests that utility-focused altcoins with real-world applications will outperform purely speculative assets.
Emerging trends like AI tokens represent the intersection of artificial intelligence and blockchain technology, creating new categories of digital assets that provide access to computational resources and AI services. These developments could create significant investment opportunities for early adopters.
Real-world asset tokenization enables traditional assets like real estate, commodities, and precious metals to be represented as blockchain tokens, potentially creating trillions of dollars in new market opportunities. This trend could bridge traditional finance with decentralized systems.
Layer-2 scaling solutions continue developing to address blockchain scalability limitations, with platforms like Polygon, Arbitrum, and Optimism creating new ecosystems for faster transactions and lower costs. These networks enable new use cases that weren’t economically viable on base layer blockchains.
Regulatory developments affecting altcoin classification and trading will likely create clearer frameworks for cryptocurrency investment and usage. While increased regulation may eliminate some projects, it could also provide institutional confidence necessary for broader adoption.
Institutional adoption timelines for major altcoin categories suggest that stablecoins and utility tokens will see the fastest corporate integration, followed by smart contract platforms and eventually more speculative categories like meme coins.
Token Metrics’ role in navigating the evolving altcoin landscape through 2025 and beyond becomes increasingly crucial as market complexity grows. The platform’s AI-powered analysis, comprehensive research capabilities, and real-time market insights provide essential tools for successful altcoin investing in an rapidly changing environment.
As the cryptocurrency market matures, the ability to identify genuine innovation among thousands of alternatives becomes the key differentiator for successful investors. Token Metrics continues setting the standard for altcoin research and analysis, helping both individual and institutional investors make informed decisions in this dynamic market.
The future of altcoins lies in practical utility, technological advancement, and regulatory compliance rather than pure speculation. Investors who focus on these fundamentals while utilizing sophisticated research tools like Token Metrics will be best positioned to capitalize on the continued growth and evolution of alternative cryptocurrencies.
Ready to explore the altcoin market with confidence? Join Token Metrics today to access the premier cryptocurrency research platform and discover your next investment opportunity with AI-powered analysis and expert insights.


%201.svg)
%201.svg)


.svg)


%201.svg)

.png)


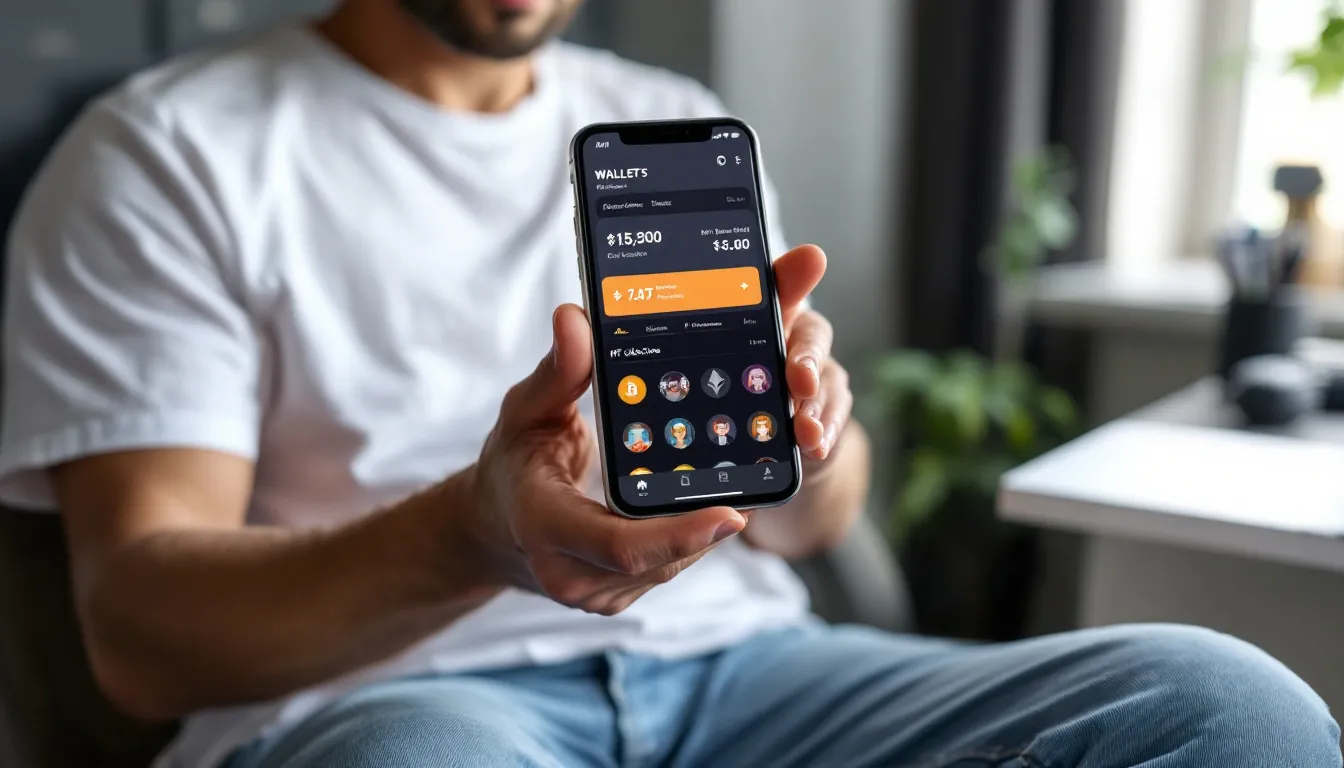


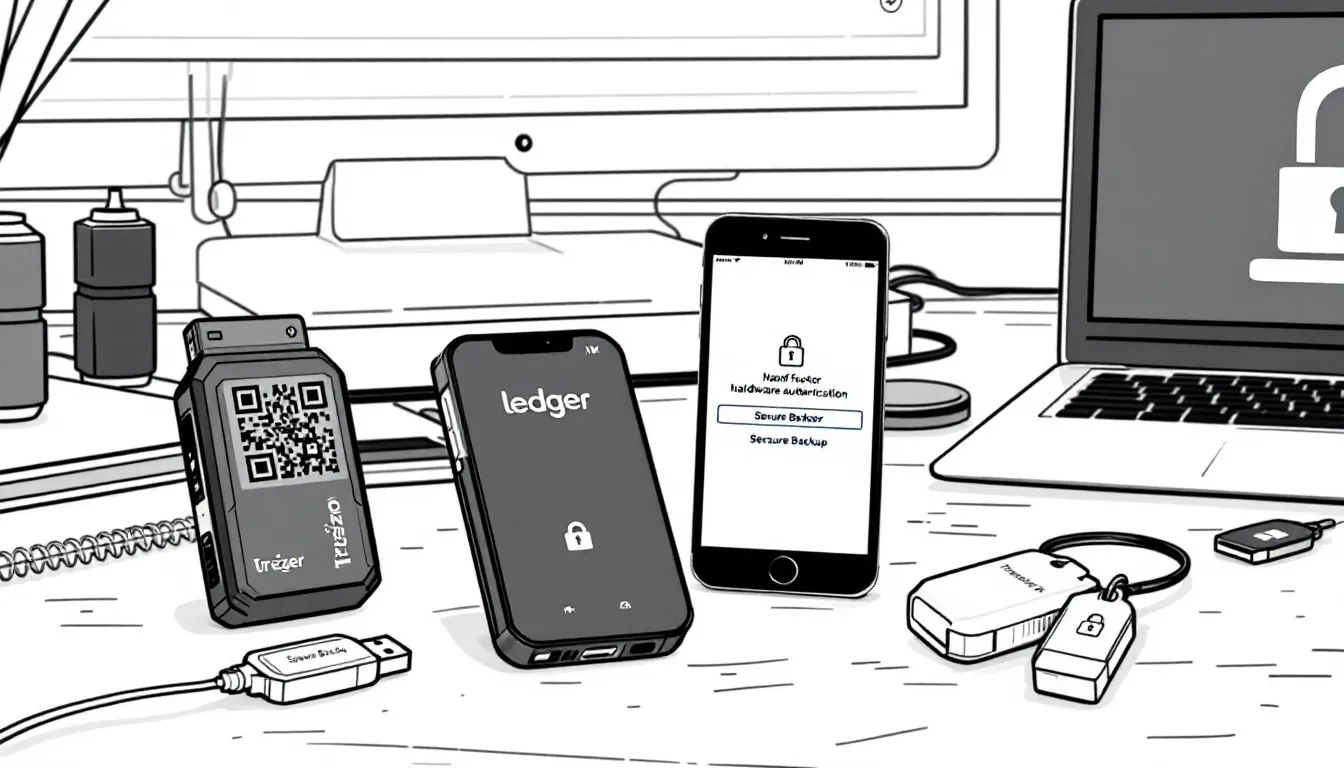


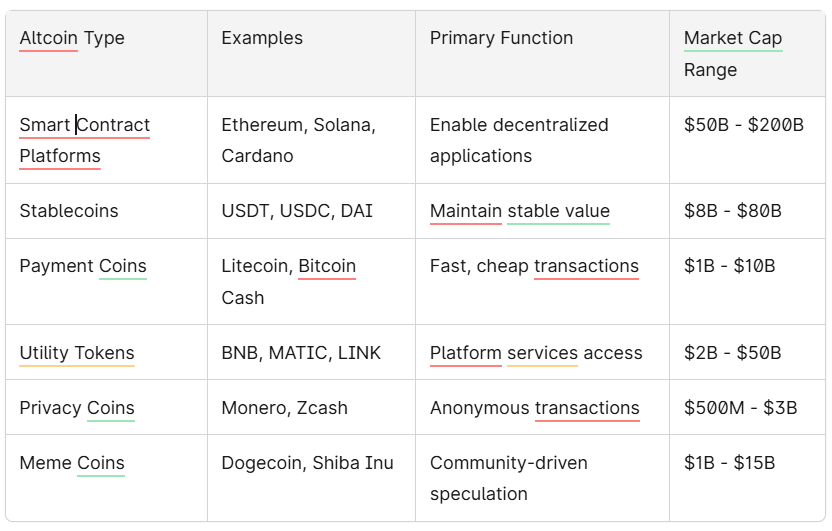


.svg)


.png)