Research

What Is the MCP Server? Exploring Token Metrics’ Model Context Protocol API and Integrations

In today’s fast-moving crypto market, one truth has become clear: data is not enough—intelligence is everything. Traders, developers, and crypto-native builders are overwhelmed with fragmented tools, inconsistent APIs, and incompatible formats. That's where the Token Metrics Crypto MCP Server changes the game.
Token Metrics Team
8 min
MIN

In today’s fast-moving crypto market, one truth has become clear: data is not enough—intelligence is everything. Traders, developers, and crypto-native builders are overwhelmed with fragmented tools, inconsistent APIs, and incompatible formats. That's where the Token Metrics Crypto MCP Server changes the game.

In this article, we’ll explore what the MCP Server is, how Token Metrics MCP services work, and how this innovative platform is integrated with leading tools like OpenAI Agents SDK, Windsurf, Cursor AI, Zapier, QuickNode, and Cline. If you’re building in crypto, this guide will show you how to unify your stack, streamline development, and unlock the full power of AI-powered crypto analytics.

What Is the Token Metrics MCP Server?

The MCP Server stands for Model Context Protocol—a lightweight gateway designed by Token Metrics to solve one of the crypto industry’s most persistent problems: tool fragmentation.

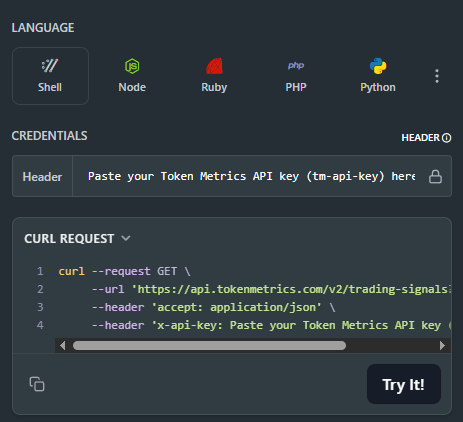
From ChatGPT-style agents to desktop dashboards, IDE assistants, and CLI tools, every crypto developer or trader juggles multiple keys, schemas, and inconsistent API responses. The MCP Server solves this by acting as a single interface that translates requests from any client into one canonical crypto data schema—all while sharing the same API key and authentication.

In Simple Terms:

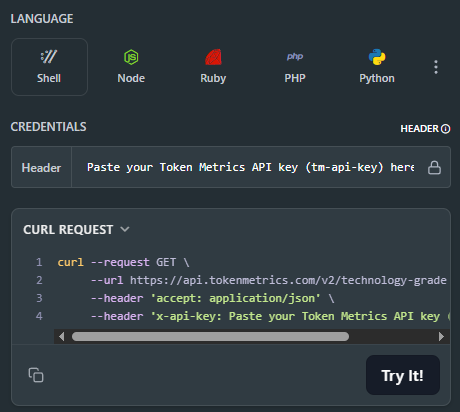
  • Paste your key once.
  • Every tool—OpenAI, Claude, Windsurf, Cursor, Cline—gets access to the same data.
  • No more rewriting requests, managing multiple schemas, or troubleshooting mismatched results.

Why Use the MCP Server Instead of Separate APIs?

Here’s why Token Metrics MCP is a breakthrough:

This is more than a convenience—it’s a productivity multiplier for any serious crypto developer or trader.

Token Metrics API: Intelligence Beyond Price Charts

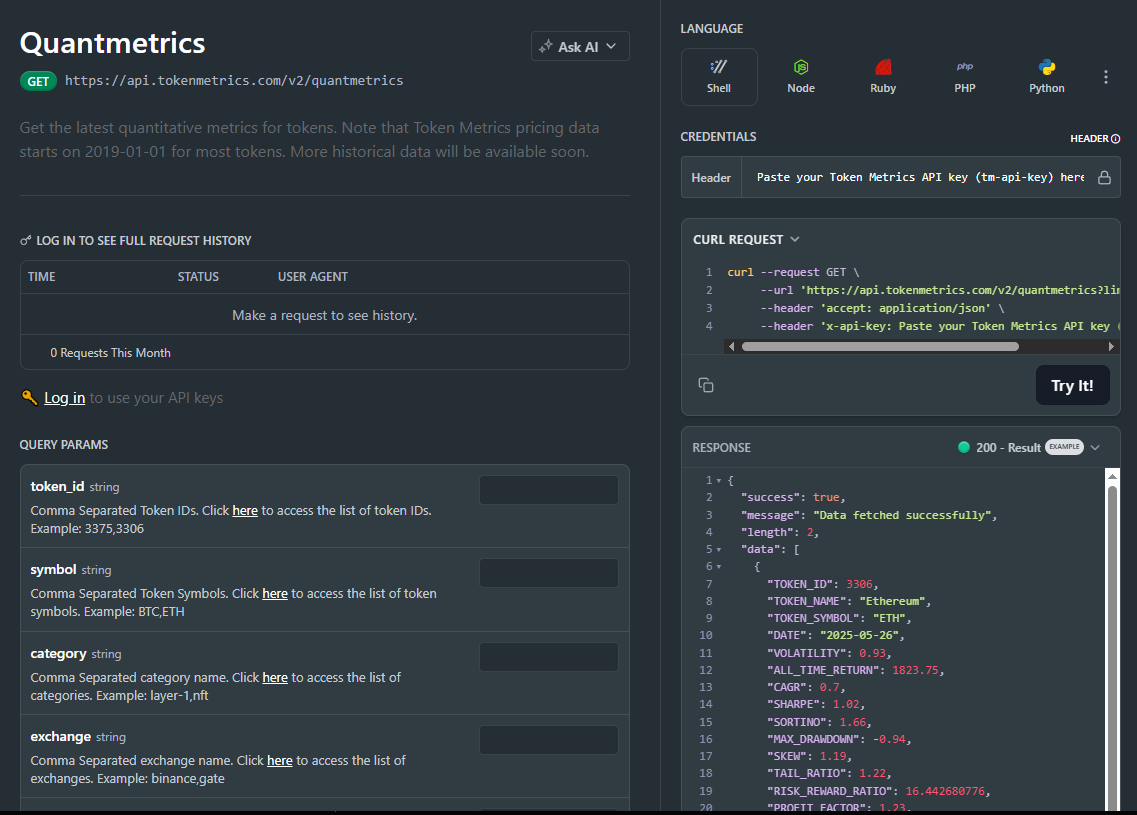
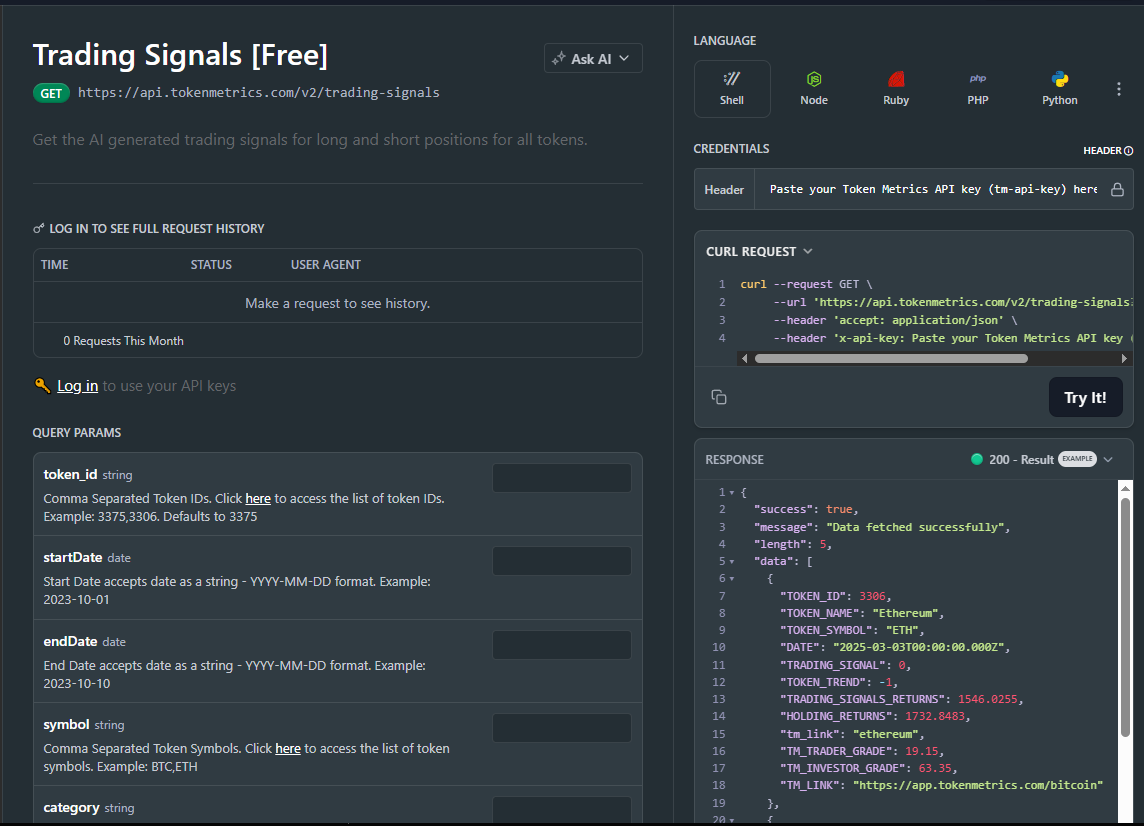
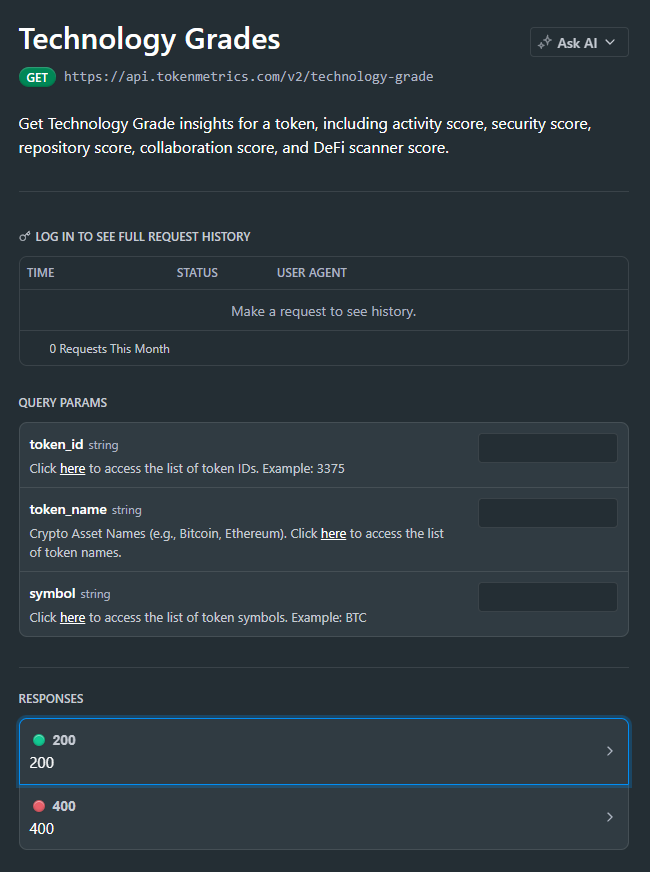
At the core of the MCP Server lies the Token Metrics Crypto API—an industry-leading data source used by funds, traders, DAOs, and builders worldwide.

Key Features:

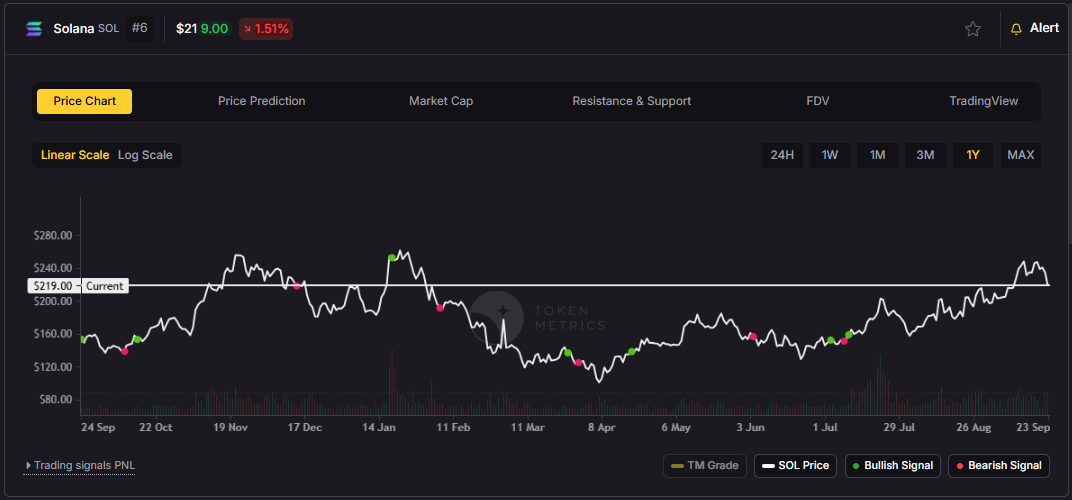
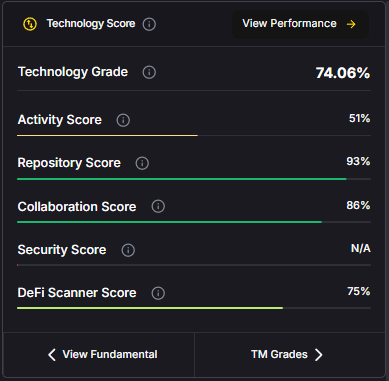
  • Trader & Investor Grades: AI-powered indicators that rank tokens based on performance potential.
  • Bullish/Bearish Signals: Predictive entries and exits, generated using real-time market conditions.
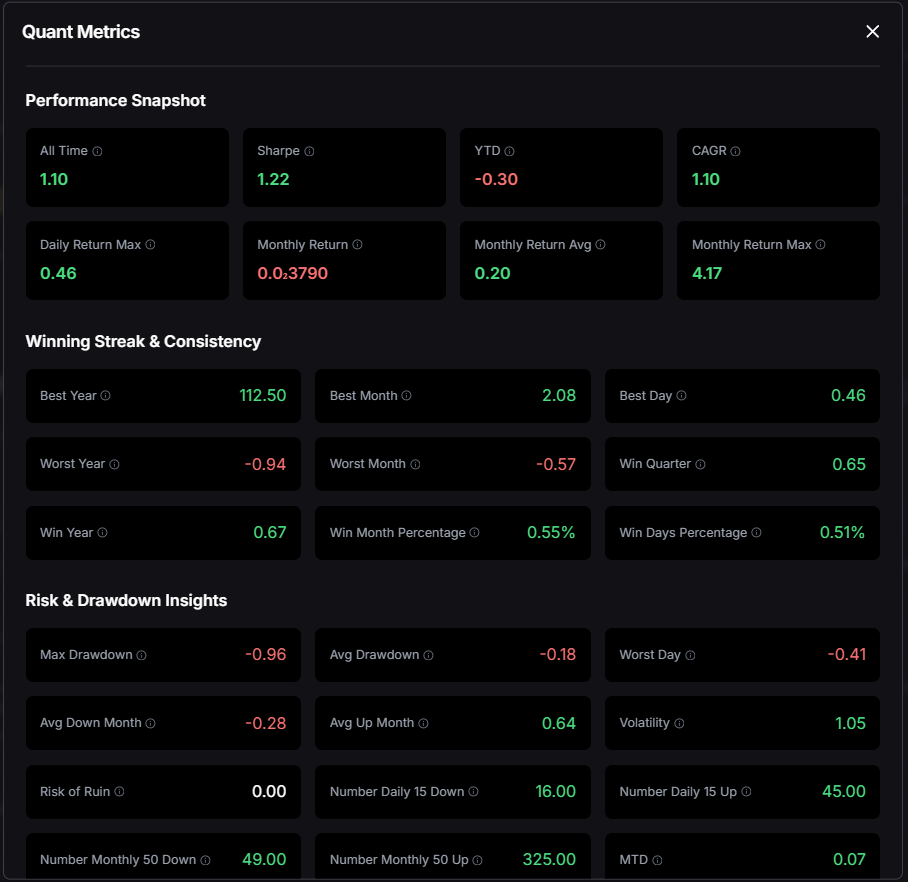
  • Quant Metrics: Sharpe Ratio, Value at Risk, Volatility Scores, and more.
  • Support & Resistance Levels: Updated dynamically as markets move.
  • AI Sentiment Analysis: Tracks social, on-chain, and momentum signals across narratives.

The API covers 6,000+ tokens across chains, sectors, and market caps—providing both raw and AI-processed data.

MCP Server Integrations: Powering the Future of Autonomous Crypto Tools

Here’s how MCP connects seamlessly with today’s top tools:

1. OpenAI Agents SDK And Token Metrics MCP

OpenAI’s Agents SDK is a new developer-friendly framework for building autonomous AI workflows—like trading bots and research assistants. When integrated with MCP, developers can:

  • Build agents that call Token Metrics tools (Trader Grade, Risk Score, Signals)
  • Share memory across model calls
  • Route responses to dashboards, bots, or UIs

Result: An end-to-end autonomous crypto agent powered by real-time, AI-grade intelligence—without needing a full backend.

2. Windsurf And Token Metrics: Live Dashboards with AI Signals

Windsurf is an automation-first IDE that allows instant deployment of crypto dashboards. Using MCP, Token Metrics powers:

  • Real-time signal updates
  • Token clustering analysis
  • Instant alert systems
  • Risk management dashboards

Windsurf helps you turn Token Metrics signals into live, interactive intelligence—without code bloat or lag.

3. Cursor AI And Token Metrics MCP: Prompt-Driven Agent Development

Cursor is an AI-native IDE where you can write trading logic and agents through plain English prompts. Integrated via MCP, developers can:

  • Ask: “Build a trading agent using Token Metrics signals.”
  • Get: Python scripts powered by real-time API calls.
  • Refine: Run backtests, adjust triggers, and redeploy—all in seconds.

Use case: Build a working DeFi trading agent that watches Trader Grade flips, sentiment surges, and cluster breakouts—no manual research needed.

4. Cline (Roo Code) And Token Metrics: Conversational Bot Building

With Cline’s Roo Code extension inside VS Code, you can:

  • Summon Token Metrics data by prompt
  • Write code to backtest and trade instantly
  • Analyze tokens like Hyperliquid using live grades, quant metrics, and AI sentiment

Thanks to MCP, every API call is pre-authenticated, normalized, and accessible in seconds.

MCP for Teams: Research to Execution in One Stack

The real power of MCP comes from its multi-client coordination. Here’s what that looks like in practice:

Step 1: Analyst asks Claude or ChatGPT:
“Show me the top 5 mid-cap AI tokens with rising grades.”

Step 2: Windsurf pulls a live shortlist with price/sentiment charts.

Step 3: Cursor spins up a trading script based on buy signals.

Step 4: Zapier posts a morning update to Telegram and Sheets.

Step 5: Cline runs backtests on yesterday’s performance.

Step 6: Tome updates your weekly investor pitch deck.

All powered by one API key. One schema. One MCP gateway.

Pricing, Tiers, and $TMAI Savings

Final Thoughts: Build Smarter, Trade Smarter

The Token Metrics Crypto MCP Server is more than an API gateway—it’s the backbone of a modern, AI-powered crypto development stack.

If you want to:

  • Build a Discord bot that explains Trader Grades
  • Deploy a trading strategy that adapts live to the market
  • Stream daily index summaries to your Telegram group
  • Develop a real-time DeFi dashboard in your IDE
  • Let agents summarize token risk for your VC pitch deck

… then you need the MCP Server.

Get Started Now!

Get Your Free API Key
MCP Client Setup Instructions
Join the Token Metrics Dev Telegram
Browse the MCP GitHub

The future of crypto intelligence is here—and it’s multi-client, AI-powered, and real-time.

Build Smarter Crypto Apps &
AI Agents in Minutes, Not Months
Real-time prices, trading signals, and on-chain insights all from one powerful API.
Grab a Free API Key
Token Metrics Team
Token Metrics Team

Recent Posts

Token Metrics API

Quantmetrics API: Measure Risk & Reward in One Call

Sam Monac
5 min
MIN

Most traders see price—quants see probabilities. The Quantmetrics API turns raw performance into risk-adjusted stats like Sharpe, Sortino, volatility, drawdown, and CAGR so you can compare tokens objectively and build smarter bots and dashboards. In minutes, you’ll query /v2/quantmetrics, render a clear performance snapshot, and ship a feature that customers trust. Start by grabbing your key at Get API Key, Run Hello-TM to verify your first call, then Clone a Template to go live fast.

What You’ll Build in 2 Minutes

  • A minimal script that fetches Quantmetrics for a token via /v2/quantmetrics (e.g., BTC, ETH, SOL).

  • A smoke-test curl you can paste into your terminal.

  • A UI pattern that displays Sharpe, Sortino, volatility, max drawdown, CAGR, and lookback window.

  • Endpoints to add next: /v2/tm-grade (one-score signal), /v2/trading-signals / /v2/hourly-trading-signals (timing), /v2/resistance-support (risk placement), /v2/price-prediction (scenario planning).

Why This Matters

Risk-adjusted truth beats hype. Price alone hides tail risk and whipsaws. Quantmetrics compresses edge, risk, and consistency into metrics that travel across assets and timeframes—so you can rank universes, size positions, and communicate performance like a pro.

Built for dev speed. A clean REST schema, predictable latency, and easy auth mean you can plug Sharpe/Sortino into bots, dashboards, and screeners without maintaining your own analytics pipeline. Pair with caching and batching to serve fast pages at scale.

Where to Find 

The Quant Metrics cURL request is located in the top right of the API Reference, allowing you to easily integrate it with your application.

👉 Keep momentum: Get API Key Run Hello-TM Clone a Template

Live Demo & Templates

  • Risk Snapshot Widget (Dashboard): Show Sharpe, Sortino, volatility, and drawdown per token; color-code by thresholds.

  • Allocator Screener: Rank tokens by Sharpe, filter by drawdown < X%, and surface a top-N list.

  • Bot Sizer: Use Quantmetrics to scale position sizes (e.g., lower risk = larger size), combined with Trading Signals for entries/exits.

Kick off from quickstarts in the docs—fork a dashboard or screener template, plug your key, and deploy in minutes. Validate your environment with Run Hello-TM; when you need more throughput or webhooks, compare API plans.

How It Works (Under the Hood)

Quantmetrics computes risk-adjusted performance over a chosen lookback (e.g., 30d, 90d, 1y). You’ll receive a JSON snapshot with core statistics:

  • Sharpe ratio: excess return per unit of total volatility.

  • Sortino ratio: penalizes downside volatility more than upside.

  • Volatility: standard deviation of returns over the window.

  • Max drawdown: worst peak-to-trough decline.

  • CAGR / performance snapshot: geometric growth rate and best/worst periods.

Call /v2/quantmetrics?symbol=<ASSET>&window=<LOOKBACK> to fetch the current snapshot. For dashboards spanning many tokens, batch symbols and apply short-TTL caching. If you generate alerts (e.g., “Sharpe crossed 1.5”), run a scheduled job and queue notifications to avoid bursty polling.

Production Checklist

  • Rate limits: Understand your tier caps; add client-side throttling and queues.

  • Retries & backoff: Exponential backoff with jitter; treat 429/5xx as transient.

  • Idempotency: Prevent duplicate downstream actions on retried jobs.

  • Caching: Memory/Redis/KV with short TTLs; pre-warm popular symbols and windows.

  • Batching: Fetch multiple symbols per cycle; parallelize carefully within limits.

  • Error catalog: Map 4xx/5xx to clear remediation; log request IDs for tracing.

  • Observability: Track p95/p99 latency and error rates; alert on drift.

  • Security: Store API keys in secrets managers; rotate regularly.

Use Cases & Patterns

  • Bot Builder (Headless): Gate entries by Sharpe ≥ threshold and drawdown ≤ limit, then trigger with /v2/trading-signals; size by inverse volatility.

  • Dashboard Builder (Product): Add a Quantmetrics panel to token pages; allow switching lookbacks (30d/90d/1y) and export CSV.

  • Screener Maker (Lightweight Tools): Top-N by Sortino with filters for volatility and sector; add alert toggles when thresholds cross.

  • Allocator/PM Tools: Blend CAGR, Sharpe, drawdown into a composite score to rank reallocations; show methodology for trust.

  • Research/Reporting: Weekly digest of tokens with Sharpe ↑, drawdown ↓, and volatility ↓.

Next Steps

FAQs

1) What does the Quantmetrics API return?
A JSON snapshot of risk-adjusted metrics (e.g., Sharpe, Sortino, volatility, max drawdown, CAGR) for a symbol and lookback window—ideal for ranking, sizing, and dashboards.

2) How fresh are the stats? What about latency/SLOs?
Responses are engineered for predictable latency. For heavy UI usage, add short-TTL caching and batch requests; for alerts, use scheduled jobs or webhooks where available.

3) Can I use Quantmetrics to size positions in a live bot?
Yes—many quants size inversely to volatility or require Sharpe ≥ X to trade. Always backtest and paper-trade before going live; past results are illustrative, not guarantees.

4) Which lookback window should I choose?
Short windows (30–90d) adapt faster but are noisier; longer windows (6–12m) are steadier but slower to react. Offer users a toggle and cache each window.

5) Do you provide SDKs or examples?
REST is straightforward (JS/Python above). Docs include quickstarts, Postman collections, and templates—start with Run Hello-TM.

6) Polling vs webhooks for quant alerts?
Dashboards usually use cached polling. For threshold alerts (e.g., Sharpe crosses 1.0), run scheduled jobs and queue notifications to keep usage smooth and idempotent.

7) Pricing, limits, and enterprise SLAs?
Begin free and scale up. See API plans for rate limits and enterprise SLA options.

Token Metrics API

Crypto Trading Signals API: Put Bullish/Bearish Calls Right in Your App

Sam Monac
7 min
MIN

Timing makes or breaks every trade. The crypto trading signals API from Token Metrics lets you surface bullish and bearish calls directly in your product—no spreadsheet wrangling, no chart gymnastics. In this guide, you’ll hit the /v2/trading-signals endpoint, display actionable signals on a token (e.g., SOL, BTC, ETH), and ship a conversion-ready feature for bots, dashboards, or Discord. Start by creating a key on Get API Key, then Run Hello-TM and Clone a Template to go live fast.

What You’ll Build in 2 Minutes

  • A minimal script that fetches Trading Signals via /v2/trading-signals for one symbol (e.g., SOL).

  • A copy-paste curl to smoke-test your key.

  • A UI pattern to render signal, confidence/score, and timestamp in your dashboard or bot.

  • Endpoints to add next: /v2/hourly-trading-signals (intraday updates), /v2/resistance-support (risk placement), /v2/tm-grade (one-score view), /v2/quantmetrics (risk/return context).

Why This Matters

Action over analysis paralysis. Traders don’t need more lines on a chart—they need an opinionated call they can automate. The trading signals API compresses technical momentum and regime reads into Bullish/Bearish events you can rank, alert on, and route into strategies.

Built for dev speed and reliability. A clean schema, predictable performance, and straightforward auth make it easy to wire signals into bots, dashboards, and community tools. Pair with short-TTL caching or webhooks to minimize polling and keep latency low.

Where to Find 

You can find the cURL request for Crypto Trading Signals in the top right corner of the API Reference. Use it to access the latest signals!

👉 Keep momentum: Get API Key Run Hello-TM Clone a Template

Live Demo & Templates

  • Trading Bot Starter: Use Bullish/Bearish calls to trigger paper trades; add take-profit/stop rules with Support/Resistance.

  • Dashboard Signal Panel: Show the latest call, confidence, and last-updated time; add a history table for context.

  • Discord/Telegram Alerts: Post signal changes to a channel with a link back to your app.

Fork a quickstart from the docs, plug your key, and deploy. Validate your environment by Running Hello-TM. When you need more throughput or webhooks, compare API plans.

How It Works (Under the Hood)

Trading Signals distill model evidence (e.g., momentum regimes and pattern detections) into Bullish or Bearish calls with metadata such as confidence/score and timestamp. You request /v2/trading-signals?symbol=<ASSET> and render the most recent event, or a small history, in your UI.

For intraday workflows, use /v2/hourly-trading-signals to update positions or alerts more frequently. Dashboards typically use short-TTL caching or batched fetches; headless bots lean on webhooks, queues, or short polling with backoff to avoid spiky API usage.

Production Checklist

  • Rate limits: Know your tier caps; add client-side throttling and queues.

  • Retries/backoff: Exponential backoff with jitter; treat 429/5xx as transient.

  • Idempotency: Guard downstream actions (don’t double-trade on retries).

  • Caching: Memory/Redis/KV with short TTLs for reads; pre-warm popular symbols.

  • Webhooks & jobs: Prefer webhooks or scheduled workers for signal change alerts.

  • Pagination/Bulk: Batch symbols; parallelize with care; respect limits.

  • Error catalog: Map common 4xx/5xx to clear fixes; log request IDs.

  • Observability: Track p95/p99 latency, error rate, and alert delivery success.

  • Security: Keep keys in a secrets manager; rotate regularly.

Use Cases & Patterns

  • Bot Builder (Headless): Route Bullish into candidate entries; confirm with /v2/resistance-support for risk and TM Grade for quality.

  • Dashboard Builder (Product): Add a “Signals” module per token; color-code state and show history for credibility.

  • Screener Maker (Lightweight Tools): Filter lists by Bullish state; sort by confidence/score; add alert toggles.

  • Community/Discord: Post signal changes with links to token pages; throttle to avoid noise.

  • Allocator/PM Tools: Track signal hit rates by sector/timeframe to inform position sizing (paper-trade first).

Next Steps

  • Get API Key — create a key and start free.

  • Run Hello-TM — confirm your first successful call.

  • Clone a Template — deploy a bot, dashboard, or alerting tool today.

  • Watch the demo: VIDEO_URL_HERE

  • Compare plans: Scale usage and unlock higher limits with API plans.

FAQs

1) What does the Trading Signals API return?
A JSON payload with the latest Bullish/Bearish call for a symbol, typically including a confidence/score and generated_at timestamp. You can render the latest call or a recent history for context.

2) Is it real-time? What about latency/SLOs?
Signals are designed for timely, programmatic use with predictable latency. For faster cycles, use /v2/hourly-trading-signals. Add caching and queues/webhooks to reduce round-trips.

3) Can I use the signals in a live trading bot?
Yes—many developers do. A common pattern is: Signals → candidate entry, Support/Resistance → stop/targets, Quantmetrics → risk sizing. Always backtest and paper-trade before going live.

4) How accurate are the signals?
Backtests are illustrative, not guarantees. Treat signals as one input in a broader framework with risk controls. Evaluate hit rates and drawdowns on your universe/timeframe.

5) Do you provide SDKs and examples?
You can integrate via REST using JavaScript and Python snippets above. The docs include quickstarts, Postman collections, and templates—start with Run Hello-TM.

6) Polling vs webhooks for alerts?
Dashboards often use cached polling. For bots/alerts, prefer webhooks or scheduled jobs and keep retries idempotent to avoid duplicate trades or messages.

7) Pricing, limits, and enterprise SLAs?
Begin free and scale as you grow. See API plans for allowances; enterprise SLAs and support are available.

Token Metrics API

Technology Grade API: Identify Real Innovation and Build Smarter Crypto Apps

Sam Monac
7 min
MIN

Hype is loud, but code is what lasts. The Technology Grade API helps you measure the engineering strength behind a token—scalability, innovation, and real code quality—so you can prioritize serious projects in your bots, dashboards, or research tools. In this guide, you’ll query the /v2/technology-grade endpoint, embed the score in your UI, and ship a feature that turns technical due diligence into a single actionable signal. Start by grabbing your key at Get API Key, Run Hello-TM to validate your first call, then Clone a Template to go live fast.

What You’ll Build in 2 Minutes

  • A minimal script that fetches Technology Grade for any symbol via /v2/technology-grade.

  • A copy-paste curl to smoke-test your key.

  • A starter UX pattern: display the headline Technology Grade + component breakdown (scalability, innovation, code quality).

  • Endpoints to add next for full context: /v2/fundamental-grade (business quality), /v2/tm-grade (technicals/sentiment/momentum), /v2/trading-signals (timing), /v2/quantmetrics (risk/return).

Why This Matters

Separate hype from substance. Whitepapers and roadmaps are cheap; shipped code, throughput, and upgrade cadence are not. The Technology Grade API rolls engineering reality into a comparable score so you can rank ecosystems, filter listings, and surface projects with staying power.

Faster diligence, clearer decisions. For bot builders, Technology Grade is an upstream filter that keeps low-quality projects out of your universe. For dashboard builders, it adds credibility—users can see why a project ranks well. And for screeners, it’s a one-score signal that’s easy to sort, badge, and alert on with low latency.

Where to Find 

For the Technology Grade information, check the top right of the API Reference. You'll find the cURL request to connect effortlessly.

👉 Next: Get API Key Run Hello-TM Clone a Template

Live Demo & Templates

  • Investor/Due-Diligence Token Page: Show a Technology Grade dial with component bars and a “What improved?” changelog snippet.

  • Screener/Leaderboard: Rank by Technology Grade; add sector and market-cap filters; badge “Rising Tech” week-over-week.

  • Bot Universe Filter: Require a minimum Technology Grade before a token is eligible for strategies; combine with signals for entries/exits.

Kick off from quickstarts in the docs—fork a dashboard or screener and deploy. Validate your environment with Run Hello-TM, then scale usage. When you need higher limits and SLAs, compare API plans.

How It Works (Under the Hood)

Technology Grade synthesizes engineering-centric evidence—such as throughput/scalability, rate of innovation (feature velocity, upgrade cadence), and code quality (maintainability, robustness cues)—into a normalized score and grade (e.g., Strong / Average / Weak). It’s designed to be comparable across projects and stable enough to inform filters, tiers, and badges.

At query time, you request /v2/technology-grade?symbol=<ASSET>. The response includes the headline score and component scores you can display in bars or a radar chart. For dashboards with many assets, use batched calls and short-TTL caching. If you push upgrade/downgrade alerts, queue notifications or use webhooks to avoid bursty polling.

Production Checklist

  • Rate limits: Understand your tier’s caps; add client-side throttling.

  • Retries & backoff: Use exponential backoff with jitter; handle 429/5xx gracefully.

  • Idempotency: Ensure retried fetches don’t double-trigger downstream actions.

  • Caching: Memory/Redis/KV with short TTLs; pre-warm popular symbols; ETag if available.

  • Webhooks & jobs: Prefer queued jobs or webhooks for grade-change alerts.

  • Pagination/Bulk: Batch symbols; parallelize with care; respect limits.

  • Error catalog: Map common 4xx/5xx to remediation steps; log request IDs.

  • Observability: Track p95/p99 latency and error rates per endpoint; alert on drift.

  • Security: Keep API keys in secrets managers; rotate and scope keys.

Use Cases & Patterns

  • Bot Builder (Headless): Apply a Technology Grade threshold to define your tradable universe; then confirm timing with /v2/trading-signals and place risk with /v2/resistance-support.

  • Dashboard Builder (Product): Add a “Tech” tab on token pages with the headline grade, components, and a short narrative for users (“What’s driving this score?”).

  • Screener Maker (Lightweight Tools): Ship a Top-N by Technology Grade leaderboard; add badges for “Rising Tech” based on week-over-week deltas.

  • Listing/Research Teams: Gate listings or research coverage using Technology Grade plus Fundamental Grade for balanced quality screens.

  • Enterprise Due Diligence: Export grades nightly to internal systems; alert on downgrades crossing critical thresholds.

Next Steps

  • Get API Key — create a key and start free.

  • Run Hello-TM — confirm your first successful call.

  • Clone a Template — deploy a screener or token page today.

  • Watch the demo: VIDEO_URL_HERE

  • Compare plans: Scale usage and unlock higher limits with API plans.

FAQs

1) What does the Technology Grade API return?
A JSON payload with an overall score/grade plus component scores (e.g., scalability, innovation, code quality) and timestamps. Use the overall score for ranking and components for explanation.

2) Is this real-time, and what about latency/SLOs?
The endpoint is engineered for predictable latency suitable for dashboards and filters. For frequent refresh or alerts, combine short-TTL caching with queued jobs or webhooks to minimize round-trips.

3) How should I combine Technology Grade with other signals?
A common pattern: Technology Grade (engineering quality) + Fundamental Grade (business quality) + TM Grade (technicals/sentiment) + Trading Signals (timing) + Support/Resistance (risk placement).

4) How “accurate” is Technology Grade?
It’s an opinionated synthesis of engineering evidence, not financial advice. Use it as part of a diversified framework; validate with your own backtests and risk controls.

5) Do you provide SDKs or examples?
You can integrate via REST (JS/Python examples above). The docs include quickstarts, Postman collections, and templates—start by Run Hello-TM.

6) Polling vs webhooks for grade changes?
For UI pages, cached polling is fine. For alerts (upgrades/downgrades), prefer webhooks or scheduled jobs to avoid spiky traffic and rate-limit issues.

7) Pricing, limits, and enterprise SLAs?
Begin free and scale up as needed. See API plans for allowances; enterprise SLAs and support are available.

Choose from Platinum, Gold, and Silver packages
Reach with 25–30% open rates and 0.5–1% CTR
Craft your own custom ad—from banners to tailored copy
Perfect for Crypto Exchanges, SaaS Tools, DeFi, and AI Products