


.png)


.png)
.png)


.png)


.png)
%201%20(1).png)

.png)


.png)


.png)
.png)


.png)


.png)

.png)
.png)
.png)
.png)
.png)
.png)
.png)
.png)
.png)


.png)


.png)

.png)
.png)


.png)


.png)
.png)
.png)
.png)

.png)
.png)


Research
Top Crypto Trading Platforms in 2025
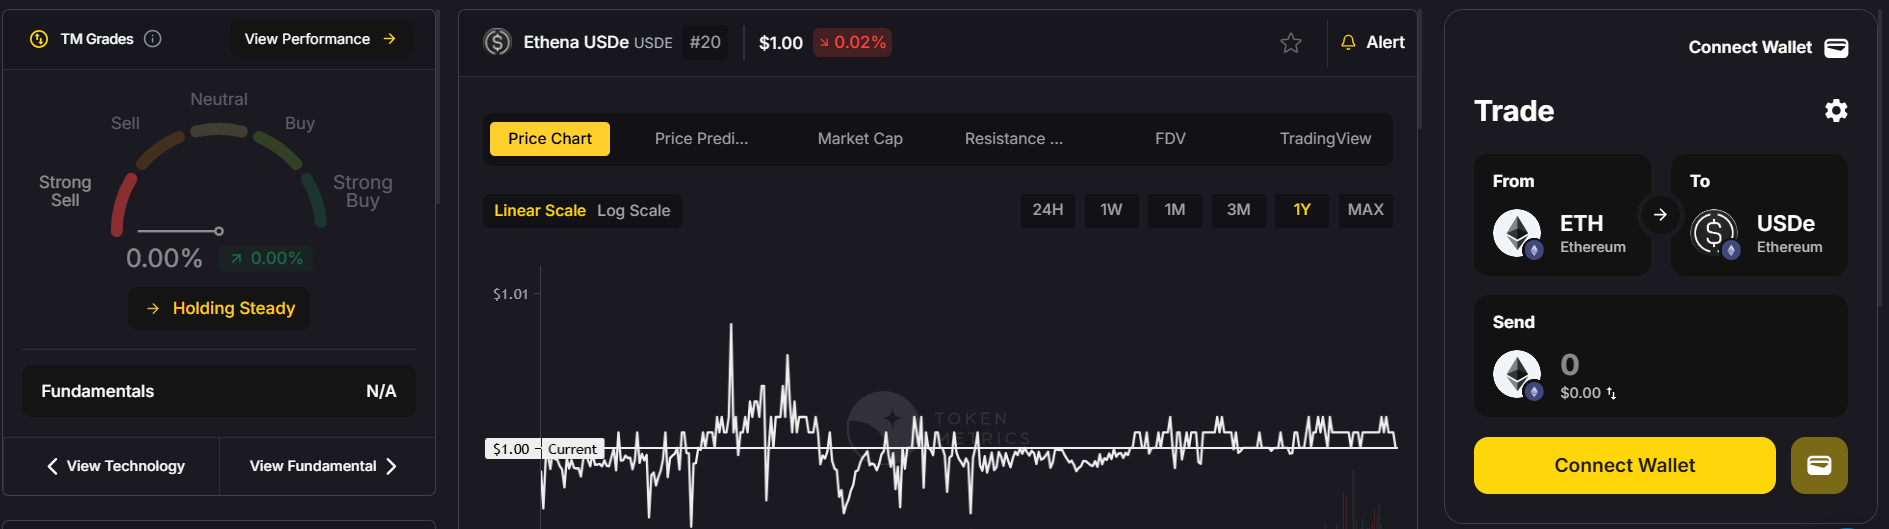
When it comes to crypto trading platforms, Token Metrics is not an exchange, but a crypto analytics and crypto trading intelligence platform powered by AI.
Token Metrics Team
10 min


%201.svg)
%201.svg)
Big news: We’re cranking up the heat on AI-driven crypto analytics with the launch of the Token Metrics API and our official SDK (Software Development Kit). This isn’t just an upgrade – it's a quantum leap, giving traders, hedge funds, developers, and institutions direct access to cutting-edge market intelligence, trading signals, and predictive analytics.
Crypto markets move fast, and having real-time, AI-powered insights can be the difference between catching the next big trend or getting left behind. Until now, traders and quants have been wrestling with scattered data, delayed reporting, and a lack of truly predictive analytics. Not anymore.
The Token Metrics API delivers 32+ high-performance endpoints packed with powerful AI-driven insights right into your lap, including:
Getting started with the Token Metrics API is simple:
At Token Metrics, we believe data should be decentralized, predictive, and actionable.
The Token Metrics API & SDK bring next-gen AI-powered crypto intelligence to anyone looking to trade smarter, build better, and stay ahead of the curve. With our official SDK, developers can plug these insights into their own trading bots, dashboards, and research tools – no need to reinvent the wheel.
APIs power much of the modern software economy, but the term can feel abstract. This guide breaks down what an API is, how APIs work in practice, common types you’ll encounter, and practical frameworks for evaluating or integrating an API into your projects.
An API, or application programming interface, is a set of rules and protocols that lets different software components communicate. Think of an API as a contract: one system exposes specific operations (endpoints) and data structures, and other systems call those operations to request services or information. The API hides internal complexity and provides a predictable interface for developers.
At its core, an API specifies:
APIs can be implemented with different technologies, but common patterns include REST, GraphQL, and RPC (gRPC). A typical web API flow involves a client sending an HTTP request to an endpoint URL, the server processing that request, and then returning a structured response. Key components to understand:
Understanding these pieces helps you design predictable integrations and debug issues like unexpected latencies or malformed responses.
Different APIs serve different needs. Here are common categories and examples:
Practical examples: integrating a payment processor via its REST API, pulling exchange rates from a crypto API for display, or using a mapping API to embed location features.
When researching or choosing an API, apply a short framework: compatibility, cost, reliability, and security (CCRS).
Additional integration tips: use sandbox environments for testing, log API requests/responses for troubleshooting, and build retry/backoff logic to handle transient failures.
Build Smarter Crypto Apps & AI Agents with Token Metrics
Token Metrics provides real-time prices, trading signals, and on-chain insights all from one powerful API. Grab a Free API Key
REST defines endpoints that return fixed data structures, which can result in over- or under-fetching. GraphQL exposes a query language where clients request exactly the fields they need, reducing extra data transfer but adding schema complexity on the server side.
API keys are simple credentials often used for server-to-server authentication or identifying an app. OAuth is an authorization framework that enables delegated access (user consents) and typically issues short-lived access tokens with refresh mechanics for better security.
No. Security depends on implementation: use HTTPS, validate and sanitize inputs, enforce proper authentication/authorization, rotate keys periodically, and monitor for unusual activity. Treat APIs as a potential attack surface and apply standard security controls.
Rate limits vary widely: some services allow thousands of requests per minute, others are stricter. Implement client-side throttling, exponential backoff on retries, and caching where appropriate to reduce request volume and avoid hitting limits.
AI-driven tools can help parse API responses, detect anomalies, prioritize endpoints by value, and synthesize insights from multiple data feeds. Platforms such as Token Metrics use AI to aggregate on-chain and market data, which can speed evaluation when integrating crypto-related APIs.
Common issues include unexpected breaking changes, insufficient error handling, underestimating rate limits, hidden costs, and lack of observability. Mitigate these by reading docs thoroughly, using versioned endpoints, and automating monitoring and alerts.
Disclaimer: This article is for educational and informational purposes only. It explains technical concepts and practical frameworks related to APIs and does not provide investment, legal, or professional advice. Evaluate services independently and consult appropriate experts for decision-making.
APIs — short for Application Programming Interfaces — are the invisible wiring that connects software, data, and services. From mobile apps fetching weather to crypto platforms streaming on-chain data, APIs turn discrete systems into interoperable ecosystems. This guide explains what an API is, how it works, common types and protocols, practical evaluation criteria, and how AI-driven tools can help you research and integrate APIs safely and effectively.
An API is a set of rules and conventions that lets one software program request services or data from another. Think of it as a contract: the provider exposes endpoints and documented inputs/outputs, and the consumer sends requests and receives structured responses. APIs abstract complexity, enforce consistency, and enable modular development.
At a high level, an API specifies:
Most modern web APIs operate over HTTP. A consumer makes a request to a URL (endpoint) using an HTTP method such as GET, POST, PUT, or DELETE. The server processes the request and returns a response payload plus status codes that signal success or error.
Core concepts:
Understanding these mechanics helps you design integrations, debug issues, and interpret API documentation efficiently.
Not all APIs are built the same. Choosing the right style depends on use case, performance needs, and client ecosystem.
Each approach has trade-offs: REST is simple but may require multiple round-trips, GraphQL reduces over-fetching but adds server complexity, and WebSockets enable streaming but require connection management.
APIs often provide access to valuable data and functionality, so security and governance are paramount. Key considerations include:
Operational SLAs, clear error codes, and robust documentation reduce integration friction and surface potential risks early.
When assessing a third-party API, use a structured framework:
For proofs of concept, use API testing tools (Postman, curl) and programmatic SDKs where available. Track metrics during integration and plan for retries, backoff strategies, and graceful degradation.
Build Smarter Crypto Apps & AI Agents with Token Metrics
Token Metrics provides real-time prices, trading signals, and on-chain insights all from one powerful API. Grab a Free API Key
An API (Application Programming Interface) is a defined set of rules and endpoints that allows one software system to request data or services from another. It standardizes how data is exchanged and operations are invoked between systems.
REST is simple and widely supported, ideal for straightforward resource-based access. GraphQL excels when clients need flexible, aggregated queries and want to reduce over-fetching. Choice depends on client needs and server complexity tolerance.
Security relies on strong authentication (API keys, OAuth), encryption (HTTPS/TLS), authorization controls, rate limiting, input validation, and monitoring. Regular audits and threat modeling help identify and mitigate risks.
APIs power mobile and web apps, payment processing, identity providers, data feeds (market, weather, maps), IoT device control, and integrations between enterprise systems or blockchain nodes.
Use sandbox environments and test keys where available. Employ tools like Postman for exploratory testing, write automated integration tests, validate edge cases and error handling, and verify rate-limit behaviors under load.
This article is for educational and informational purposes only. It explains technical concepts and evaluation frameworks but does not constitute professional, legal, or investment advice. Always perform your own due diligence when selecting or integrating APIs.
APIs sit at the center of modern software. Whether a mobile app fetches weather data, a dashboard queries on-chain activity, or an AI agent calls a language model, an API is the bridge that enables machines to communicate. This article breaks down what an API is, how it works, common types and use cases, and practical steps to evaluate and use one safely and effectively.
An API (Application Programming Interface) is a defined set of rules and protocols that allow software components to communicate. It specifies the methods available, the expected inputs and outputs, and the underlying conventions for transport and encoding. In web development, APIs typically include endpoints you can call over HTTP, request and response formats (commonly JSON), and authentication rules.
Think of an API as a contract: the provider promises certain functionality (data, computations, actions) and the consumer calls endpoints that adhere to that contract. Examples include a weather API returning forecasts, a payment API creating transactions, or a blockchain data API exposing balances and transactions.
At a technical level, most web APIs follow simple request/response patterns:
Key concepts to understand:
APIs come in many shapes tailored to different needs:
Use cases span industries: integrating payment gateways, building mobile backends, connecting to cloud services, feeding analytics dashboards, and powering crypto tools that stream price, order book, and on-chain data. AI systems also consume APIs—calling models for text generation, embeddings, or specialized analytics.
Whether you are a developer integrating an API or evaluating a provider, use a systematic approach:
For domain-specific APIs, such as those powering crypto analytics or trading signals, additional considerations include data freshness, source transparency (e.g., direct node reads vs. indexers), and on-chain coverage. Tools that combine data feeds with AI analytics can speed research—one example of a platform in that space is Token Metrics, which layers model-driven insights on top of market and on-chain inputs.
Build Smarter Crypto Apps & AI Agents with Token Metrics
Token Metrics provides real-time prices, trading signals, and on-chain insights all from one powerful API. Grab a Free API Key
Q: What is the difference between an API and an SDK?
A: An API is a set of rules for communicating with a service. An SDK (Software Development Kit) is a bundled set of tools, libraries, and often an API wrapper that helps developers integrate with that service more easily in a specific programming language.
Q: When is GraphQL preferable to REST?
A: GraphQL is useful when clients need flexible queries and want to avoid over- or under-fetching data. REST remains a strong default for simple, cache-friendly resource-based services and broad interoperability.
Q: What are basic security best practices for APIs?
A: Require HTTPS, enforce strong authentication (OAuth, signed tokens), validate and sanitize inputs, implement rate limits, use scopes for permissions, and log access for auditability. Rotate credentials and monitor anomalous usage.
Q: How do I get started with crypto or market data APIs?
A: Begin by identifying the data you need (prices, order books, on-chain events), locate providers with clear documentation and sample code, test endpoints in a sandbox, and account for latency and historical coverage. Combining raw feeds with analytics tools can help accelerate research.
Q: What is an API key and why are rate limits important?
A: An API key is a token that identifies and authenticates a client. Rate limits prevent abuse and keep shared services stable—exceeding limits typically returns 429 errors and may incur additional costs or temporary blocks.
This content is for informational and educational purposes only. It does not constitute investment, legal, tax, or professional advice. Evaluate tools, APIs, and services according to your own research and risk tolerance.
.svg)


.png)
Token Metrics Media LLC is a regular publication of information, analysis, and commentary focused especially on blockchain technology and business, cryptocurrency, blockchain-based tokens, market trends, and trading strategies.
Token Metrics Media LLC does not provide individually tailored investment advice and does not take a subscriber’s or anyone’s personal circumstances into consideration when discussing investments; nor is Token Metrics Advisers LLC registered as an investment adviser or broker-dealer in any jurisdiction.
Information contained herein is not an offer or solicitation to buy, hold, or sell any security. The Token Metrics team has advised and invested in many blockchain companies. A complete list of their advisory roles and current holdings can be viewed here: https://tokenmetrics.com/disclosures.html/
Token Metrics Media LLC relies on information from various sources believed to be reliable, including clients and third parties, but cannot guarantee the accuracy and completeness of that information. Additionally, Token Metrics Media LLC does not provide tax advice, and investors are encouraged to consult with their personal tax advisors.
All investing involves risk, including the possible loss of money you invest, and past performance does not guarantee future performance. Ratings and price predictions are provided for informational and illustrative purposes, and may not reflect actual future performance.


%20Price%20Prediction%20.webp)


%20Price%20Prediction.webp)


