Text Link
Text Link
Text Link
Text Link
Text Link
Thank you! Your submission has been received!
Oops! Something went wrong while submitting the form.

Stop Guessing, Start Trading: The Token Metrics API Advantage

Announcements

Big news: We’re cranking up the heat on AI-driven crypto analytics with the launch of the Token Metrics API and our official SDK (Software Development Kit). This isn’t just an upgrade – it's a quantum leap, giving traders, hedge funds, developers, and institutions direct access to cutting-edge market intelligence, trading signals, and predictive analytics.

Crypto markets move fast, and having real-time, AI-powered insights can be the difference between catching the next big trend or getting left behind. Until now, traders and quants have been wrestling with scattered data, delayed reporting, and a lack of truly predictive analytics. Not anymore.

The Token Metrics API delivers 32+ high-performance endpoints packed with powerful AI-driven insights right into your lap, including:

  • Trading Signals: AI-driven buy/sell recommendations based on real-time market conditions.
  • Investor & Trader Grades: Our proprietary risk-adjusted scoring for assessing crypto assets.
  • Price Predictions: Machine learning-powered forecasts for multiple time frames.
  • Sentiment Analysis: Aggregated insights from social media, news, and market data.
  • Market Indicators: Advanced metrics, including correlation analysis, volatility trends, and macro-level market insights.

Getting started with the Token Metrics API is simple:

  1. Sign up at www.tokenmetrics.com/api
  2. Generate an API key and explore sample requests.
  3. Choose a tier–start with 50 free API calls/month, or stake TMAI tokens for premium access.
  4. Optionally–download the SDK, install it for your preferred programming language, and follow the provided setup guide.

At Token Metrics, we believe data should be decentralized, predictive, and actionable. 

The Token Metrics API & SDK bring next-gen AI-powered crypto intelligence to anyone looking to trade smarter, build better, and stay ahead of the curve. With our official SDK, developers can plug these insights into their own trading bots, dashboards, and research tools – no need to reinvent the wheel.

Research

Understanding REST APIs: Architecture, Security & Best Practices

Token Metrics Team
5
MIN

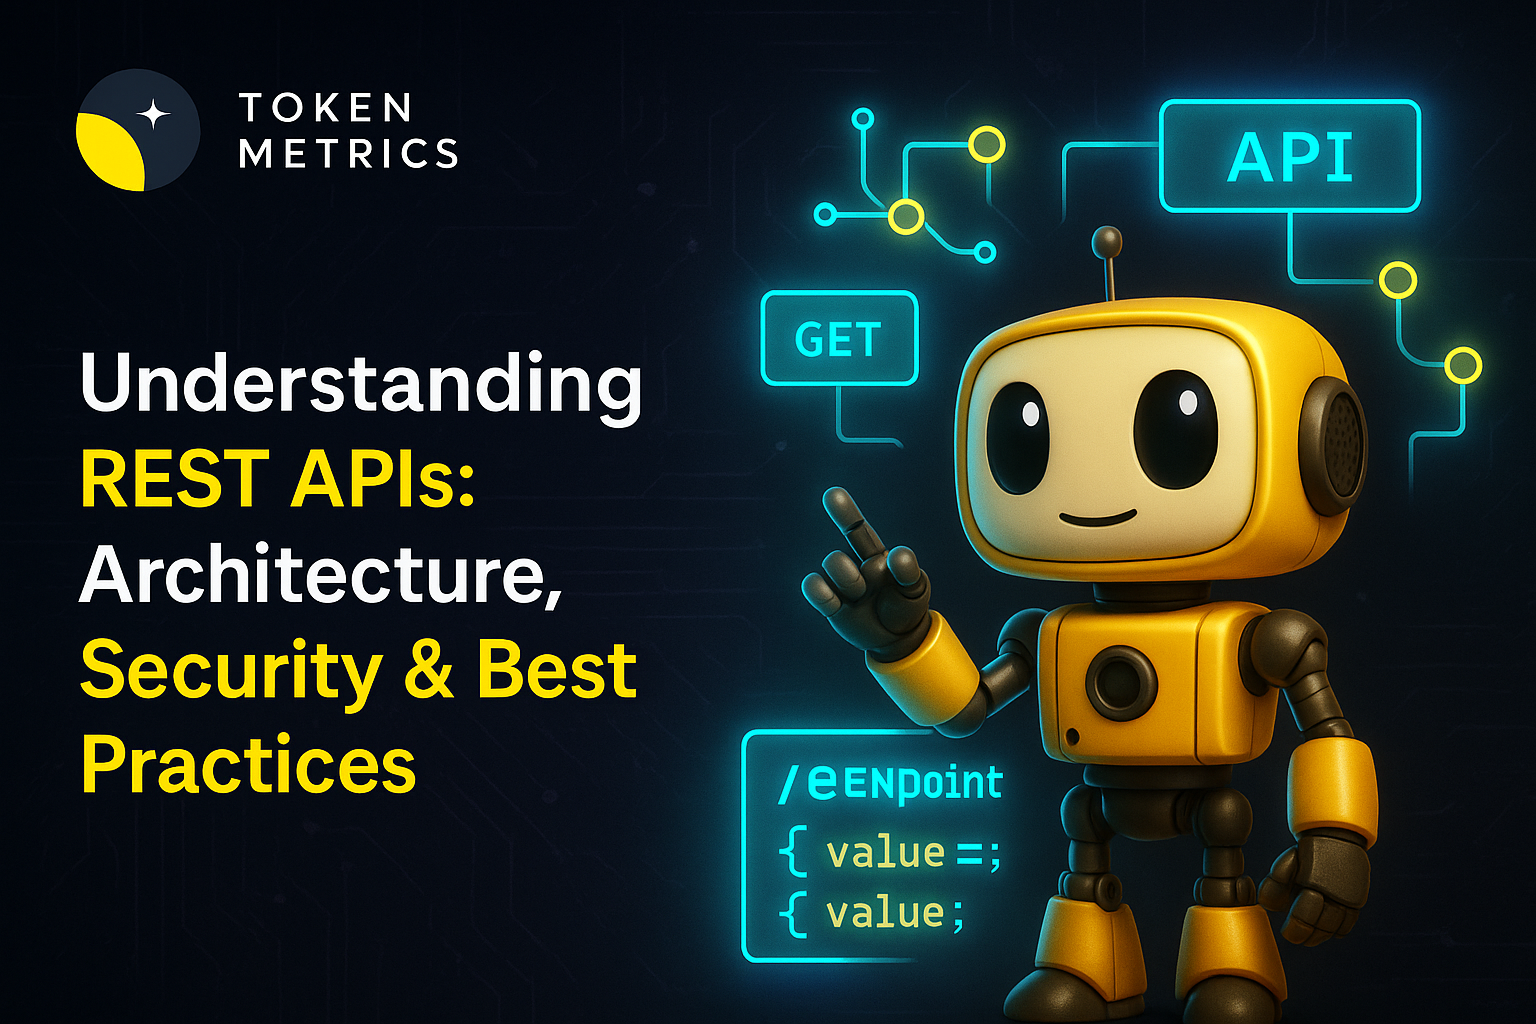
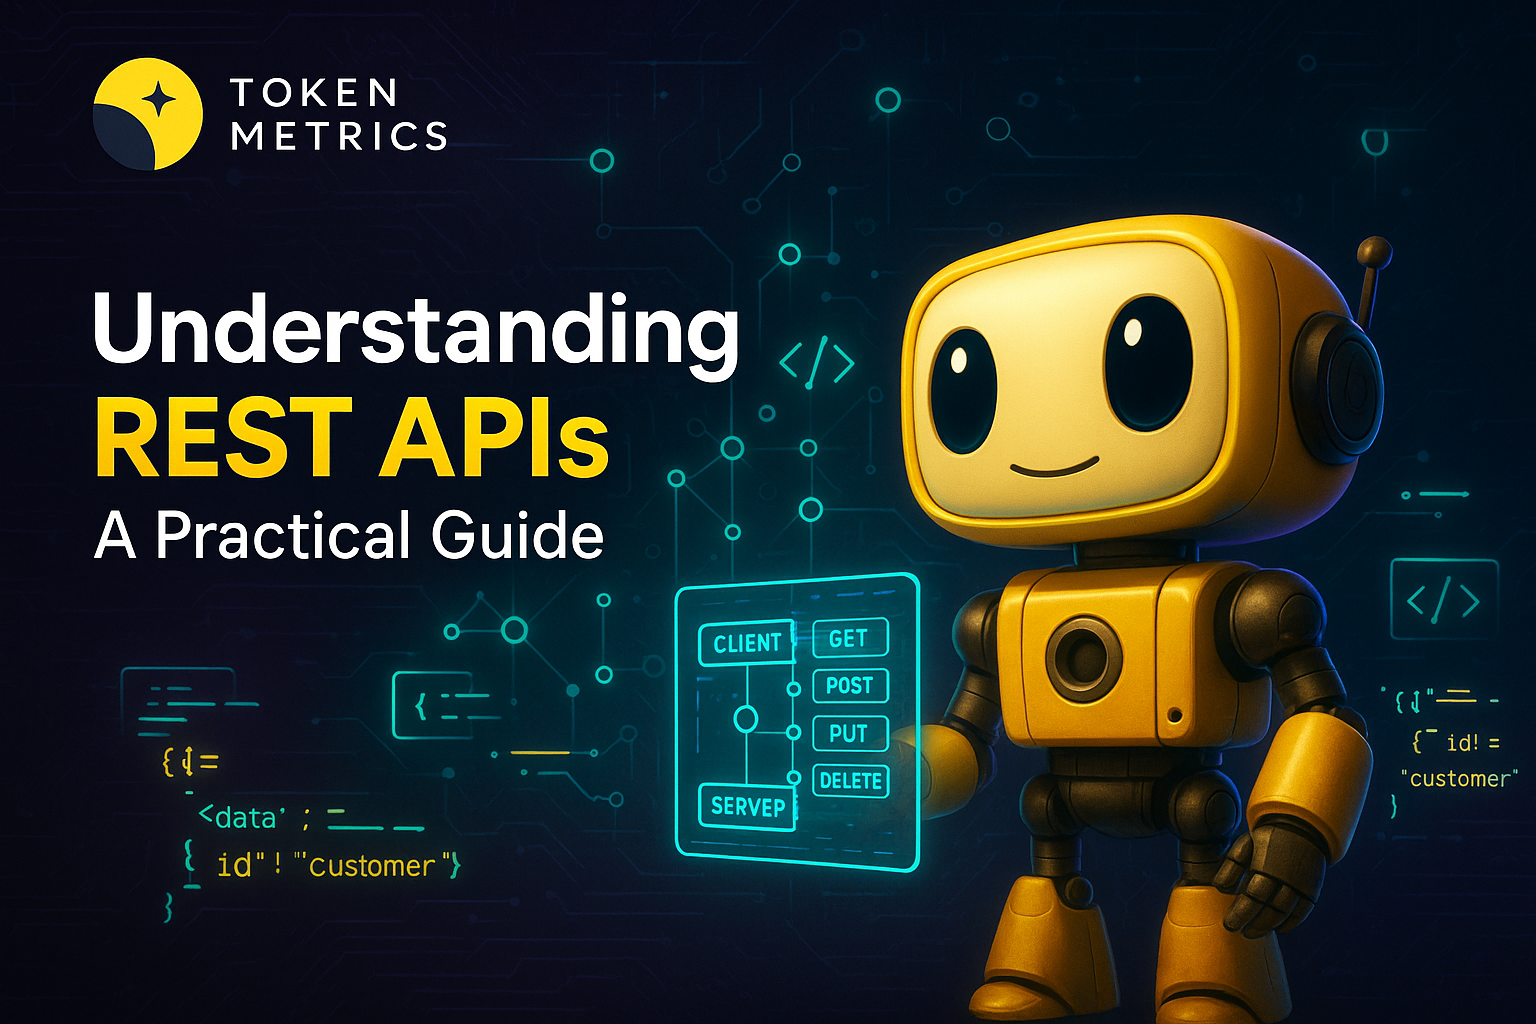
REST APIs power modern web services by defining a simple, uniform way to access and manipulate resources over HTTP. Whether you are designing an internal microservice, integrating third-party data, or building AI agents that call services programmatically, understanding REST API principles helps you build reliable, maintainable systems. This guide breaks down core concepts, design trade-offs, security controls, and practical patterns you can apply when evaluating or implementing RESTful interfaces.

What is a REST API and when to use it

REST (Representational State Transfer) is an architectural style that uses standard HTTP methods to operate on resources identified by URLs. A REST API typically returns structured representations—most commonly JSON—that describe resources such as users, transactions, or telemetry. REST is well suited for:

  • Stateless interactions where each request carries all necessary information.
  • CRUD-style access to resources using predictable verbs (GET, POST, PUT, PATCH, DELETE).
  • Public or internal APIs that benefit from caching, composability, and clear URL semantics.

REST is not a silver bullet: systems requiring real-time bidirectional streams, complex RPC semantics, or strict schema contracts may favor WebSockets, gRPC, or GraphQL depending on latency and payload requirements.

Core design principles and endpoint structure

Good REST design emphasizes simplicity, consistency, and discoverability. Key guidelines include:

  • Resource-oriented URLs: Use nouns for endpoints (e.g., /orders, /users/123) and avoid verbs in paths.
  • HTTP method semantics: Map CRUD to GET (read), POST (create), PUT/PATCH (update), DELETE (remove).
  • Use status codes consistently: 2xx for success, 4xx for client errors, 5xx for server errors. Provide machine-readable error bodies.
  • Pagination and filtering: For large collections, design cursor-based or offset pagination and allow filtering/sorting via query parameters.
  • Versioning: Plan for breaking changes via versioning strategies—URI versioning (/v1/...), header-based versioning, or content negotiation.

Consider API discoverability through hypermedia (HATEOAS) if you need clients to navigate available actions dynamically. Otherwise, well-documented OpenAPI (Swagger) specifications are essential for developer experience and tooling.

Security, authentication, and rate limiting

Security is critical for any publicly exposed REST API. Core controls include:

  • Authentication: Use standards like OAuth 2.0 or API keys depending on client types. Prefer token-based flows for third-party access.
  • Authorization: Enforce least privilege: ensure endpoints validate scope and role permissions server-side.
  • Transport security: Enforce TLS for all traffic; redirect HTTP to HTTPS and use strong TLS configurations.
  • Rate limiting and quotas: Protect services from abuse and ensure fair use. Provide informative headers (e.g., X-RateLimit-Remaining).
  • Input validation and output encoding: Defend against injection and serialization vulnerabilities by validating and sanitizing inputs and outputs.

For sensitive domains like crypto data feeds or identity, combine monitoring, anomaly detection, and clear incident response procedures. When aggregating external data, validate provenance and apply freshness checks.

Implementation patterns, testing, and observability

From implementation to production readiness, the following practical steps improve reliability:

  1. Schema-first development: Define OpenAPI/JSON Schema early to generate client/server stubs and ensure consistency.
  2. Automated testing: Implement contract tests, integration tests against staging environments, and fuzz tests for edge cases.
  3. Robust logging and tracing: Emit structured logs and distributed traces that include request IDs, latency, and error context.
  4. Backward compatibility: Adopt non-breaking change policies and use feature flags or deprecation windows for clients.
  5. Monitoring and SLIs: Track latency percentiles, error rates, and throughput. Define SLOs and alert thresholds.

When building data-driven applications or AI agents that call APIs, consider data quality checks and retry/backoff strategies to handle transient failures gracefully. For crypto and market-data integrations, specialized providers can simplify ingestion and normalization; for example, Token Metrics is often used as an analytics layer by teams that need standardized signals and ratings.

Build Smarter Crypto Apps & AI Agents with Token Metrics

Token Metrics provides real-time prices, trading signals, and on-chain insights all from one powerful API. Grab a Free API Key

What are the most important HTTP methods to know for REST APIs?

The primary methods are GET (retrieve), POST (create), PUT/PATCH (update), and DELETE (remove). Each has semantic expectations: GET should be safe and idempotent, while POST is typically non-idempotent. Use PATCH for partial updates and PUT for full replacements when appropriate.

How should I version a REST API without breaking clients?

Common strategies include URI versioning (e.g., /v1/resource), header-based versioning, or content negotiation. Regardless of approach, communicate deprecation timelines, provide migration guides, and support old versions during a transition window.

When is REST not the right choice?

REST may be suboptimal for low-latency bidirectional communication (use WebSockets), strict schema contracts and performance-sensitive RPCs (consider gRPC), or when clients need a single call to fetch heterogeneous nested resources (GraphQL can reduce over-/under-fetching).

How do I document and share an API effectively?

Maintain an OpenAPI specification, host interactive docs (Swagger UI, Redoc), and provide example requests, SDKs, and changelogs. Automated validation against the contract helps keep docs and runtime behavior aligned.

What are key observability metrics for REST APIs?

Track latency (P50/P95/P99), request throughput, error rates by endpoint and status code, database or downstream call latencies, and service saturation metrics (CPU, memory, connection counts). Combine logs, traces, and metrics for faster incident response.

Disclaimer

This article is for educational and informational purposes only. It provides technical analysis of REST API design and operational considerations and does not constitute investment, legal, or regulatory advice. Always perform your own due diligence when integrating external services or handling sensitive data.

Research

Practical Guide to Building and Using REST APIs

Token Metrics Team
6
MIN

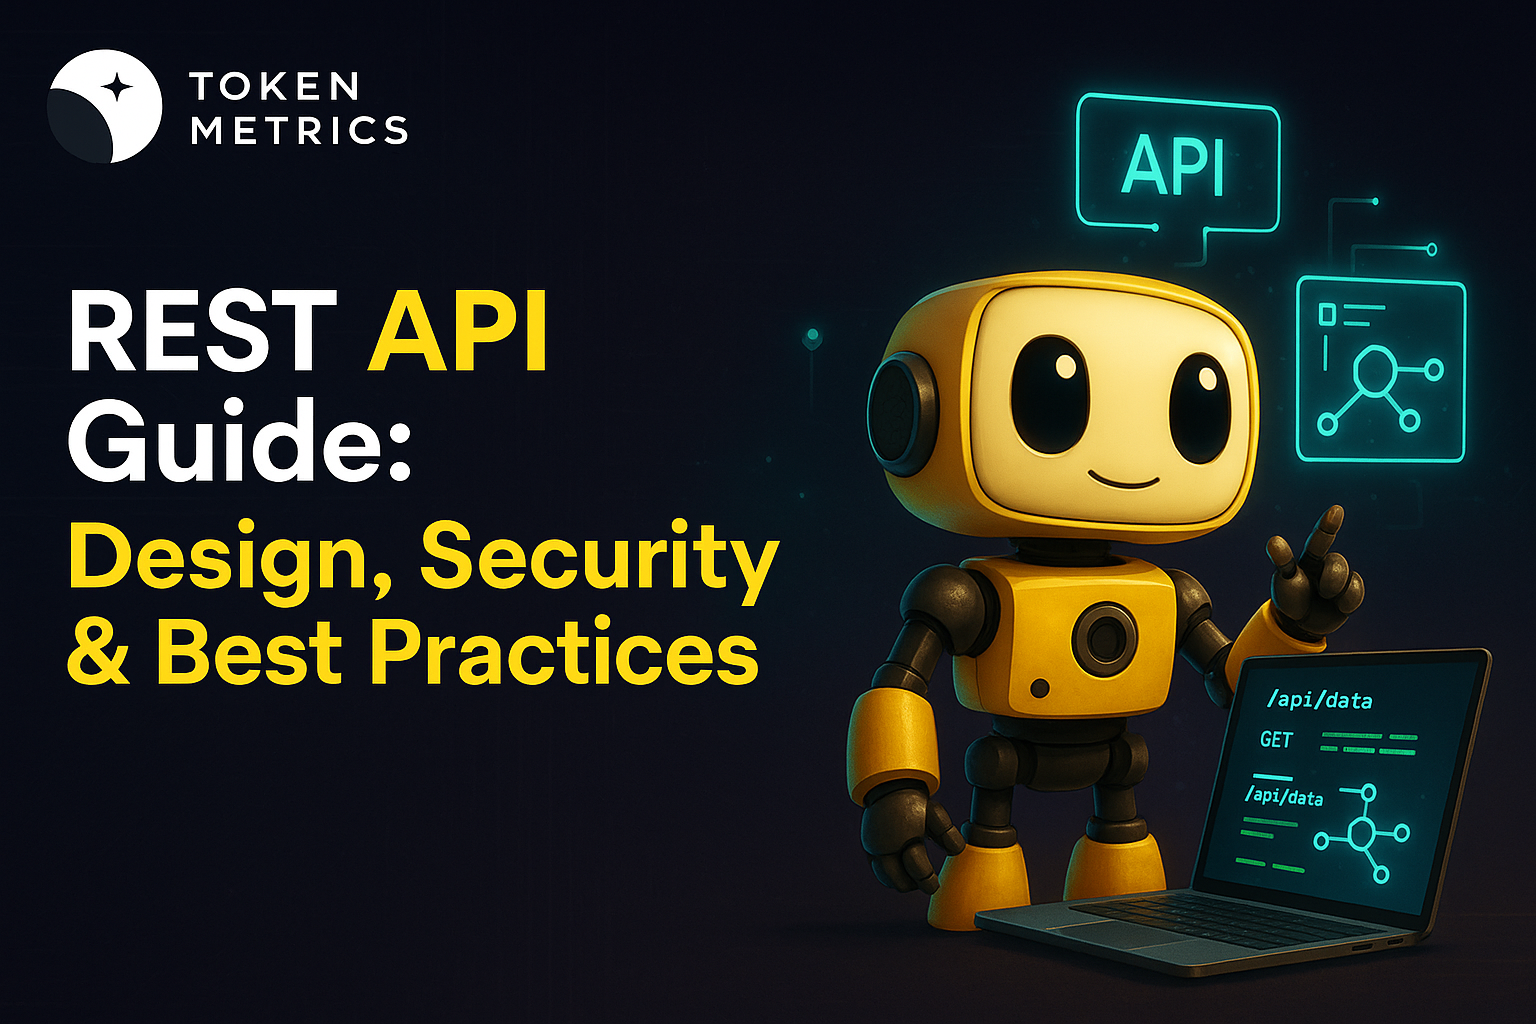
REST APIs power much of the modern web: mobile apps, single-page frontends, third-party integrations, and many backend services communicate via RESTful endpoints. This guide breaks down the core principles, design patterns, security considerations, and practical workflows for building and consuming reliable REST APIs. Whether you are evaluating an external API or designing one for production, the frameworks and checklists here will help you ask the right technical questions and set up measurable controls.

What is a REST API and why it matters

REST (Representational State Transfer) is an architectural style for networked applications that uses stateless communication, standard HTTP verbs, and resource-oriented URLs. A REST API exposes resources (users, orders, prices, metadata) as endpoints that clients can retrieve or modify. The simplicity of the model and ubiquity of HTTP make REST a common choice for public APIs and internal microservices.

Key benefits include:

  • Interoperability: Clients and servers can be developed independently as long as they agree on the contract.
  • Scalability: Stateless interactions simplify horizontal scaling and load balancing.
  • Tooling: Broad tool and library support — from Postman to client SDK generators.

Core principles and HTTP methods

Designing a good REST API starts with consistent use of HTTP semantics. The common verbs and their typical uses are:

  • GET — retrieve a representation of a resource; should be safe and idempotent.
  • POST — create a new resource or trigger processing; not idempotent by default.
  • PUT — replace a resource entirely; idempotent.
  • PATCH — apply partial updates to a resource.
  • DELETE — remove a resource.

Good RESTful design also emphasizes:

  • Resource modeling: use nouns for endpoints (/orders, /users/{id}) not verbs.
  • Meaningful status codes: 200, 201, 204, 400, 401, 404, 429, 500 to convey outcomes.
  • HATEOAS (where appropriate): include links in responses to related actions.

Design, documentation, and versioning best practices

Well-documented APIs reduce integration friction and errors. Follow these practical habits:

  1. Start with a contract: define your OpenAPI/Swagger specification before coding. It captures endpoints, data models, query parameters, and error shapes.
  2. Use semantic versioning for breaking changes: /v1/ or header-based versioning helps consumers migrate predictably.
  3. Document error schemas and rate limit behavior clearly so clients can implement backoff and retries.
  4. Support pagination and filtering consistently (cursor-based pagination is more resilient than offset-based for large datasets).
  5. Ship SDKs or client code samples in common languages to accelerate adoption and reduce misuse.

Automate documentation generation and run contract tests as part of CI to detect regressions early.

Security, performance, and monitoring

Security and observability are essential. Practical controls and patterns include:

  • Authentication and authorization: implement OAuth 2.0, API keys, or mutual TLS depending on threat model. Always scope tokens and rotate secrets regularly.
  • Input validation and output encoding to prevent injection attacks and data leaks.
  • Rate limiting, quotas, and request throttling to protect downstream systems during spikes.
  • Use TLS for all traffic and enforce strong cipher suites and certificate pinning where appropriate.
  • Logging, distributed tracing, and metrics: instrument endpoints to measure latency, error rates, and usage patterns. Tools like OpenTelemetry make it easier to correlate traces across microservices.

Security reviews and occasional red-team exercises help identify gaps beyond static checks.

Integrating REST APIs with modern workflows

Consuming and testing REST APIs fits into several common workflows:

  • Exploration: use Postman or curl to verify basic behavior and response shapes.
  • Automation: generate client libraries from OpenAPI specs and include them in CI pipelines to validate integrations automatically.
  • API gateways: centralize authentication, caching, rate limiting, and request shaping to relieve backend services.
  • Monitoring: surface alerts for error budgets and SLA breaches; capture representative traces to debug bottlenecks.

When building sector-specific APIs — for example, price feeds or on-chain data — combining REST endpoints with streaming (webhooks or websockets) can deliver both historical queries and low-latency updates. AI-driven analytics platforms can help synthesize large API outputs into actionable signals and summaries; for example, Token Metrics and similar tools can ingest API data for model-driven analysis without manual aggregation.

Build Smarter Crypto Apps & AI Agents with Token Metrics

Token Metrics provides real-time prices, trading signals, and on-chain insights all from one powerful API. Grab a Free API Key

FAQ: Common REST API questions

What is the difference between REST and RESTful?

REST describes the architectural constraints and principles. "RESTful" is commonly used to describe APIs that follow those principles, i.e., resource-based design, stateless interactions, and use of standard HTTP verbs.

How should I handle versioning for a public API?

Expose a clear versioning strategy early. Path versioning (/v1/) is explicit and simple, while header or content negotiation can be more flexible. Regardless of approach, document migration timelines and provide backward compatibility where feasible.

When should I use PATCH vs PUT?

Use PUT to replace a resource fully; use PATCH to apply partial updates. PATCH payloads should be well-defined (JSON Patch or application/merge-patch+json) to avoid ambiguity.

What are common pagination strategies?

Offset-based pagination is easy to implement but can produce inconsistent results with concurrent writes. Cursor-based (opaque token) pagination is more robust for large, frequently changing datasets.

How do I test and validate an API contract?

Use OpenAPI specs combined with contract testing tools that validate servers against the spec. Include integration tests in CI that exercise representative workflows and simulate error conditions and rate limits.

How can I secure public endpoints without impacting developer experience?

Apply tiered access controls: provide limited free access with API keys and rate limits for discovery, and require stronger auth (OAuth, signed requests) for sensitive endpoints. Clear docs and quickstart SDKs reduce friction for legitimate users.

What metrics should I monitor for API health?

Track latency percentiles (p50/p95/p99), error rates by status code, request volume, and authentication failures. Correlate these with infrastructure metrics and traces to identify root causes quickly.

Can REST APIs be used with AI models?

Yes. REST APIs can serve as a data ingestion layer for AI workflows, supplying labeled data, telemetry, and features. Combining batch and streaming APIs allows models to access both historical and near-real-time inputs for inference and retraining.

Are there alternatives to REST I should consider?

GraphQL offers flexible client-driven queries and can reduce overfetching, while gRPC provides efficient binary RPC for internal services. Choose based on client needs, performance constraints, and team expertise.

Disclaimer

This article is educational and technical in nature. It does not provide investment, legal, or regulatory advice. Implementations and design choices should be validated against your organization’s security policies and compliance requirements.

Research

Master REST APIs: Design, Security & Integration

Token Metrics Team
5
MIN

REST APIs are the lingua franca of modern web and data ecosystems. Developers, data scientists, and product teams rely on RESTful endpoints to move structured data between services, power mobile apps, and connect AI models to live data sources. This post explains what REST APIs are, the core principles and methods, practical design patterns, security considerations, and how to evaluate REST APIs for use in crypto and AI workflows.

What is a REST API?

Representational State Transfer (REST) is an architectural style for distributed systems. A REST API exposes resources—such as users, orders, or market ticks—via predictable URLs and HTTP methods. Each resource representation is typically transferred in JSON, XML, or other media types. The API defines endpoints, input and output schemas, and expected status codes so clients can programmatically interact with a server.

Key characteristics include stateless requests, cacheable responses when appropriate, uniform interfaces, and resource-oriented URIs. REST is not a protocol but a set of conventions that favor simplicity, scalability, and composability. These properties make REST APIs well-suited for microservices, web clients, and integrations with analytics or machine learning pipelines.

REST Principles and Core HTTP Methods

Understanding the mapping between REST semantics and HTTP verbs is foundational:

  • GET retrieves a resource or collection; it should be safe and idempotent.
  • POST creates or triggers server-side processes and is generally non-idempotent.
  • PUT replaces a resource and is idempotent.
  • PATCH partially updates a resource.
  • DELETE removes a resource and should also be idempotent.

Designing clear resource names and predictable query parameters improves developer experience. Use nouns for endpoints (e.g., /api/v1/orders) and separate filtering, sorting, and pagination parameters. Well-structured response envelopes with consistent error codes and time stamps help automation and observability.

Designing and Securing REST APIs

Good REST API design balances usability, performance, and security. Start with a contract-first approach: define OpenAPI/Swagger schemas that describe endpoints, request/response shapes, authentication, and error responses. Contracts enable auto-generated clients, mock servers, and validation tooling.

Security considerations include:

  • Authentication: Use OAuth 2.0, API keys, or mutual TLS depending on the trust model. Prefer short-lived tokens and refresh flows for user-facing apps.
  • Authorization: Enforce least privilege via roles, scopes, or claims. Validate permissions on every request.
  • Input validation: Validate and sanitize incoming payloads to prevent injection attacks.
  • Rate limiting & throttling: Protect resources from abuse and ensure predictable QoS.
  • Transport security: Enforce TLS, HSTS, and secure cipher suites for all endpoints.

Operational best practices include logging structured events, exposing health and metrics endpoints, and versioning APIs (e.g., v1, v2) to enable backward-compatible evolution. Use semantic versioning in client libraries and deprecate endpoints with clear timelines and migration guides.

Testing, Monitoring, and Performance Optimization

Testing a REST API includes unit tests for business logic, contract tests against OpenAPI definitions, and end-to-end integration tests. Performance profiling should focus on latency tail behavior, not just averages. Key tools and techniques:

  • Automated contract validation (OpenAPI/Swagger)
  • Load testing for realistic traffic patterns (ramp-up, burst, sustained)
  • Circuit breakers and caching layers for downstream resiliency
  • Observability: distributed tracing, structured logs, and metrics for request rates, errors, and latency percentiles

For AI systems, robust APIs must address reproducibility: include schema versioning and event timestamps so models can be retrained with consistent historical data. For crypto-related systems, ensure on-chain data sources and price oracles expose deterministic endpoints and clearly document freshness guarantees.

REST APIs in Crypto and AI Workflows

REST APIs are frequently used to expose market data, on-chain metrics, historical time-series, and signals that feed AI models or dashboards. When integrating third-party APIs for crypto data, evaluate latency, update frequency, and the provider's methodology for derived metrics. Consider fallbacks and reconciliations: multiple independent endpoints can be polled and compared to detect anomalies or outages.

AI agents often consume REST endpoints for feature extraction and live inference. Design APIs with predictable rate limits and batching endpoints to reduce overhead. Document data lineage: indicate when data is fetched, normalized, or transformed so model training and validation remain auditable.

Tools that combine real-time prices, on-chain insights, and signal generation can accelerate prototyping of analytics and agents. For example, Token Metrics provides AI-driven research and analytics that teams can evaluate as part of their data stack when building integrations.

Build Smarter Crypto Apps & AI Agents with Token Metrics

Token Metrics provides real-time prices, trading signals, and on-chain insights all from one powerful API. Grab a Free API Key

What is REST and how does it differ from other API styles?

REST is an architectural style that leverages HTTP methods and resource-oriented URIs. It differs from RPC and SOAP by emphasizing uniform interfaces, statelessness, and resource representations. GraphQL is query-oriented and allows clients to request specific fields, which can reduce over-fetching but requires different server-side handling.

How should I secure a REST API?

Use TLS for transport security, strong authentication (OAuth2, API keys, or mTLS), authorization checks on each endpoint, input validation, rate limiting, and monitoring. Consider short-lived tokens and revoke mechanisms for compromised credentials.

What are best practices for versioning REST APIs?

Adopt explicit versioning (path segments like /v1/), maintain backward compatibility when possible, and provide clear deprecation notices with migration guides. Use semantic versioning for client libraries and contract-first changes to minimize breaking updates.

How do I handle rate limits and throttling?

Implement rate limits per API key or token, and communicate limits via headers (e.g., X-RateLimit-Remaining). Provide exponential backoff guidance for clients and consider burst allowances for intermittent workloads. Monitor usage patterns to adjust thresholds.

What testing and monitoring are essential for production APIs?

Essential practices include unit and contract tests, integration tests, load tests, structured logging, distributed tracing, and alerting on error rates or latency SLA breaches. Health checks and automated failover strategies improve availability.

Disclaimer

This article is for educational and informational purposes only. It does not constitute investment, financial, or legal advice. Evaluate third-party tools and data sources independently and consider compliance requirements relevant to your jurisdiction and project.

Recent Posts

No Item Found
Research

Crypto API to Google Sheets in 5 Minutes: How to Use Token Metrics API with Apps Script

Token Metrics Team
6 min
MIN

If you're a trader, data analyst, or crypto enthusiast, chances are you've wanted to pull live crypto data directly into Google Sheets. Whether you're tracking prices, building custom dashboards, or backtesting strategies, having real-time data at your fingertips can give you an edge.

In this guide, we'll show you how to integrate the Token Metrics API — a powerful crypto API with free access to AI-powered signals — directly into Google Sheets in under 5 minutes using Google Apps Script.

📌 Why Use Google Sheets for Crypto Data?

Google Sheets is a flexible, cloud-based spreadsheet that:

  • Requires no coding to visualize data
  • Can be shared and updated in real time
  • Offers formulas, charts, and conditional formatting
  • Supports live API connections with Apps Script

When combined with the Token Metrics API, it becomes a powerful dashboard that updates live with Trader Grades, Bull/Bear Signals, historical OHLCV data, and more.

🚀 What Is Token Metrics API?

The Token Metrics API provides real-time and historical crypto data powered by AI. It includes:

  • Trader Grade: A score from 0 to 100 showing bullish/bearish potential
  • Bull/Bear Signal: A binary signal showing market direction
  • OHLCV: Open-High-Low-Close-Volume price history
  • Token Metadata: Symbol, name, category, market cap, and more

The best part? The free Basic Plan includes:

  • 5,000 API calls/month
  • Access to core endpoints
  • Hourly data refresh
  • No credit card required

👉 Sign up for free here

🛠️ What You’ll Need

  • A free Token Metrics API key
  • A Google account
  • Basic familiarity with Google Sheets

⚙️ How to Connect Token Metrics API to Google Sheets

Here’s how to get live AI-powered crypto data into Sheets using Google Apps Script.

🔑 Step 1: Generate Your API Key

  1. Visit: https://app.tokenmetrics.com/en/api
  2. Click “Generate API Key”
  3. Copy it — you’ll use this in the script

📄 Step 2: Create a New Google Sheet

  1. Go to Google Sheets
  2. Create a new spreadsheet
  3. Click Extensions > Apps Script

💻 Step 3: Paste This Apps Script

const TOKEN_METRICS_API_KEY = 'YOUR_API_KEY_HERE';

async function getTraderGrade(symbol) {

  const url = `https://api.tokenmetrics.com/v2/trader-grades?symbol=${symbol.toUpperCase()}`;

  const options = {

    method: 'GET',

    contentType: 'application/json',

    headers: {

      'accept': 'application/json',

      'x-api-key': TOKEN_METRICS_API_KEY,

    },

    muteHttpExceptions: true

  };


  const response = UrlFetchApp.fetch(url, options);

  const data = JSON.parse(response.getContentText() || "{}")


  if (data.success && data.data.length) {

    const coin = data.data[0];

    return [

      coin.TOKEN_NAME,

      coin.TOKEN_SYMBOL,

      coin.TA_GRADE,

      coin.DATE

    ];

  } else {

    return ['No data', '-', '-', '-'];

  }

}

async function getSheetData() {

  const sheet = SpreadsheetApp.getActiveSpreadsheet().getActiveSheet();

  const symbols = sheet.getRange('A2:A').getValues().flat().filter(Boolean);

  const results = [];

  results.push(['Name', 'Symbol', 'Trader Grade', 'Date']);

  for (const symbol of symbols) {

    if (symbol) {

      const row = await getTraderGrade(symbol);

      results.push(row);

    }

  }

  sheet.getRange(2, 2, results.length, results[0].length).setValues(results);

}

🧪 Step 4: Run the Script

  1. Replace 'YOUR_API_KEY_HERE' with your real API key.
  2. Save the project as TokenMetricsCryptoAPI.
  3. In your sheet, enter a list of symbols (e.g., BTC, ETH, SOL) in Column A.
  4. Go to the script editor and run getSheetData() from the dropdown menu.

Note: The first time, Google will ask for permission to access the script.

✅ Step 5: View Your Live Data

After the script runs, you’ll see:

  • Coin name and symbol
  • Trader Grade (0–100)
  • Timestamp

You can now:

  • Sort by Trader Grade
  • Add charts and pivot tables
  • Schedule automatic updates with triggers (e.g., every hour)

🧠 Why Token Metrics API Is Ideal for Google Sheets Users

Unlike basic price APIs, Token Metrics offers AI-driven metrics that help you:

  • Anticipate price action before it happens
  • Build signal-based dashboards or alerts
  • Validate strategies against historical signals
  • Keep your data fresh with hourly updates

And all of this starts for free.

🏗️ Next Steps: Expand Your Sheet

Here’s what else you can build:

  • A portfolio tracker that pulls your top coins’ grades
  • A sentiment dashboard using historical OHLCV
  • A custom screener that filters coins by Trader Grade > 80
  • A Telegram alert system triggered by Sheets + Apps Script + Webhooks

You can also upgrade to the Advanced Plan to unlock 21 endpoints including:

  • Investor Grades
  • Smart Indices
  • Sentiment Metrics
  • Quantitative AI reports
  • 60x API speed

🔐 Security Tip

Never share your API key in a public Google Sheet. Use script-level access and keep the sheet private unless required.

🧩 How-To Schema Markup (for SEO)

{

  "@context": "https://schema.org",

  "@type": "HowTo",

  "name": "Crypto API to Google Sheets in 5 Minutes",

  "description": "Learn how to connect the Token Metrics crypto API to Google Sheets using Google Apps Script and get real-time AI-powered signals and prices.",

  "totalTime": "PT5M",

  "supply": [

    {

      "@type": "HowToSupply",

      "name": "Google Sheets"

    },

    {

      "@type": "HowToSupply",

      "name": "Token Metrics API Key"

    }

  ],

  "tool": [

    {

      "@type": "HowToTool",

      "name": "Google Apps Script"

    }

  ],

  "step": [

    {

      "@type": "HowToStep",

      "name": "Get Your API Key",

      "text": "Sign up at Token Metrics and generate your API key from the API dashboard."

    },

    {

      "@type": "HowToStep",

      "name": "Create a New Google Sheet",

      "text": "Open a new sheet and list crypto symbols in column A."

    },

    {

      "@type": "HowToStep",

      "name": "Add Apps Script",

      "text": "Go to Extensions > Apps Script and paste the provided code, replacing your API key."

    },

    {

      "@type": "HowToStep",

      "name": "Run the Script",

      "text": "Execute the getSheetData function to pull data into the sheet."

    }

  ]

}

✍️ Final Thoughts

If you're serious about crypto trading or app development, integrating live market signals into your workflow can be a game-changer. With the Token Metrics API, you can get institutional-grade AI signals — right inside Google Sheets.

This setup is simple, fast, and completely free to start. Try it today and unlock a smarter way to trade and build in crypto.

👉 Get Your API Key & Start for Free

Announcements

🚀Put Your $TMAI to Work: Daily Rewards, No Locks, Up To 200% APR.

Token Metrics Team
5 min
MIN

Liquidity farming just got a major upgrade. Token Metrics AI ($TMAI) has launched its first liquidity incentive campaign on Merk — and it’s designed for yield hunters looking to earn fast, with no lockups, no gimmicks, and real rewards from Day 1.

📅 Campaign Details

  • Duration: June 5 – June 19, 2025
  • Rewards Begin: 17:00 UTC / 1:00 PM ET
  • Total TMAI Committed: 38 million+ $TMAI
  • No Lockups: Enter or exit at any time
  • APR Potential: Up to 200%

For two weeks, liquidity providers can earn high daily rewards across three different pools. All rewards are paid in $TMAI and distributed continuously — block by block — through the Merkl platform.

💧 Where to Earn – The Pools (as of June 5, 17:00 UTC)

Pool                                                    Starting APR %               Total Rewards (14 days)                Current TVL

Aerodrome WETH–TMAI        150%                                16.79M TMAI (~$11,000)                   $86,400

Uniswap v3 USDC–TMAI        200%                                14.92M TMAI (~$9,800)                    $19,900

Balancer 95/5 WETH–TMAI    200%                                5.60M TMAI (~$3,700)                       $9,500

These pools are live and actively paying rewards. APR rates aren’t displayed on Merkl until the first 24 hours of data are available — but early providers will already be earning.

🧠 Why This Campaign Stands Out

1. Turbo Rewards for a Short Time

This isn’t a slow-drip farm. The TMAI Merkl campaign is designed to reward action-takers. For the first few days, yields are especially high — thanks to low TVL and full daily reward distribution.

2. No Lockups or Waiting Periods

You can provide liquidity and withdraw it anytime — even the same day. There are no lockups, no vesting, and no delayed payout mechanics. All rewards accrue automatically and are claimable through Merkl.

3. Choose Your Risk Profile

You get to pick your exposure.

  • Want ETH upside? Stake in Aerodrome or Balancer.
  • Prefer stablecoin stability? Go with the Uniswap v3 USDC–TMAI pool.

4. Influence the Future of TMAI Yield Farming

This campaign isn’t just about yield — it’s a test. If enough users participate and volume grows, the Token Metrics Treasury will consider extending liquidity rewards into Q3 and beyond. That means more TMAI emissions, longer timelines, and consistent passive income opportunities for LPs.

5. Built for Transparency and Speed

Rewards are distributed via Merkl by Angle Labs, a transparent, gas-efficient platform for programmable liquidity mining. You can see the exact rewards, TVL, wallet counts, and pool analytics at any time.

🔧 How to Get Started

Getting started is simple. You only need a crypto wallet, some $TMAI, and a matching asset (either WETH or USDC, depending on the pool).

Step-by-step:

  1. Pick a pool:
    Choose from Aerodrome, Uniswap v3, or Balancer depending on your risk appetite and asset preference.

  2. Provide liquidity:
    Head to the Merkl link for your pool, deposit both assets, and your position is live immediately.

  3. Track your earnings:
    Watch TMAI accumulate daily in your Merkl dashboard. You can claim rewards at any time.

  4. Withdraw when you want:
    Since there are no lockups, you can remove your liquidity whenever you choose — rewards stop the moment liquidity is pulled.

🎯 Final Thoughts

This is a rare opportunity to earn serious rewards in a short amount of time. Whether you’re new to liquidity mining or a DeFi veteran, the TMAI Merkl campaign is built for speed, flexibility, and transparency.

You’re still early. The best yields happen in the first days, before TVL rises and APR stabilizes. Dive in now and maximize your returns while the turbo phase is still on.

👉 Join the Pools and Start Earning

Announcements

Token Metrics API Joins RapidAPI: The Fastest Way to Add AI-Grade Crypto Data to Your App

Token Metrics Team
5 min
MIN

The hunt for a dependable Crypto API normally ends in a graveyard of half-maintained GitHub repos, flaky RPC endpoints, and expensive enterprise feeds that hide the true cost behind a sales call. Developers waste days wiring those sources together, only to learn that one fails during a market spike or that data schemas never quite align. The result? Bots mis-fire, dashboards drift out of sync, and growth stalls while engineers chase yet another “price feed.”

That headache stops today. Token Metrics API, the same engine that powers more than 70 000 users on the Token Metrics analytics platform, is now live on RapidAPI—the largest marketplace of public APIs with more than four million developers. One search, one click, and you get an AI-grade Crypto API with institutional reliability and a 99.99 % uptime SLA.

Why RapidAPI + Token Metrics API Matters

  • Native developer workflow – No separate billing portal, OAuth flow, or SDK hunt. Click “Subscribe,” pick the Free plan, and RapidAPI instantly generates a key.

  • Single playground – Run test calls in-browser and copy snippets in cURL, Python, Node, Go, or Rust without leaving the listing.

  • Auto-scale billing – When usage grows, RapidAPI handles metering and invoices. You focus on product, not procurement.

What Makes the Token Metrics Crypto API Different?

  1. Twenty-one production endpoints

    Live & historical prices, hourly and daily OHLCV, proprietary Trader & Investor Grades, on-chain and social sentiment, AI-curated sector indices, plus deep-dive AI reports that summarise fundamentals, code health, and tokenomics.

  2. AI signals that win

    Over the last 24 months, more than 70 % of our bull/bear signals outperformed simple buy-and-hold. The API delivers that same alpha in flat JSON.

  3. Institutional reliability

    99.99 % uptime, public status page, and automatic caching for hot endpoints keep latency low even on volatile days.

Three-Step Quick Start

  1. Search “Token Metrics API” on RapidAPI and click Subscribe.
  2. Select the Free plan (5 000 calls / month, 20 request / min) and copy your key.
  3. Test:

bash

CopyEdit

curl -H "X-RapidAPI-Key: YOUR_KEY" \

     -H "X-RapidAPI-Host: tokenmetrics.p.rapidapi.com" \

     https://tokenmetrics.p.rapidapi.com/v2/trader-grades?symbol=BTC

The response returns Bitcoin’s live Trader Grade (0-100) and bull/bear flag. Swap BTC for any asset or explore /indices, /sentiment, and /ai-reports.

Real-World Use Cases

Use case

How developers apply the Token Metrics API

Automated trading bots

Rotate allocations when Trader Grade > 85 or sentiment flips bear.

Portfolio dashboards

Pull index weights, grades, and live prices in a single call for instant UI load.

Research terminals

Inject AI Reports into Notion/Airtable for analyst workflows.

No-code apps

Combine Zapier webhooks with RapidAPI to display live sentiment without code.

Early adopters report 30 % faster build times because they no longer reconcile five data feeds.

Pricing That Scales

  • Free – 5 000 calls, 30-day history.
  • Advanced – 20 000 calls, 3-month history.
  • Premium – 100 000 calls, 3-year history.
  • VIP – 500 000 calls, unlimited history.

Overages start at $0.005 per call.

Ready to Build?

• RapidAPI listing: https://rapidapi.com/tm-ai/api/token-metrics 

https://rapidapi.com/token-metrics-token-metrics-default/api/token-metrics-api1
• Developer docs: https://developers.tokenmetrics.com
• Support Slack: https://join.slack.com/t/tokenmetrics-devs/shared_invite/…

Spin up your key, ship your bot, and let us know what you create—top projects earn API credits and a Twitter shout-out.

Announcements

Crypto MCP Server: Token Metrics Brings One-Key Data to OpenAI, Claude, Cursor & Windsurf

Token Metrics Team
5 min
MIN

The modern crypto stack is a jungle of AI agents: IDE copilots that finish code, desktop assistants that summarise white-papers, CLI tools that back-test strategies, and slide generators that turn metrics into pitch decks. Each tool speaks a different protocol, so developers juggle multiple keys and mismatched JSON every time they query a Crypto API. That fragmentation slows innovation and creates silent data drift.

To fix it, we built the Token Metrics Crypto MCP Server—a lightweight gateway that unifies every tool around a single Multi-Client Crypto API. MCP (Multi-Client Protocol) sits in front of the Token Metrics API and translates requests into one canonical schema. Paste your key once, and a growing suite of clients speaks the same crypto language:

  • OpenAI Agents SDK – build ChatGPT-style agents with live grades
  • Claude Desktop – natural-language research powered by real-time metrics
  • Cursor / Windsurf IDE – in-editor instant queries
  • Raycast, Tome, VS Code, Cline and more

Why a Crypto MCP Server Beats Separate APIs

Consistency – Claude’s grade equals Windsurf’s grade.
One-time auth – store one key; clients handle headers automatically.
Faster prototyping – build in Cursor, test in Windsurf, present in Tome without rewriting queries.
Lower cost – shared quota plus $TMAI discount across all tools.

Getting Started

  1. Sign up for the Free plan (5 000 calls/month) and get your key: https://app.tokenmetrics.com/en/api
  2. Click the client you want to setup mcp for: smithery.ai/server/@token-metrics/mcp or https://modelcontextprotocol.io/clients

Your LLM assistant, IDE, CLI, and slide deck now share a single, reliable crypto brain. Copy your key, point to MCP, and start building the next generation of autonomous finance.

How Teams Use the Multi-Client Crypto API

  • Research to Execution – Analysts ask Claude for “Top 5 DeFi tokens with improving Trader Grades.” Cursor fetches code snippets; Windsurf trades the shortlist—all on identical data.
  • DevRel Demos – Share a single GitHub repo with instructions for Cursor, VS Code, and CLI; workshop attendees choose their favorite environment and still hit the same endpoints.
  • Compliance Dashboards – Tome auto-refreshes index allocations every morning, ensuring slide decks stay current without manual updates

Pricing, Rate Limits, and $TMAI

The Crypto MCP Server follows the core Token Metrics API plans: Free, Advanced, Premium, and VIP up to 500 000 calls/month and 600 req/min. Paying or staking $TMAI applies the familiar 10 % pay-in bonus plus up to 25 % staking rebate—35 % total savings. No new SKU, no hidden fee.

Build Once, Query Everywhere

The Token Metrics Crypto MCP Server turns seven scattered tools into one cohesive development environment. Your LLM assistant, IDE, CLI, and slideshow app now read from the same real-time ledger. Copy your key, point to MCP, and start building the next generation of autonomous finance.

• Github repo: https://github.com/token-metrics/mcp

👉 Ready to build? Grab your key from https://app.tokenmetrics.com/en/api

👉 Join Token Metrics API Telegram group  

Step-by-step client guides at smithery.ai/server/@token-metrics/mcp or https://modelcontextprotocol.io/clients — everything you need to wire Token Metrics MCP into Open AI, Claude, Cursor, Windsurf and more.

Research

Unlock Smarter Trades: Explore the All-New Token Metrics Market Page for Crypto Signal Discovery

Token Metrics Team
4 min
MIN

In the fast-paced world of crypto trading, timing is everything. One small delay can mean missing out on a breakout — or getting caught in a dump. That’s why we’ve completely redesigned the Token Metrics Market Page for 2025, bringing users faster access to the most accurate crypto trading signals powered by AI, on-chain analysis, and proprietary data science models.

This isn’t just a design refresh. It’s a full rethinking of how traders interact with data — with one goal in mind: make smarter trades faster.

Why Interface Matters in 2025’s Data-Driven Crypto Market

Crypto has matured. In 2025, the market is no longer driven by just hype or tweets. The best traders are using quantitative tools, AI signals, and real-time on-chain intelligence to stay ahead. And the Token Metrics Market Page is now built to meet that standard.

Gone are the days of switching between ten different platforms to get a complete view of a token. With the new Market Page, everything you need to make a data-backed trading decision is at your fingertips — no noise, no fluff, just high-signal information.

What’s New: Market Page Features That Give You an Edge

🔥 High-Performing Signals Front and Center

At the top of the redesigned Market Page, we’ve surfaced the week’s most compelling bullish and bearish crypto signals. These aren’t just based on price action — they’re curated using a powerful blend of AI, technical analysis, momentum trends, and on-chain activity.

Take Launch Coin week. It’s been topping the bullish charts due to a sharp uptick in volume and social traction — even though the price has begun to stabilize. Our platform caught the early signal, helping users ride the wave before it showed up on mainstream crypto news feeds.

Every token featured here has passed through our proprietary signal engine, which incorporates:

  • Token Metrics Trader Grade (short-term technical outlook)
  • Investor Grade (longer-term fundamentals)
  • Volume & Liquidity metrics
  • Community sentiment and social velocity
  • Exchange and VC backing

The result? You don’t just know what’s pumping — you know why it’s moving, and whether it’s likely to hold.

🧠 Smarter Filtering and Custom Dashboards

Want to isolate tokens in the DeFi space? Looking for only high-grade bullish signals on Ethereum or Solana? With new filtering options by sector, signal strength, and chain, you can zero in on the exact types of trades you're looking for — whether you're a casual trader or running a portfolio strategy.

This personalized dashboard experience brings hedge-fund-grade analytics to your fingertips, democratizing access to sophisticated data tools for retail and pro traders alike.

📉 Data Visuals at a Glance

Every token card on the Market Page now comes with a visual snapshot showing:

  • Recent price movement
  • Momentum trends
  • Short-term vs. long-term grades
  • Signal performance over time

No need to deep-dive into separate pages unless you want to — Token Metrics puts quick visual context right where you need it to reduce friction and increase speed.

📱 Mobile-Optimized for Trading on the Go

We know many users monitor the market and execute trades from their phone. That’s why we’ve ensured the entire Market Page is fully mobile-responsive, optimized for fast swipes, taps, and decisions without losing any key insights.

With Token Metrics, your next trade idea can start while you’re commuting, grabbing coffee, or even mid-conversation at a crypto meetup.

The Token Metrics Advantage: AI-Powered Crypto Trading in Real-Time

This redesign is just one piece of the broader Token Metrics vision — making AI-driven crypto trading accessible to everyone.

If you’re serious about catching the next 10x altcoin, surviving market crashes, or just improving your signal-to-noise ratio, here’s why thousands of crypto traders choose Token Metrics:

  • Real-time trading signals for 6,000+ tokens
  • AI-generated Trader and Investor Grades
  • Market signals backed by 80+ data points
  • Daily updates from our deep-dive research AI
  • Integrated with self-custody workflows
  • Trusted by analysts, devs, and hedge funds

Our users aren’t just following the market — they’re leading it.

Use Case: How Traders Are Winning with Token Metrics

One of our users recently shared how they caught a 47% pump on an obscure DePIN token by acting on a Buy Signal that showed up in the Market Page’s Bullish section three days before the breakout. The token had minimal social chatter at the time, but our models flagged rising volume, strong fundamentals, and a breakout formation building on the technical side.

Stories like this are becoming common. With every new feature and dataset added to Token Metrics, users are getting smarter, faster, and more confident in their crypto trades.

What’s Next for the Market Page

This is just the beginning. Coming soon to the Market Page:

  • 💡 Auto-alerts based on your saved filters
  • 📊 Historical signal performance analytics
  • 🛠️ Integrations with our API for power users
  • 🧵 Narrative filters based on trending themes (AI, DeFi, Memes, RWA, etc.)

We’re building the most intelligent crypto trading assistant on the web — and the new Market Page is your window into it.

Final Thoughts: Don’t Just React — Predict

In crypto, being early is everything. But with thousands of tokens and hundreds of narratives, knowing where to look can be overwhelming.

The redesigned Token Metrics Market Page removes the guesswork.

By giving you AI-powered insights, real-time signals, and actionable visualizations, it transforms your screen into a decision-making engine. Whether you’re day trading or managing a long-term altcoin portfolio, the right data — surfaced the right way — gives you the edge you need.

Visit the new Market Page today, and see why 2025’s smartest crypto traders are making Token Metrics their go-to tool for navigating this volatile, opportunity-packed market.

Ready to Trade Smarter?

Explore the new Market Page

Want the signal before the crowd?

Try Token Metrics free and get instant access to:

  • AI Signals
  • Investor and Trader Grades
  • Market Timing Tools
  • Bullish and Bearish Alerts

Because in crypto, data is the new alpha — and Token Metrics helps you unlock it.

Research

Launchcoin, Hype Cycles, and the Power of Crypto Trading with Token Metrics

Token Metrics Team
4 min
MIN

In the fast-moving world of crypto, narratives can generate staggering returns — but they can also evaporate just as quickly. Launch Coin, one of 2025’s most talked-about tokens, is a perfect case study in how trends emerge, peak, and fade — and why having the right data matters more than ever for successful trading.

At its height, Launch Coin delivered an eye-popping 35x return, capturing the full attention of retail traders, influencers, and crypto-native venture funds alike. The premise was simple but powerful: users could launch a token simply by replying to a tweet. This radically lowered the barrier to token creation and empowered anyone with an idea to tokenize it — instantly.

But by late May, the token had corrected to 20x — still strong on paper, but signaling a definitive cooling of momentum. And with it, the social token narrative that once set Crypto Twitter on fire appears to be losing its grip. As traders reevaluate their exposure, this moment offers a broader lesson: the ability to detect the peak of a narrative is as important as catching its beginning.

The Rise of Launch Coin: What Made It Explode

Launch Coin arrived at just the right time.

  • The market was hungry for new ideas.
  • Token infrastructure had become easier than ever.
  • Crypto influencers were eager to test new engagement mechanics.

The combination of virality, accessibility, and novelty made Launchcoin irresistible. Its core feature — allowing users to tokenize ideas from social media — felt like the next evolution of community-building and creator monetization.

But more than the technology, it was the narrative that did the heavy lifting. In crypto, narratives are often the fuel that turns good ideas into short-term trading frenzies. And in Launchcoin’s case, the market piled in, creating the kind of momentum rarely seen outside meme coin season.

What the Drop to 20x Really Means

From a pure return standpoint, Launch Coin is still a winner. But price alone doesn’t tell the full story. The sharp retrace from its peak indicates a critical shift: interest is waning, even if believers remain vocal.

This kind of transition is common in crypto. We’ve seen it before:

  • Meme tokens like $DOGE and $PEPE exploding, then cooling.
  • NFT profile pictures dominating in 2021, then fading in 2022.
  • Yield farming innovations gaining traction, only to collapse under unsustainable tokenomics.

Launchcoin fits the same pattern. The rapid rise of token creation without friction led to a flood of low-quality projects, diluting excitement and prompting serious traders to rotate out. Today’s pullback reflects narrative fatigue — a critical turning point for traders.

Lessons from the Launch Coin Cycle — and How Token Metrics Helps You Trade Smarter

1. Narratives are powerful — but data wins trades

Many traders chase stories. But seasoned traders look for signals — the objective indicators that show when momentum is truly shifting. Token Metrics helps you cut through the noise by surfacing:

  • Trader Grade — based on short-term technicals, momentum, and volatility
  • Investor Grade — based on long-term fundamentals like liquidity, VC presence, and on-chain activity
  • Bullish/Bearish AI Signals — built on 80+ real-time data points

For Launch Coin, Token Metrics flagged the beginning of signal deterioration weeks before the broader market realized. While social media was still buzzing, our models showed declining momentum, weaker volume, and slowing engagement — early warnings for savvy traders.

2. You must be agile when trading narrative-based tokens

One of the biggest challenges in crypto trading is knowing when to rotate. Launch Coin’s decline didn’t happen in a vacuum. As capital exited social tokens, we saw attention shift toward AI tokens, DeFi lending protocols, and real-world asset platforms.

Token Metrics tracks narrative shifts in real time. On our Market Page, users can filter trending bullish signals by:

  • Sector (AI, DeFi, Memes, RWAs)
  • Chain (Ethereum, Solana, Base)
  • Signal strength
  • Market cap tiers (Large-cap, Mid-cap, Degen)

This makes it easier to identify early movers, reposition capital, and avoid getting trapped in narratives that are losing steam.

3. Tokens tied to platforms, not just hype, are more sustainable

Another insight: many of the most successful long-term tokens are backed by infrastructure, not just ideas. Ethereum, Solana, Chainlink — these all power ecosystems. Launchcoin’s challenge is whether it can evolve from a fun gimmick into a lasting layer for social token infrastructure.

Token Metrics’ Investor Grade can help you evaluate this potential by analyzing:

  • Ecosystem traction
  • Developer activity
  • Exchange listings
  • Backer profiles
  • Community strength

By weighting these factors into its grade, Token Metrics helps users avoid being misled by short-term excitement and focus instead on tokens with staying power.

Trading with Token Metrics: A Competitive Edge in Every Market Cycle

The Launchcoin episode highlights one truth about crypto: timing and information make the difference between profit and loss. And in an ecosystem driven by volatility, Token Metrics is designed to be your advantage.

Here’s what traders gain by using Token Metrics:

  • 🔎 Real-time trading signals for thousands of tokens
  • 💹 AI-powered market insights — fast, clean, and actionable
  • 📈 Dynamic grades and rankings updated daily
  • 🧠 Narrative awareness with filters for rising themes
  • 🧰 Toolkits for beginners and pros alike

Whether you’re scalping new tokens or investing in long-term projects, Token Metrics provides the data, structure, and confidence you need to trade smarter.

Looking Forward: Where Does the Market Go Next?

As Launch Coin cools, traders are asking: what’s the next 10x narrative?

Right now, data suggests that AI agents, DeFi primitives, and multi-chain interoperability are gaining traction. On the Token Metrics platform, the top-ranking bullish signals this week include several tokens tied to machine learning infrastructure and decentralized lending vaults.

But don’t wait for a newsletter to tell you what’s trending.

Explore the Token Metrics Market Page, set your filters, track the signals, and ride the next wave before it peaks. Because in crypto, the early bird doesn’t just get the worm — it gets the alpha.

Final Word: Stay Curious, Stay Cautious — and Stay Informed

Narratives will always rise and fall. What matters is your ability to spot when a hype cycle is starting — and when it’s ending.

With Token Metrics, you get more than just indicators. You get a full platform designed to surface truth beneath the noise — helping you trade with conviction, not confusion.

The Launchcoin cycle is a reminder of how fast crypto moves — and how important it is to trade with insight, speed, and structure.

Explore the platform today at tokenmetrics.com, and don’t just follow the narrative — trade it.

Research

How to Find the Next 10x Crypto Token with Token Metrics

Token Metrics Team
4 min
MIN

Every crypto investor dreams of discovering that one hidden gem — the token that goes from unknown to unstoppable, delivering 10x or even 50x returns. But with over 25,000 cryptocurrencies on the market in 2025, the big question remains: how do you actually find the one that will moon before the crowd catches on?

That’s where Token Metrics steps in.

By combining AI-powered crypto signals, narrative filters, advanced grading systems, and deep-dive analytics, Token Metrics makes it easier than ever to identify high-potential projects early — and trade them with confidence.

Whether you’re a retail trader looking for your first big win, or a seasoned investor building a crypto portfolio, Token Metrics gives you the tools to make smarter, faster, and more profitable decisions.

The 10x Formula: What Really Drives Explosive Growth in Crypto?

Not every token is destined for greatness. But nearly every 10x token follows a pattern before it takes off. At Token Metrics, we’ve studied thousands of chart patterns, price trends, and fundamental indicators to isolate the key ingredients most 10x tokens share before they explode:

🔥 1. Bold Signal Trigger

These are early-stage AI signals generated when a token begins to show strong upside potential. Token Metrics’ AI tracks market data, price momentum, sentiment, and technical indicators to identify early breakout signals.

📈 2. High Trader & Investor Grades

  • Trader Grade reflects short-term price action, momentum, and volume.
  • Investor Grade scores long-term potential based on liquidity, backers, tokenomics, community traction, and fundamentals.

When both grades are high — especially above 80 or 90 — it’s often a green light.

🌐 3. Trending Narrative

Every bull run has its dominant themes: DeFi in 2020, NFTs in 2021, AI and Modular Chains in 2025. A token aligned with a current hot narrative is more likely to gain attention and capital inflow.

📊 4. Community Growth

Real traction shows up through social media engagement, Discord activity, Telegram volume, GitHub commits, and on-chain user growth. Token Metrics integrates this into its AI analysis to measure rising network effect.

Token Metrics in Action: The Launch Coin Case Study

To see this in action, let’s look at Launchcoin, one of the most explosive tokens of early 2025. Launchcoin allowed anyone to tokenize ideas through social media replies — making it the centerpiece of the creator token narrative.

It went from stealth mode to stardom in days, ultimately delivering a 35x return for users who caught it early. How?

  • ✅ It appeared on the Token Metrics Market Page with a bold signal.
  • Trader Grade > 90 indicated massive price momentum.
  • ✅ The token was embedded in the hot social token narrative.
  • ✅ Community activity on X (formerly Twitter) and Discord spiked rapidly.

Users who followed the early bold signal and confirmed it with high grades had the data needed to act decisively — and ride the wave before it crested.

Token Metrics Tools That Help You Spot the Next 10x

Token Metrics isn’t just a signal service — it’s a full-suite crypto analytics platform designed to help traders and investors discover, analyze, and act on opportunities before the crowd.

Here are the core tools that help you catch winners early:

🔍 1. Market Page

View a curated dashboard of the latest AI-generated bold signals, updated in real time. Filter by:

  • Signal strength
  • Trader or Investor Grade
  • Chain (Ethereum, Solana, Base, etc.)
  • Sector (AI, DeFi, Gaming, Modular, Memecoins)
  • ROI since signal

This is your front-line tool for finding high-upside tokens before they trend on social media or exchanges.

📄 2. Token Detail Pages

Dig deeper into any token with complete analysis, including:

  • Grade breakdowns (with reasoning)
  • Historical signal performance
  • Price charts with annotated buy/sell points
  • Narrative classification
  • Community sentiment metrics

These pages help you validate and compare tokens before jumping in.

🧠 3. Narrative Filters

Narratives drive attention and capital in crypto. Use AI-driven filters to discover tokens within hot themes like:

  • AI Agents
  • Modular Chains
  • RWA (Real World Assets)
  • DeFi Lending
  • Gaming Tokens
  • Social & Creator Tokens

Narrative filtering helps you spot which sectors are heating up and which tokens are leading the charge.

🚀 4. Top Gainers Tab

Get a real-time feed of tokens that are climbing the ranks fastest based on signal performance, volume, and momentum. Great for catching short-term breakouts.

📬 5. Alerts and Watchlists

Set custom alerts for:

  • Grade thresholds
  • New bold signals
  • Tokens entering Top Gainers
  • Narrative rotations

This ensures you never miss a move — even if you’re not logged in 24/7.

Tips for Finding the Next 10x Crypto Token

Using Token Metrics gives you an edge, but timing and execution still matter. Here are key strategies:

Act Fast on Bold Signals

Early bold signals are where most 10x gains start. Check the Market Page daily and move quickly when grades align.

Use Grade Confirmation

Don’t just chase price action. Look for both Trader and Investor Grades above 80 — ideally above 90 for the biggest potential moves.

Monitor Narrative Cycles

Tokens in trending narratives often rise faster. Track narrative heatmaps on Token Metrics to stay aligned with the market zeitgeist.

Revisit Signals Daily

Momentum can shift fast. A token might go from a bold signal to a breakout in 24–48 hours. Stay on top of daily updates.

Diversify Across Narratives

Don’t go all-in on one theme. Spread bets across AI, DeFi, Memes, and Infrastructure to capture multiple emerging waves.

Token Metrics: Making Crypto Trading Easier, Smarter, and More Profitable

The crypto markets can be overwhelming — with noise, scams, and hype around every corner. Token Metrics simplifies the process by turning complex data into actionable insights.

Whether you're looking to catch your first 10x, avoid false pumps, or build a smart long-term crypto portfolio, Token Metrics gives you:

  • 🧠 Clarity in a noisy market
  • 📊 Data-backed conviction instead of guessing
  • Speed in identifying trends before they peak
  • Confidence to buy, hold, or exit with precision

With tools designed for traders, investors, and builders alike, Token Metrics turns analytics into alpha.

Final Thoughts: Don’t Chase Pumps — Predict Them

The next 10x token is already out there. It might be trading under the radar today, quietly showing early signs — a bold signal, strong grade, growing community.

Token Metrics is your map.

You don’t need to follow the crowd. With the right tools and discipline, you can trade ahead of the market, find the next Launchcoin, and position yourself for outsized gains.

Start your journey now at tokenmetrics.com — because in crypto, alpha favors the informed.

Research

How Token Metrics Spotted HYPE Before the Breakout — And Why It Matters for Every Crypto Trader

Token Metrics Team
4 min
MIN

The crypto market has been a rollercoaster lately.

Bitcoin is dipping. Altcoins are bleeding. Sentiment across the board is skittish. Fear is gripping retail traders — and in times like these, many are unsure where to turn, what to buy, or when to hold back.

But not everyone’s losing.

Some traders are still finding wins. One example? Hyperliquid (HYPE) — a standout performer in April 2025. And here’s the kicker: Token Metrics called the move before it happened.

While most traders were distracted by meme coins or frozen in fear, Token Metrics users were riding a +51.8% breakout, armed with AI-driven insights and data-backed confidence. This blog breaks down what happened, how Token Metrics spotted the trade before the crowd, and what tools you can use today to find the next HYPE-level breakout before it happens.

The Hyperliquid Surge: What Happened?

On April 14, while much of Crypto Twitter was silent on HYPE, Token Metrics issued a bullish signal on the token. The platform’s AI-powered Trader Grade identified a strong setup forming — based on technical indicators, rising volume, and early momentum shifts.

That signal marked the beginning of a +51.8% price surge, which saw HYPE peak at $38.50 before a broad market correction pulled it back to ~$32.40.

Even with the correction, traders who acted on the early signal locked in solid profits, exited smart, or are now watching for the next move with eyes wide open — guided by grades, not guesswork.

Why Token Metrics Got It Right — When Others Missed It

While most platforms react to price action after it happens, Token Metrics is built to anticipate movement before it’s obvious. Here’s how:

Technical Momentum Detection

The Trader Grade analyzes short-term price action, RSI trends, MACD crossovers, breakout patterns, and dozens of other technical indicators. HYPE’s chart showed tightening consolidation and rising buy volume — and TM’s systems flagged it in real time.

Volume Spike Recognition

One of the earliest clues in any breakout is an uptick in volume. Token Metrics identifies surging liquidity that precedes breakouts — something that traditional screeners miss or catch late.

Narrative Tracking

Hyperliquid was part of a subtle but growing "on-chain perpetuals" narrative — a theme most traders weren’t tracking yet. TM’s AI-powered narrative filters helped surface HYPE as an early player in a trending category.

Signal Strength Confidence

Token Metrics doesn’t just throw out signals randomly. The platform assigns confidence scores based on data quality, historical performance, and AI pattern recognition. HYPE didn’t just look good — it looked statistically strong.

Current Situation: Pullback or Setup?

After topping at $38.50, HYPE retraced — now sitting about 15.8% below its high. Some might see weakness. But Token Metrics helps traders read beyond the price:

  • 📈 Trader Grade still says “Buy” — meaning short-to-mid-term bullish momentum is intact.
  • 🟡 Investor Grade is Neutral — a smart, cautious stance until more long-term data emerges.
  • 🔍 Key Level: $32 — this is the zone bulls need to defend to keep the trend alive.

This context is what makes Token Metrics invaluable. While the crowd panics, TM users stay informed, balanced, and ready.

Token Metrics in Action: Trading with Data, Not Emotion

Let’s zoom out. Why does this matter for your trading journey?

Most traders operate on emotion, social media chatter, or FOMO. Token Metrics flips that model on its head — giving you a complete data-driven crypto trading toolkit:

🧠 AI-Powered Trader Grades

These grades score tokens on a 0–100 scale based on short-term technical momentum. A Trader Grade above 80 often precedes a strong move — as seen with HYPE.

📊 Investor Grades for Long-Term Confidence

Built from 80+ on-chain and off-chain data points — including liquidity, tokenomics, VC backers, exchange listings, community engagement, and developer activity.

📈 Real-Time Market Signals

Get alerted when a new bullish or bearish signal is triggered. These alerts are based on pattern recognition, performance history, and current price action.

🌐 Narrative Filters

Narratives drive price — from DeFi Summer to AI Agent tokens. TM helps you stay on top of evolving themes and find the tokens leading those trends early.

🔔 Alerts & Watchlists

Set custom alerts for grade movements, bold signals, or top gainer movements — so you never miss a trade even when you’re not glued to the screen.

Key Trading Benefits of Using Token Metrics

Let’s break it down: Why use Token Metrics instead of trading blindly?

1. Spot Breakouts Early

Tools like the Market Page and Top Gainers tab help you spot tokens heating up — before they explode. You won’t be the one buying at the top anymore.

2. Avoid FOMO and Bad Buys

TM’s objective grades help filter out low-quality tokens. You can avoid chasing scams or hype-based pumps with no foundation.

3. Simplify Your Research

Instead of spending hours flipping through charts and Twitter threads, Token Metrics gives you instant, high-signal data — all in one place.

4. Trade With Confidence

Whether you’re swing trading or building a long-term bag, the Trader and Investor Grades help validate (or invalidate) your bias.

5. Stay Ahead of Market Rotations

The crypto market rotates fast. Token Metrics surfaces where capital is flowing — and which narratives are gaining strength — so you can rotate with it.

What to Do Next: Trade the Signal, Not the Crowd

Looking ahead, HYPE’s next move depends on what happens at the $32 support zone:

  • ✅ If it holds: there’s room for upside continuation. The Trader Grade supports it.
  • ❌ If it breaks: eyes shift to $25 — a critical support where new buyers may step in.

Either way, Token Metrics users won’t be guessing. They’ll wait for the next signal — bullish or bearish — and make calculated moves based on real data.

This is the difference between reactive trading and strategic trading.

Final Takeaway: Token Metrics Helps You Trade Smarter, Not Harder

The HYPE breakout wasn’t luck. It was the result of acting on strong, data-backed signals before the crowd caught on.

If you’re tired of chasing pumps, panicking in drawdowns, or wondering why others always seem to find winners early, then it's time to level up.

With Token Metrics, you can:

  • 🔍 Spot early movers like HYPE
  • 📊 Trade with AI-powered confidence
  • 📈 Get in before the trend — and exit before the crash
  • 🧠 Make every trade a calculated decision

Ready to Catch the Next HYPE?

Join thousands of traders using Token Metrics to find breakout tokens before they pump.

👉 Explore the platform now at tokenmetrics.com
👉 Get real-time signals, bold alerts, and daily data updates
👉 Trade with structure — not speculation

Because in crypto, the edge goes to the trader with information, not emotion.

Research

Solana Price Action: Will the Bulls Regain Control? Token Metrics Signals Offer Clues

Token Metrics Team
4 min
MIN

Solana has been one of the most closely watched altcoins in the 2025 crypto cycle. With its blazing speed, developer activity, and expanding DePIN ecosystem, Solana has remained on every smart investor’s radar. But with the broader market pulling back sharply — and Bitcoin dipping below $105K — traders are asking: Is Solana still a buy?

Token Metrics' AI-powered tools offer critical insights into this volatile moment.

April's Bullish Signal Paid Off
Token Metrics’ proprietary indicator turned bullish on Solana on April 19, when the price was just $138.18. That signal wasn’t just noise. Within a month, Solana surged by 33.1%, reaching $184 by May 23.

This kind of real-time, data-driven signal is exactly why traders are turning to Token Metrics. Rather than guessing or chasing hype, our platform delivers objective, AI-backed alerts that help traders enter early and exit intelligently.

The Pullback: Market-Wide, Not Solana-Specific
Fast forward to today, and the story has changed. Solana is undergoing a major pullback, largely driven by the overall market correction. Bitcoin’s slide below $105K has dragged most altcoins down, Solana included.

However, Token Metrics' Trader Grade for Solana is now 'Neutral' — not bearish. That’s a crucial distinction. While momentum has cooled, our system is not yet signaling a full reversal. That means there’s still room for recovery.

Technical Outlook: The $160 Level is Critical
Technical analysis highlights a key battleground at $160. If bulls can reclaim this level in the near term, the uptrend could resume. Failure to hold above it, however, could open the door for deeper losses.

Token Metrics users can monitor these levels in real-time with our dynamic charts, trend indicators, and updated market signals.

What Traders Should Watch Next

  • Market Signal Shift: If the Token Metrics market signal flips to bearish, it’s a red flag. Until then, volatility may still offer upside.
  • $160 Breakout: This is the technical threshold bulls must defend.
  • Volume and Sentiment: A spike in volume or positive narrative news could signal a reversal.

Conclusion
Solana remains a high-potential asset — but trading it without real-time analytics in this environment is risky. Token Metrics doesn’t just tell you what’s happening; it shows why it’s happening and what to do next.

Join Token Metrics today to access AI-powered trading signals, risk analysis, and the tools to trade crypto like a pro — even in uncertain markets.

Thank you! Your submission has been received!
Oops! Something went wrong while submitting the form.

Crypto Basics Blog

Research Blogs

Announcement Blogs

Unlock the Secrets of Cryptocurrency

Sign Up for the Newsletter for the Exclusive Updates