Text Link
Text Link
Text Link
Text Link
Text Link
Thank you! Your submission has been received!
Oops! Something went wrong while submitting the form.

Stop Guessing, Start Trading: The Token Metrics API Advantage

Announcements

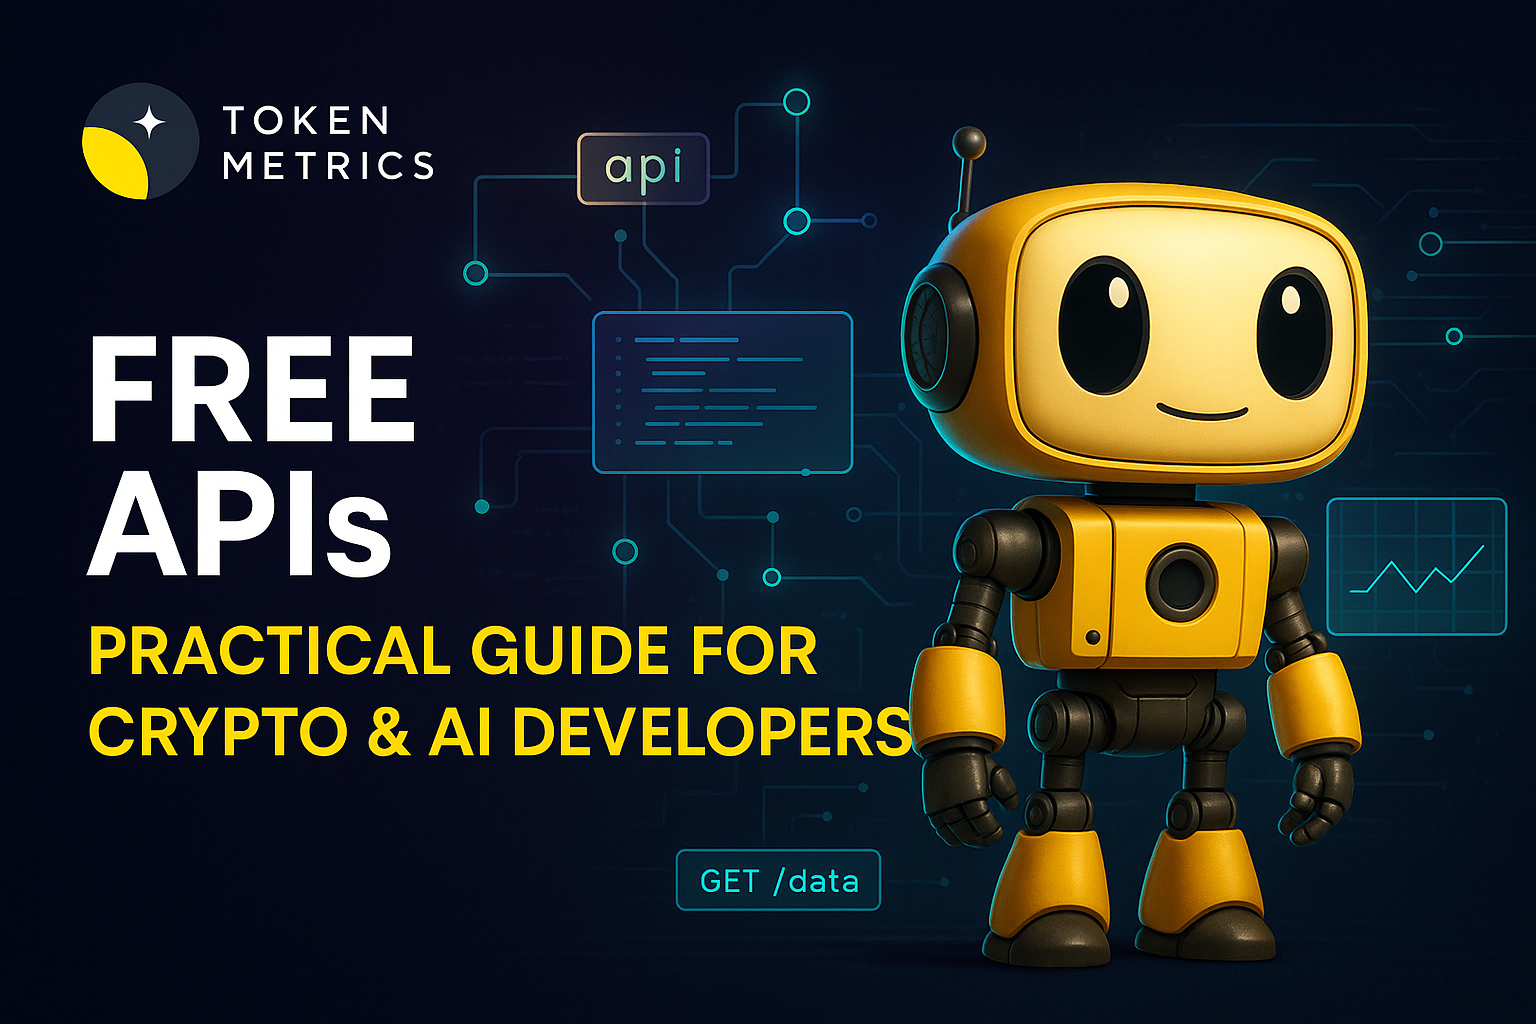
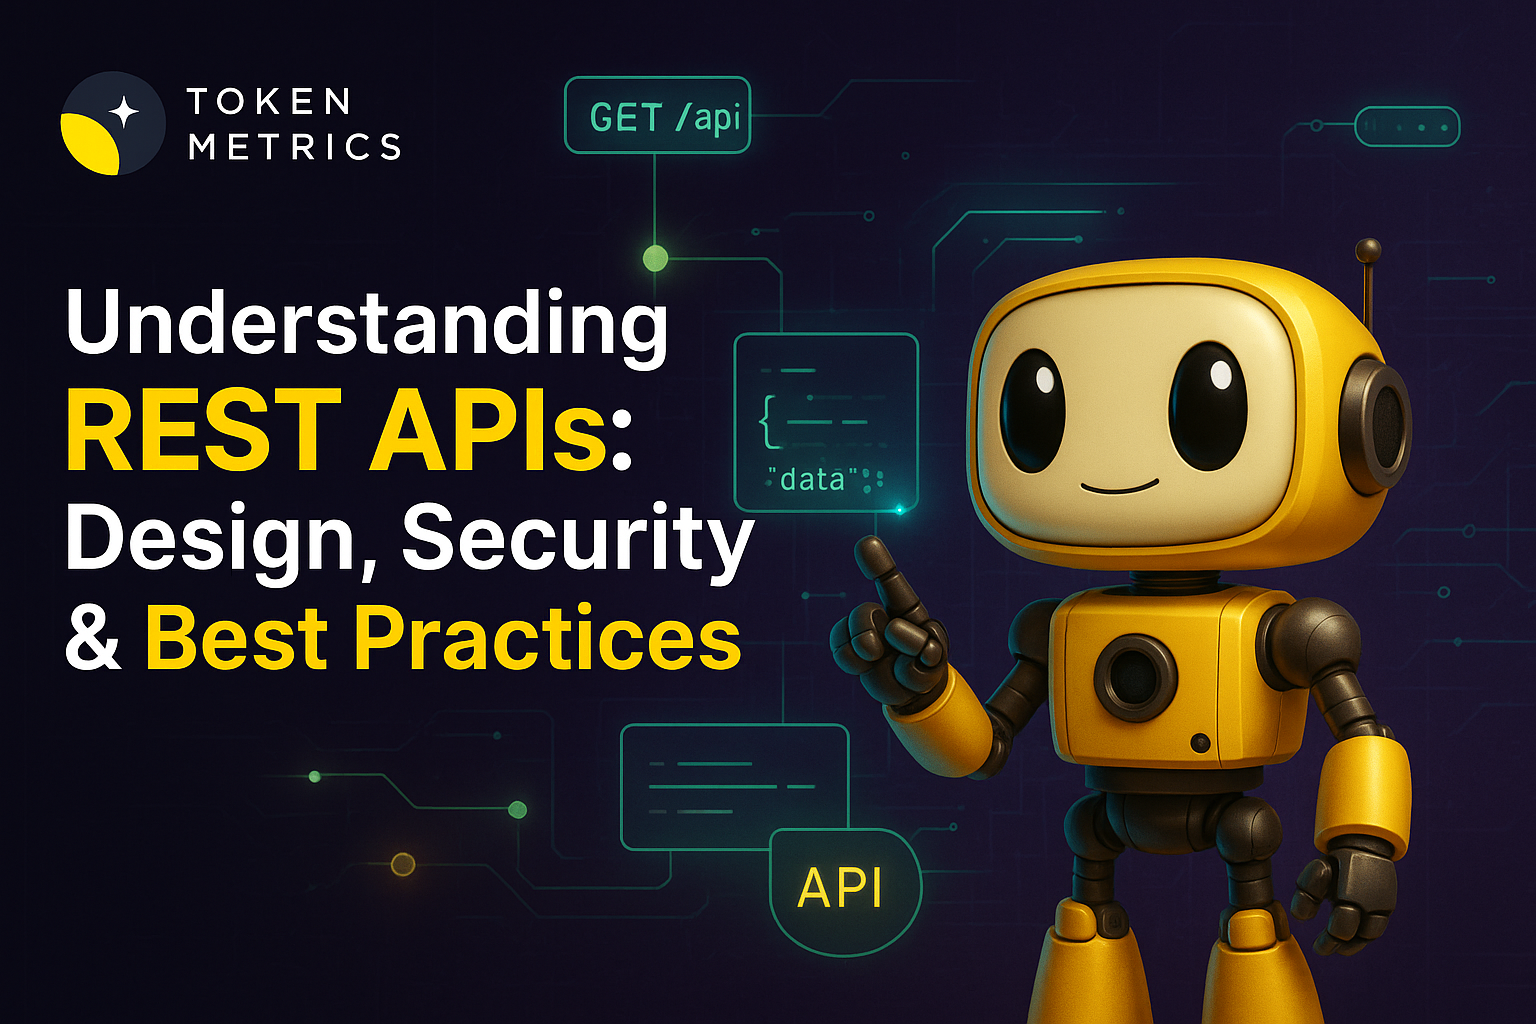
Big news: We’re cranking up the heat on AI-driven crypto analytics with the launch of the Token Metrics API and our official SDK (Software Development Kit). This isn’t just an upgrade – it's a quantum leap, giving traders, hedge funds, developers, and institutions direct access to cutting-edge market intelligence, trading signals, and predictive analytics.

Crypto markets move fast, and having real-time, AI-powered insights can be the difference between catching the next big trend or getting left behind. Until now, traders and quants have been wrestling with scattered data, delayed reporting, and a lack of truly predictive analytics. Not anymore.

The Token Metrics API delivers 32+ high-performance endpoints packed with powerful AI-driven insights right into your lap, including:

  • Trading Signals: AI-driven buy/sell recommendations based on real-time market conditions.
  • Investor & Trader Grades: Our proprietary risk-adjusted scoring for assessing crypto assets.
  • Price Predictions: Machine learning-powered forecasts for multiple time frames.
  • Sentiment Analysis: Aggregated insights from social media, news, and market data.
  • Market Indicators: Advanced metrics, including correlation analysis, volatility trends, and macro-level market insights.

Getting started with the Token Metrics API is simple:

  1. Sign up at www.tokenmetrics.com/api
  2. Generate an API key and explore sample requests.
  3. Choose a tier–start with 50 free API calls/month, or stake TMAI tokens for premium access.
  4. Optionally–download the SDK, install it for your preferred programming language, and follow the provided setup guide.

At Token Metrics, we believe data should be decentralized, predictive, and actionable. 

The Token Metrics API & SDK bring next-gen AI-powered crypto intelligence to anyone looking to trade smarter, build better, and stay ahead of the curve. With our official SDK, developers can plug these insights into their own trading bots, dashboards, and research tools – no need to reinvent the wheel.

Research

Regime Switching in Crypto: Participate in Upside, Sit Out Drawdowns (2025)

Token Metrics Team
5
MIN

Timing crypto cycles is inherently challenging. Market volatility can work both ways: investors seek broad upside potential during bullish phases, yet require the discipline to step aside when market trends and liquidity conditions reverse. A regime switching crypto index precisely addresses this need—employing rules-based mechanisms to adjust market exposure during different conditions. Our flagship implementation, Token Metrics Global 100, exemplifies this approach: it dynamically shifts between a top-100 crypto basket during bullish periods and stablecoins during downturns, with weekly rebalancing, transparent holdings, and verifiable transactions. Designed for investors who prefer market exposure without the need to micromanage individual tokens or succumb to emotional biases, this system offers a disciplined approach to crypto participation.

Why Indices Matter in October 2025

Crypto markets tend to operate in distinct regimes—prolonged phases of risk-on momentum followed by swift drawdowns that can negate earlier gains. Those exploring "regime switching," "weekly rebalancing," or "crypto index" strategies seek frameworks that are straightforward, practical, and easy to implement.

Definition (for snippets):

Regime switching in crypto refers to a rules-based portfolio approach that adjusts exposure based on market conditions—rotating between a diversified assortment of tokens in uptrends and moving into stablecoins during declines.

Why now:

  • Cycle asymmetry: Capturing trending phases while minimizing drawdowns can significantly influence long-term performance.
  • Operational burden: Manual rebalancing across multiple tokens increases errors and delays; a standardized, rules-based process reduces these issues.
  • Clarity: Real-time transparency into holdings, rationale, and changes enhances confidence and ease of management.

How the Token Metrics Global 100 Index Works

Regime switching: During bullish periods, the index holds the top-100 cryptocurrencies by market cap across sectors and chains. In bearish conditions, it exits to stablecoins and waits for an upward signal to re-enter.

Weekly rebalancing: The index updates constituent weights based on market-cap rankings and liquidity metrics, adjusting on a set schedule.

Transparency: The index employs defined rules, with visual tools like gauges, treemaps, and logs that allow users to verify holdings and changes.

What you’ll see upon launch:

Price tile, list of 100 tokens, clear indication of weekly rebalancing, and a simplified buy flow supported by a self-custodial wallet. You can review the strategy and rules at a glance.

Benefits at a Glance (Why This Beats DIY)

  • Rules, not vibes: Automated regime logic minimizes emotional trading.
  • Fewer operational mistakes: Single, streamlined process replaces multiple manual trades across platforms.
  • Discipline in switching: Strict rotation into stablecoins during downturn signals eliminates second-guessing.
  • Visible slippage & fees: Estimated gas, platform fee, and minimum expected value are shown before trade confirmation.
  • Full visibility: Interactive holdings treemaps, transaction logs, and real-time data keep you informed.
  • Weekly updates: Regular rebalancing aligns the index with current market conditions.

Step-by-Step: How to Get Early Access (Waitlist)

  1. Open the Token Metrics Indices hub.
  2. Find the TM Global 100 index and tap "Join Waitlist."
  3. Enter your email to receive notifications at launch.
  4. (Optional) Connect your wallet to streamline the buy process on day one.
  5. On launch day, receive an email alert; you can review Gauge → Strategy → Holdings quickly.
  6. Confirm your wallet, review fees/slippage, and purchase the index, then track your position in "My Indices."

Discover crypto benefits with disciplined rebalancing—join the waitlist to be among the first to trade the TM Global 100.

Decision Guide: Is This Right for You?

  • Hands-Off Allocator: Prefer broad market exposure paired with rules-based discipline?
  • Active Trader: Use this index as a core, with room for satellite positions.
  • TM Member/Prospect: Value transparent, research-backed rules over discretionary guesswork.
  • Crypto Newcomer: Seek a simple, one-click approach with weekly updates.
  • Time-Strapped Professional: Minimize operational overhead and maximize clarity.
  • Skeptical of forecasts: Favor process, signals, and scheduled rebalancing over predictions.

FAQs

What is a regime switching crypto index?

A rules-based portfolio that adjusts exposure between a diversified token basket during bullish markets and stablecoins during bearish phases, based on predefined signals. The Token Metrics Global 100 implements this by focusing on the top-100 tokens with an integrated stablecoin switch in downturns.

How often does the index rebalance?

Rebalancing occurs weekly to reflect latest rankings and liquidity thresholds. However, regime shifts can happen outside the scheduled rebalancing when market signals change abruptly.

What triggers the move to stablecoins?

A proprietary market signal detects bearish conditions, prompting the index to exit crypto positions into stablecoins, awaiting a bullish re-entry signal.

Can I fund with USDC or fiat?

Funding occurs via an embedded self-custodial wallet supporting major chains; options depend on your wallet and region. USDC payouts are supported upon sale. Regional and asset availability may vary.

Is the wallet custodial?

No. The embedded wallet is self-custodial, giving you full control over your keys and funds.

How are fees shown?

Before confirming a trade, estimated gas costs, platform fees, and maximum slippage are displayed, along with the minimum expected value.

How do I join the waitlist?

Visit the Token Metrics Indices hub, open the TM Global 100, and tap "Join Waitlist." You will receive a notification at launch.

Security, Risk & Transparency

  • Self-custody first: You control your keys and funds through an embedded smart wallet.
  • Pre-trade transparency: Fees, slippage, and holdings are previewed before any transaction.
  • Logs and records: Strategy, holdings, and transaction histories are visible on the platform.
  • Regime logic limitations: Signals can be wrong; market gaps and spreads may impact outcomes.
  • Regional considerations: Availability and supported chains vary geographically.

Crypto markets are volatile and can experience value declines. Past performance does not predict future results. This content is intended for educational and research purposes only.

Conclusion

If you seek a disciplined, transparent method to participate in the crypto market while avoiding emotional pitfalls during downturns, the TM Global 100 offers a rules-based, weekly rebalanced solution. With comprehensive visibility into holdings and transactions, it enables a focused approach to market exposure without added anxiety.

Join the waitlist to be among the first to trade the TM Global 100.

Research

Top Crypto Prediction Markets: The Complete 2025 Guide to Trading the Future

Token Metrics Team
9
MIN

The prediction revolution is transforming crypto investing in 2025. From AI-powered price prediction platforms to blockchain-based event markets, today's tools help investors forecast everything from token prices to election outcomes with unprecedented accuracy.

With billions in trading volume and cutting-edge AI analytics, these platforms are reshaping how we predict, trade, and profit from future events. Whether you're forecasting the next 100x altcoin or betting on real-world outcomes, this comprehensive guide explores the top prediction tools dominating 2025.

Understanding Crypto Prediction Tools vs. Prediction Markets

Before diving in, it's crucial to distinguish between two types of prediction platforms:

  • Crypto Price Prediction Platforms (like Token Metrics) use AI and data analytics to forecast cryptocurrency price movements, identify promising tokens, and generate trading signals.
  • Event Prediction Markets (like Polymarket and Kalshi) are blockchain-powered platforms where users trade on real-world event outcomes—elections, sports, economic indicators, and yes, even crypto prices.

Both serve valuable but different purposes. Let's explore the top tools in each category.

The #1 Crypto Price Prediction Platform

Token Metrics - AI-Powered Crypto Intelligence Leader

Token Metrics stands as the premier AI-driven crypto research and investment platform, scanning over 6,000 tokens daily to provide data-backed predictions and actionable insights. With a user base of 110,000+ crypto traders and $8.5 million raised from 3,000+ investors, Token Metrics has established itself as the industry's most comprehensive prediction tool.

What Makes Token Metrics the Top Price Prediction Tool:

  • AI-Driven Analytics Engine: Token Metrics' AI and machine learning algorithms identify potential trends and predict future price movements by analyzing fundamental reports, code quality, sentiment analysis, moving averages, and support/resistance levels. The platform processes massive datasets 24/7 to spot opportunities before they go mainstream.
  • Comprehensive Scoring System: Every token receives both a Trader Grade (for short-term momentum) and Investor Grade (for long-term fundamentals) based on technical analysis, on-chain data, fundamental metrics, sentiment and social data, and exchange data.
  • Moonshot Discovery: The Moonshots feature uses AI to highlight daily tokens with 10x–100x potential before they hit major exchanges, giving investors early access to high-upside opportunities.
  • Real-Time Signals & Alerts: Get instant bullish and bearish alerts for major tokens, with custom notifications via email, Telegram, or Slack. Never miss a sudden market move or grade change.
  • Multi-Strategy Support: Whether you're HODLing long-term, swing trading, narrative investing, or hunting moonshots, Token Metrics provides tailored tools and indices for every strategy.
  • Deep Token Analytics: Access detailed insights including historical performance, wallet holder analysis, exchange listings, code quality assessments, and market sentiment tracking.

Why Token Metrics Ranks #1:

Unlike basic charting tools or single-metric analyzers, Token Metrics combines time series data, media news, regulator activities, coin events like forks, and traded volumes across exchanges to optimize forecasting results. The platform's proven track record and comprehensive approach make it indispensable for serious crypto investors in 2025.

Best For:

Investors and traders seeking AI-powered crypto price predictions, portfolio optimization, and early altcoin discovery.

Top Crypto Event Prediction Markets

1. Polymarket - The Largest Decentralized Prediction Market

Polymarket dominates the event prediction market space with unmatched liquidity and diverse betting opportunities.

  • Over $18.4 billion in trading volume, establishing market leadership
  • Built on Polygon for low fees and fast transactions
  • Trades in USDC stablecoin for price stability
  • Around 40% of sales volume from sports betting, 40% from crypto movement predictions
  • Open interest recently rose to around $170 million
  • No trading fees on transactions

What Sets It Apart: Polymarket proved its forecasting superiority when it accurately predicted election outcomes that traditional polls missed. The platform's user-friendly interface makes blockchain prediction markets accessible to mainstream audiences.

Best For: Event outcome betting, political predictions, sports betting, and crypto price speculation through binary markets.

2. Kalshi - The CFTC-Regulated Powerhouse

Kalshi has surged from 3.3% market share last year to 66% by September 2025, overtaking Polymarket as the trading volume leader.

  • First CFTC-regulated prediction market in the United States
  • Monthly trading volume hit approximately $1.3 billion in September 2025
  • Accepts crypto deposits (USDC, Bitcoin, Solana, Worldcoin) via ZeroHash
  • All markets settled in U.S. dollars
  • Fees up to 5% of profit, capped at $0.85 per contract

Recent Developments: Kalshi hired John Wang as Head of Crypto in August 2025 to drive blockchain integration, with plans to be on "every major crypto app and exchange within 12 months." The platform secured a massive $185 million Series C funding round and partnered with Robinhood for sports market expansion.

Best For: U.S. residents seeking regulated prediction markets with crypto deposit options and diverse event contracts.

3. Drift BET - Solana's Speed Champion

For traders demanding instant settlement and minimal fees, Drift BET represents the cutting edge of prediction markets on Solana.

  • Native Solana integration for near-instant finality
  • Multi-collateral support
  • Extremely low transaction costs
  • Growing ecosystem momentum

Why It Matters: By leveraging Solana's near-instant transaction finality, BET by Drift solves many scalability issues faced by Ethereum-based prediction markets, with low transaction fees making smaller bets feasible for wider audiences.

Best For: Solana-native traders and users prioritizing speed and low costs.

4. Augur - The Pioneering Protocol

Launched in 2018, Augur was the first decentralized prediction market, pioneering blockchain-based forecasting and innovative methods for settlement secured by the REP token.

  • Fully decentralized platform
  • REP token for market creation, rewards, and disputes
  • Augur Turbo version on Polygon for improved efficiency
  • Binary, categorical, and scalar market support

Legacy Impact: Augur v1 settled around $20 million in bets—impressive for 2018-19. While the DAO has dissolved, Augur's technological innovations now permeate the DeFi sphere.

Best For: Crypto purists seeking complete decentralization and censorship resistance.

5. Gnosis - The Infrastructure Powerhouse

With a market cap of $463 million, Gnosis is the biggest prediction market project by market capitalization.

  • Conditional Token Framework for tokenizing outcomes
  • GNO token for governance and staking
  • Gnosis Chain Layer 2 solution
  • Powers platforms like Omen and Azuro

Ecosystem Approach: Founded in 2015, Gnosis evolved into a multifaceted ecosystem encompassing decentralized trading, wallet services, and infrastructure tools beyond mere prediction markets.

Best For: Developers and platforms building custom prediction market applications.

Emerging Platforms

  • Robinhood Prediction Markets: Facilitated over 4 billion event contracts, including 2 billion in Q3 2025 alone. Seamlessly integrated into the Robinhood app, with a $0.01 commission + $0.01 exchange fee structure.
  • Myriad: Built on Abstract with promising points program, focusing on user rewards and engagement.
  • Crypto.com Prediction Trading: CFTC-regulated through Crypto.com Derivatives North America (CDNA), integrated with existing crypto exchange infrastructure.

How These Platforms Work Together

Smart investors often use Token Metrics for identifying which cryptocurrencies to invest in, then leverage prediction markets like Polymarket or Kalshi to hedge positions or speculate on specific price targets and events.

Example Strategy:

  1. Use Token Metrics to identify a token with strong Trader Grade and bullish AI signals
  2. Build a position in that token through AI trading for crypto or indices of your choice
  3. Use Token Metrics to bet on specific price milestones or related events
  4. Monitor Token Metrics alerts for exit signals

This combines the best of AI-driven price prediction with market-based event forecasting.

Why Prediction Platforms Are Exploding in 2025

Market Growth Trajectory: The prediction market sector is projected to reach $95.5 billion by 2035, with underlying derivatives integrating with DeFi protocols.

Key Growth Drivers:

  • AI & Machine Learning Advancement: Platforms like Token Metrics leverage increasingly sophisticated AI to process millions of data points, delivering predictions that outperform human analysts.
  • Regulatory Clarity: The 2024 U.S. election betting legalization and crypto-friendly policies under the Trump administration have opened floodgates for mainstream adoption.
  • Proven Accuracy: Prediction markets demonstrated superior forecasting during recent elections, while AI platforms like Token Metrics consistently identify moonshot tokens before mainstream discovery.
  • Institutional Interest: Kalshi attracted $1.4 billion in institutional capital in Q2 2025, signaling Wall Street's growing confidence in prediction infrastructure.
  • Sports Betting Expansion: Sports betting now drives significant volume, expanding prediction markets beyond politics and finance into entertainment.

Real-World Applications

For Crypto Investors: Use Token Metrics to identify high-potential tokens before they pump. Access AI-generated buy/sell signals for portfolio management. Discover narrative-driven investment opportunities early.

For Event Traders: Hedge crypto positions using prediction markets. Speculate on regulatory outcomes, exchange listings, or network upgrades. Trade sports and political events for diversified income.

For Analysts & Institutions: Aggregate market sentiment data for research. Access real-time forecasting for economic indicators. Build custom trading strategies using API integrations.

Risks and Considerations

For Price Prediction Platforms: No prediction tool is 100% accurate; past performance doesn't guarantee future results. AI models perform best with sufficient historical data. Market manipulation and black swan events can invalidate predictions.

For Prediction Markets: Regulatory uncertainty remains in many jurisdictions. Liquidity challenges can create volatility. Oracle failures could compromise settlement integrity. Tax implications require careful record-keeping.

The Future: AI + Blockchain Convergence

What's Coming: Expect deeper AI agent integration, automated portfolio management, and enhanced moonshot discovery as machine learning models become more sophisticated.

Prediction Market Expansion: Kalshi aims to integrate with every major crypto app within 12 months, while tokenization of positions and margin trading will create new financial primitives.

Cross-Platform Integration: Future platforms will likely combine Token Metrics-style AI prediction with Polymarket-style event markets in unified interfaces.

DeFi Integration: The prediction market derivatives layer is set to integrate with DeFi protocols to create more complex financial products.

Getting Started: Platform Recommendations

  • For Price Prediction & Portfolio Management:Token Metrics - Unmatched AI analytics, moonshot discovery, and comprehensive scoring
  • For U.S. Residents (Event Betting): → Kalshi - Regulatory compliance, crypto deposits, diverse contracts
  • → Robinhood - Simplest onboarding through existing app
  • For Maximum Liquidity (Event Betting): → Polymarket - Largest markets, best pricing, widest selection
  • For Speed & Low Fees: → Drift BET - Solana-powered efficiency
  • For Developers: → Gnosis - Infrastructure tools and frameworks
  • For Maximum Decentralization: → Augur - Censorship-resistant, community-governed

Conclusion: Predicting the Future Is Now Data-Driven

The era of blind speculation is over. Between AI-powered platforms like Token Metrics analyzing thousands of data points per second and blockchain-based prediction markets aggregating collective wisdom, today's investors have unprecedented tools for forecasting the future.

Token Metrics leads the charge in crypto price prediction with its comprehensive AI-driven approach, while platforms like Polymarket and Kalshi dominate event-based forecasting. Together, they represent a new paradigm where data, algorithms, and collective intelligence converge to illuminate tomorrow's opportunities.

Whether you're hunting the next 100x altcoin or betting on real-world events, 2025's prediction platforms put the power of foresight in your hands. The question isn't whether to use these tools—it's how quickly you can integrate them into your strategy.

The future is visible. Are you ready to profit from it?

Disclaimer: This article is for informational purposes only and does not constitute financial advice. All investing involves risk, including potential loss of capital. Price predictions and ratings are provided for informational purposes and may not reflect actual future performance. Always conduct thorough research and consult qualified professionals before making financial decisions.

Research

What Is a Crypto Index? Why Weekly Rebalancing Matters (2025)

Token Metrics Team
4
MIN

Understanding how to efficiently manage exposure in the dynamic world of cryptocurrency can seem daunting. Crypto indices provide a structured approach, helping investors and traders maintain diversified exposure without constant oversight. This article explores what crypto indices are, how they work, and why their rebalancing strategies are crucial in 2025.

What Is a Crypto Index?

A crypto index is a rules-based basket of digital assets that tracks a specific set of cryptocurrencies, such as the top-100 by market capitalization. These indices are designed to reflect broad market trends while reducing the complexity of individual asset management. They typically rebalance periodically to maintain consistent exposure, adapting to market fluctuations over time.

How Crypto Indices Work

The core mechanism involves a few key processes:

  • Rebalancing: At scheduled intervals, the index updates its holdings to reflect the latest top-ranked assets, adjusting weights accordingly.
  • Regime Switching: In bullish markets, the index holds the top assets; in bearish conditions, it shifts to stablecoins to preserve capital and reduce volatility.
  • Transparency and Strategy: The rules underpinning the index are openly documented, with regular updates logged for user confidence.

Benefits of Using Crypto Indices

Crypto indices offer several advantages:

  • Reduced Management Hassle: Automated rebalancing minimizes manual intervention and save time.
  • Risk Management: Scheduled rebalancing helps contain drift and maintain targeted exposure.
  • Disciplined Approach in Volatile Markets: Regime switches between assets and stablecoins provide a systematic response to market conditions.
  • Transparency and Accessibility: Clear holdings, transactions logs, and strategy rules foster trust and ease of auditing.
  • Ease of Entry: Users can swiftly engage via one-click investments, simplifying the process for new and experienced investors alike.

How to Get Early Access to a Crypto Index

Investors interested in accessing crypto indices can follow a straightforward process:

  1. Visit the dedicated crypto index hub, such as a platform offering structured indices.
  2. Join the waitlist through the provided option, usually by entering your email address.
  3. Optionally, connect your wallet to be prepared for the buy flow at launch.
  4. Receive notifications when the index is live, review fees, slippage, and confirm your investment.
  5. Monitor your holdings and rebalances via the platform’s dashboard, revisiting weekly for updates.

Decision Guide: Is This for You?

Crypto indices may suit different kinds of investors:

  • Passive Allocators: Those seeking broad market exposure without the hassle of managing individual tokens.
  • Disciplined Traders: Users who prefer rules-based systems, especially during market downturns where shifting to stablecoins is desirable.
  • Transparency Seekers: Investors who value clear logs, holdings, and systematic rebalancing.
  • Time-Constrained Participants: Those who want exposure but lack the time to manage multiple positions manually.

Understanding your trading style and risk appetite can help determine if a crypto index fits within your broader strategy.

Discover Crypto Gems with Token Metrics AI

Get Started For Free

FAQs

What is a crypto index?

A crypto index is a rules-based basket that tracks a defined set of assets (e.g., the top-100 by market cap), with a scheduled rebalance to keep exposure aligned. Token Metrics applies that idea and adds a regime switch to stablecoins.

How often does TM Global 100 rebalance?

Weekly. Constituents and weights update on schedule; if the market regime changes, the portfolio can switch between tokens and stablecoins outside that cadence.

What triggers the move to stablecoins?

A proprietary market signal. Bullish: hold the top-100 basket. Bearish: exit to stablecoins and wait for a re-entry signal.

Can I fund with USDC or fiat?

At launch, funding options including wallet-funding supported by the embedded smart wallet and supported chains; USDC payouts are available when selling. Details are available during the buy/sell process.

Is the wallet custodial?

No. The embedded wallet is self-custodial—you control your funds and keys.

How are fees shown?

Before confirming, you'll see estimated gas costs, platform fees, max slippage, and minimum expected value.

How do I join the waitlist?

Visit the Token Metrics indices hub, open TM Global 100, and tap “Join Waitlist.” We will notify you once trading opens.

Security, Risk & Transparency

Self-custody: Embedded smart wallet with user-controlled keys. Transparency: Clear rules, holdings Treemap, and transactions logs. Fees: Shown before confirmation. Limitations: Signals can be wrong, no performance guarantees. Availability may vary by region and device.

Disclaimer

Crypto is volatile and can lose value. Past performance does not predict future results. This article is for research and educational purposes only, not financial advice.

Recent Posts

No Item Found
Research

Top Crypto Trading Platforms in 2025

Token Metrics Team
10 min
MIN

Is the cryptocurrency market continues to mature, new technologies are emerging to give traders an edge. Among the most transformative is AI-powered crypto trading. From automating strategies to identifying hidden opportunities, AI is redefining how traders interact with digital assets.

In this guide, we’ll break down:

  • What is AI crypto trading?
  • What are the different types of cryptocurrency trading?
  • The top crypto trading exchanges and platforms, with Token Metrics as the leading AI crypto trading option.

What is AI Crypto Trading?

AI crypto trading refers to the use of artificial intelligence (AI), machine learning (ML), and data science techniques to make smarter, faster, and more informed trading decisions in the cryptocurrency markets.

These systems analyze vast datasets—price charts, market sentiment, technical indicators, social media trends, on-chain activity—to generate trading signals, price predictions, and portfolio strategies. The goal: remove emotion and bias from crypto trading and replace it with data-driven precision.

Some AI crypto trading tools offer:

  • Predictive analytics for token performance
  • Real-time trading signals based on pattern recognition
  • Automated execution of buy/sell orders based on predefined strategies
  • Portfolio optimization using volatility and correlation models
  • Sentiment analysis from Twitter, Reddit, and news feeds

AI is especially valuable in the 24/7 crypto markets, where human traders can’t keep up with constant volatility. With AI, traders can react instantly to market shifts and make decisions grounded in data—not gut feeling.

What Are the Types of Cryptocurrency Trading?

Understanding the major types of cryptocurrency trading is essential for choosing the right strategy—especially if you’re planning to use AI to assist or automate your trades.

1. Spot Trading

Spot trading is the simplest and most common form of crypto trading. You buy or sell a cryptocurrency at its current price, and the transaction settles immediately (or “on the spot”). Most traders begin here.

AI can assist by identifying ideal entry and exit points, evaluating token grades, and managing risk.

2. Futures Trading

Futures trading involves contracts that speculate on the future price of a cryptocurrency. Traders can go long or short, using leverage to amplify gains (and risks).

AI helps by identifying bullish or bearish trends, backtesting strategies, and automating trades with quantitative models that adapt to market changes.

3. Margin Trading

Margin trading allows users to borrow funds to increase their trade size. It’s risky but potentially more rewarding.

AI can reduce some of the risks by using real-time volatility data, calculating stop-loss levels, and dynamically adjusting positions.

4. Swing Trading

Swing traders hold positions for days or weeks, capturing short- to medium-term trends.

AI tools are ideal for swing trading, as they can combine technical indicators, market sentiment, and volume analysis to anticipate breakouts and reversals.

5. Day Trading

Day traders open and close positions within a single day, requiring rapid decision-making and constant monitoring.

Here, AI-powered bots can outperform humans by making thousands of micro-decisions per second, reducing slippage and emotional trading errors.

6. Algorithmic and Bot Trading

Algorithmic trading uses coded strategies to automate trades. AI takes this further by allowing the bot to learn and improve over time.

Token Metrics, for example, offers AI grades and indices that traders can plug into their own bots or use through the platform’s native AI strategies.

Top Cryptocurrency Trading Exchanges

When it comes to crypto trading platforms, there are two main categories:

  • Exchanges where you buy, sell, and hold crypto
  • Analytics platforms that help you decide what to trade and when

Below are some of the top cryptocurrency trading platforms in 2025—both exchanges and AI-powered tools—tailored to serious traders:

1. Token Metrics – The #1 AI Crypto Trading Platform

Token Metrics is not an exchange, but a crypto analytics and trading intelligence platform powered by AI. It offers:

  • Trader & Investor Grades (AI-powered scoring of tokens)
  • Bullish/Bearish Signals
  • Portfolio Strategies via AI Indices
  • Custom Alerts for price and grade movements
  • Data API for building AI trading bots

Token Metrics bridges the gap between raw data and actionable decisions. Whether you’re a beginner or a pro running algorithmic strategies, Token Metrics delivers the AI layer needed to outperform the market.

Traders use Token Metrics alongside centralized exchanges (like Binance or Coinbase) or DEXs to validate trades, identify top-performing narratives, and automate entry/exit based on AI signals.

2. Binance

Binance is the largest crypto exchange by volume, offering thousands of trading pairs, margin, and futures trading. While it doesn’t offer native AI tools, many traders integrate Binance with AI bots using their API.

Use Token Metrics + Binance together for AI-informed execution on a high-liquidity exchange.

3. Coinbase

Coinbase is ideal for retail investors and new traders. While it lacks advanced AI features, it’s a trusted fiat gateway.

Advanced users can subscribe to Coinbase Advanced or integrate with tools like Token Metrics to make smarter trading decisions.

4. Bybit

Bybit offers both spot and derivatives, plus social trading tools like copy trading. It’s popular with swing and leverage traders.

Combine Bybit with Token Metrics for AI-driven entry points on high-volatility setups.

5. Kraken

Kraken is known for strong security and a transparent track record. It supports spot, margin, and futures trading.

When paired with AI tools, Kraken becomes a secure execution venue for data-driven strategies.

6. OKX

OKX offers robust bot features, including grid trading and DCA bots. For users who prefer built-in automation, OKX is a solid option.

Still, Token Metrics outperforms on signal generation, narrative tracking, and AI-backed token scoring—making it an ideal data source for OKX bots.

Why AI is the Future of Crypto Trading

As cryptocurrency trading evolves, manual strategies alone can’t keep up. Market cycles are faster, token launches are more frequent, and volatility is constant. This is where crypto AI trading shines.

Here’s why more traders are adopting AI:

  • Speed: AI analyzes and reacts faster than any human
  • Scale: It can monitor 1,000s of tokens across multiple chains simultaneously
  • Emotionless: AI doesn’t panic-sell or FOMO-buy
  • Backtested: Strategies are tested on historical data for statistical confidence
  • Adaptive: AI learns and improves over time based on market behavior

Platforms like Token Metrics make this technology accessible—offering plug-and-play AI indices, custom signals, and portfolio intelligence for retail traders, funds, and institutions alike.

Final Thoughts

Cryptocurrency trading is becoming more competitive, data-driven, and automated. With the rise of crypto AI trading, traders now have the tools to gain a true edge—whether they’re investing $100 or managing $1M.

If you’re serious about crypto trading in 2025, don’t just guess—trade with data, trade with AI.

Explore how Token Metrics can power your portfolio with AI-generated insights, real-time signals, and next-generation trading tools.

Announcements

🚀 Token Metrics API Goes Live on Hacker News – The AI Crypto Toolkit for Builders

Token Metrics Team
5 min
MIN

The Token Metrics API has officially launched on Hacker News, marking a major milestone in our mission to bring AI-powered crypto insights to every developer, founder, and builder in the Web3 space.

If you're building trading bots, dashboards, investment tools, or AI agents that interact with the crypto market, this is your developer edge in 2025. Forget raw feeds and static charts—this is real-time, AI-grade crypto intelligence available in minutes via a single API key.

What Is the Token Metrics API?

The Token Metrics API is a powerful crypto intelligence engine built for developers who want more than just price data. It combines machine learning, quantitative modeling, and narrative indexing to deliver structured signals that help users make smarter trading decisions.

Instead of simply showing what the market did, the API helps predict what it might do—with insights like:

  • Trader & Investor Grades (0–100 scores on momentum and fundamentals)
  • Bullish/Bearish Signals across 6,000+ assets
  • Narrative-based Indices like DeFi, AI, Memes, RWAs, and more
  • Quantitative Risk Scores and sentiment analysis
  • Real-time updates, no lag, no stale metrics

It’s like giving your crypto bot a brain—and not just any brain, an AI-trained crypto analyst that never sleeps.

Why It’s Different from Every Other Crypto API

Most APIs give you prices, volume, and maybe some on-chain data. Token Metrics gives you opinionated intelligence derived from over 80 on-chain, off-chain, technical, and sentiment indicators.

That means:

  • Your dashboard users get real-time grades and trending tokens.
  • Your AI agent can speak fluently about token fundamentals.
  • Your bot can act on bullish flips before the rest of the market.

We’ve designed this API for modularity and plug-and-play usability. With 21+ endpoints and official SDKs, you can ship faster and smarter—no custom pipeline needed.

What Can You Build?

Whether you're a solo developer or building inside a Web3 team, the possibilities are wide open.

Build smarter with Token Metrics if you’re creating:

  • 🧠 AI trading agents that query real-time token grades
  • 📊 Investor dashboards that surface top-rated altcoins
  • 📈 DApps that alert users to sector momentum shifts
  • 📱 Mobile apps with embedded market signals
  • 🧪 Backtesting systems for narrative-based portfolio strategies

Because the API supports OpenAI, Claude, Cursor, and Raycast integrations, your agents and LLM-powered tools can query live crypto intelligence in natural language—no additional parsing required.

Why the Hacker News Feature Matters

Token Metrics API just made it to the front page of Hacker News, one of the internet’s most trusted platforms for discovering high-impact developer tools.

This means:

  • 💬 A community of builders and engineers is already testing the API
  • 🧪 Feedback is pouring in, helping us evolve faster
  • 🚀 Your early adoption puts you ahead of the curve

If you’ve been waiting for the right time to integrate AI-native crypto signals into your product—this is it.

Get Started for Free

We’re offering 5,000 free API calls/month for every new developer.

Sign up, plug in your key, and build:

  • With one consistent schema
  • Across multiple clients
  • Without chasing multiple API docs

Your users don’t just want raw data anymore—they want insights. Token Metrics delivers those insights in real time, with zero guesswork.

Join the Developer Revolution

💥 Explore the API – Get your key in 30 seconds
💬 Join the Hacker News discussion – See what other devs are saying
📚 Browse Docs – View full endpoints and SDKs

One API. One schema. Smarter crypto apps.
The future of crypto building is AI-powered—and it starts here.

Research

Bullish or Bearish? Interpreting AI Signals in Today’s Volatile Crypto Market

Token Metrics Team
5 min
MIN

Introduction

Crypto moves fast — and traders who can't read the signs get left behind. But in a market where emotions dominate, how do you distinguish between a real trend and a fakeout? That’s where AI-powered trading signals come in.

Token Metrics AI monitors over 6,000 tokens using 80+ data points, from technical momentum to on-chain activity and social sentiment. Its bullish and bearish signals aren’t just flashes of color — they’re actionable, data-driven insights that can guide decisions in chaotic markets.

In this post, we break down how to interpret bullish and bearish signals, what they’ve been saying recently, and how to react when market direction flips suddenly.

What Are Bullish and Bearish Signals?

Let’s start with the basics:

  • Bullish Signal (Green Dot): Indicates that a token is showing signs of an upward trend based on combined technical, sentiment, and on-chain analysis.
  • Bearish Signal (Red Dot): Suggests that a token is losing momentum, and price downside or stagnation is likely.

But these signals aren’t standalone — they come with contextual grades, like the Trader Grade, which ranks signal strength from 0 to 100. This allows you to not just know the direction, but the confidence behind it.

What Happened Recently? The May 30 Flip

On May 30, 2025, Token Metrics AI issued a broad bearish flip across much of the market. That included:

  • Ethereum
  • Bittensor
  • Launchcoin
  • Many Real World Asset and L2 tokens

The AI signal flipped red, and Trader Grades fell across the board. Why? Here's what the AI detected:

  • Slowing volume
  • Negative sentiment shift
  • Liquidity thinning on DEXs
  • On-chain accumulation stalling

This wasn’t panic-driven — it was a data-driven, proactive warning that the cycle had peaked. In a world where most traders rely on lagging indicators or Twitter sentiment, this was an edge.

How to Interpret a Bullish Signal

A bullish signal isn’t an instant “buy” — it's a call to investigate. Here's what to check when a green dot appears:

✅ 1. Trader Grade Above 80

This means high conviction. If it's between 60–79, the trend is forming, but may lack strength.

✅ 2. Volume Confirmation

Price up + volume up = good. Price up + volume flat = caution.

✅ 3. Narrative Alignment

If the token fits a hot theme (like RWAs or AI), that adds strength to the signal.

✅ 4. Recent Price Action

Did the signal appear after a breakout, or just before? Entry timing depends on whether you're catching the beginning or chasing the middle of the trend.

✅ 5. Compare to Peers

If 3–5 similar tokens are also turning bullish, that indicates sector-wide rotation — a better entry environment.

How to Interpret a Bearish Signal

Red doesn’t mean "dump immediately" — it means it's time to tighten your risk.

❗ 1. Trader Grade Below 50

This indicates deteriorating conviction — exit or reduce exposure.

❗ 2. Volume Divergence

If price is flat but volume is fading, that’s a warning of a potential breakdown.

❗ 3. Signal Timing

Did the bearish flip happen near local highs? That’s often the best exit point.

❗ 4. Check for Repeats

Was this the second red dot in a week? That could confirm a longer-term downtrend.

❗ 5. BTC/ETH Context

If Bitcoin or ETH also flip bearish, it may suggest macro pressure, not just token-specific weakness.

Real-Time Examples from the Webinar

During the June 5 Token Metrics webinar, we walked through examples of how these signals worked in real time:

🟢 Bullish (April) – Launchcoin

Strong signal, grade in the 80s. Resulted in a massive short-term run.

🔴 Bearish (May 30) – Ethereum

Signal turned red around $3,490. Traders who followed it avoided the 55% drawdown that followed.

🔴 Bearish (June) – Fartcoin

After a 700% run-up, the signal flipped bearish with a low Trader Grade of ~24. Result? A slow bleed lower as sentiment cooled.

What Makes AI Signals Different from Traditional TA?

Feature                                                    Token Metrics AI                     Traditional TA

Combines social + on-chain                    ✅                                       ❌

Updated in real time                                 ✅                                       ❌

Machine learning trained on past data   ✅                                       ❌

Outputs confidence grade                       ✅                                       ❌

Adapts to new narratives                         ✅                                       ❌

This isn’t about moving averages or MACD — it’s about combining the entire digital footprint of a token to anticipate what comes next.

How to React to a Signal Flip

What do you do when your favorite token suddenly flips from bullish to bearish?

  1. Reduce exposure immediately — even if you don’t sell everything, cut risk.
  2. Check the Grade — if it’s falling, momentum is likely over.
  3. Watch Peer Tokens — if similar projects are also turning red, it confirms sector rotation.
  4. Set New Alerts — if the signal flips back to green, be ready to re-enter.

Your job isn’t to predict the market. It’s to respond to what the data is saying.

How to Combine AI Signals with a Strategy

Here’s a basic framework:

Entry

  • Bullish signal + Trader Grade > 80 = enter with full size.
  • Grade 60–79 = enter small or wait for confirmation.

Exit

  • Bearish signal = scale out or exit.
  • Grade < 50 = no new positions unless for short trades.

Risk

  • Position size scales with grade.
  • Only trade tokens with high liquidity and volume confirmation.

This keeps your system simple, repeatable, and data-driven.

Conclusion

In volatile markets, conviction matters. Token Metrics AI doesn’t just point up or down — it tells you how strong the trend is, how likely it is to last, and when it’s time to pivot.

Don’t trade on emotions. Don’t chase hype. Use the signals — and trust the grade.

Because in a market that never sleeps, it pays to have an AI watching your back.

Research

Crypto Market Cools Off: What Is Token Metrics AI Saying Now

Token Metrics Team
5 min
MIN

Introduction

The euphoria of April and May in the crypto market has officially hit the brakes. While traders were riding high just weeks ago, the mood has shifted — and the data confirms it. Token Metrics’ proprietary AI signals flipped bearish on May 30, and since then, the market has been slowly but steadily declining.

In this post, we break down what’s happened since the bearish signal, how major altcoins and sectors are reacting, and what Token Metrics’ indicators are telling us about what might come next.

The Big Picture: Cooling Off After a Hot Q1 and Q2 Start

The platform’s AI signal turned bearish on May 30 when the total crypto market cap hit $3.34 trillion. Since then, the momentum that defined early 2025 has reversed.

This wasn’t a sudden crash — it’s a slow bleed. The signal shift didn’t come from headline-driven panic, but from data-level exhaustion: volume softening, sentiment stalling, and trend strength fading across most tokens.

Token Metrics AI recognized the shift — and issued the warning.

What the Bearish Signal Means

The AI model analyzes over 80 metrics across price, volume, sentiment, and on-chain data. When key trends across these data sets weaken, the system flips from bullish (green) to bearish (red).

On May 30:

  • Trader Grades across most tokens declined
  • Signal sentiment flipped bearish
  • Momentum and velocity cooled down

According to the model, these were signs of a broad de-risking cycle — not just isolated weakness.

Sectors Showing Declines

Even tokens that had been performing well throughout Q2 began to stall or roll over.

🚨 Launch Coin

Previously one of the top performers in April, Launch Coin saw its grades decrease and price action softened.It may even be rebranding — a typical signal that a project is pivoting after a hype cycle.

🏦 Real World Assets (RWAs)

RWAs were hot in March–May, but by early June, volume and signal quality had cooled off significantly.

🔐 ZK and L2s

Projects like Starknet and zkSync, once dominant in trader attention, have seen signal strength drop, with many now scoring below 70.

The cooling effect is broad, touching narratives, sectors, and high-performing individual tokens alike.

The Bull-Bear Indicator in Action

One of the key tools used by Token Metrics is the Bull vs. Bear Indicator, which aggregates bullish vs. bearish signals across all tokens tracked.

As of early June:

  • The percentage of tokens with bullish signals dropped to its lowest since January.
  • New projects launching with strong grades also saw a decline.
  • Even community-favorite tokens began receiving “exit” alerts.

This isn’t fear — it’s fatigue.

How Traders Are Reacting

During the webinar, we noted that many users who rely on Token Metrics signals began rotating into stables once the May 30 signal flipped. Others reduced leverage, paused entries, or shifted into defensive plays like ETH and BTC.

This reflects an important philosophy:

"When the data changes, we change our approach."

Instead of trying to fight the tape or chase rebounds, disciplined traders are using the bearish signal to protect gains and preserve capital.

What About Ethereum and Bitcoin?

Even ETH and BTC, the two bellwether assets, aren’t immune.

  • Ethereum: Lost momentum after a strong May push. Its Trader Grade is dropping, and the AI signals currently reflect neutral-to-bearish sentiment.
  • Bitcoin: While still holding structure better than altcoins, it has also declined since peaking above $72k. Volume weakening and sentiment falling suggest caution.

In previous cycles, ETH and BTC acted as shelters during altcoin corrections. But now, even the majors show weakness — another reason why the bearish flip matters.

What Could Reverse This?

Abdullah Sarwar, head of research at Token Metrics, mentioned that for the signals to flip back bullish, we would need to see:

  • Increased momentum across top tokens
  • New narratives (e.g., real-world utility, cross-chain demand)
  • Higher volume and liquidity inflows
  • Positive macro or ETF news

Until then, the system will remain in defensive mode — prioritizing safety over chasing trades.

How to Act During a Bearish Signal

The team offered several tips for traders during this cooling-off period:

  1. Reduce exposure
    Don’t hold full positions in assets with weak grades or bearish signals.

  2. Watch signal reversals
    Keep an eye on sudden bullish flips with high Trader Grades — they often mark trend reversals.

  3. Rebalance into safer assets
    BTC, ETH, or even stables allow you to sit on the sidelines while others take unnecessary risk.

  4. Use Token Metrics filters
    Use the platform to filter for:

    • Top tokens with >80 grades
    • Signals that flipped bullish in the last 3 days
    • Low market-cap tokens with strong on-chain activity

These tools help find exceptions in a weak market.

Conclusion: Bearish Doesn’t Mean Broken

Markets cycle — and AI sees it before headlines do.

Token Metrics' bearish signal wasn’t a call to panic. It was a calibrated, data-backed alert that the trend had shifted — and that it was time to switch from offense to defense.

If you’re navigating this new phase, listen to the data. Use the tools. And most importantly, avoid trading emotionally.

The bull market might return. When it does, Token Metrics AI will flip bullish again — and you’ll be ready.

Research

Backtesting Token Metrics AI: Can AI Grades Really Predict Altcoin Breakouts?

Token Metrics Team
5 min
MIN

To test the accuracy of Token Metrics' proprietary AI signals, we conducted a detailed six-month backtest across three different tokens — Fartcoin, Bittensor ($TAO), and Ethereum. Each represents a unique narrative: memecoins, AI infrastructure, and blue-chip Layer 1s. Our goal? To evaluate how well the AI’s bullish and bearish signals timed market trends and price action.

Fartcoin:

The green and red dots on the following Fartcoin price chart represent the bullish and bearish market signals, respectively. Since Nov 26, 2024, Token Metrics AI has given 4 trading signals for Fartcoin. Let’s analyze each signal separately.

The Fartcoin chart above displays green and red dots that mark bullish and bearish signals from the Token Metrics AI, respectively. Over the last six months — starting November 26, 2024 — our system produced four significant trade signals for Fartcoin. Let’s evaluate them one by one.

The first major signal was bullish on November 26, 2024, when Fartcoin was trading at $0.29. This signal preceded a massive run-up, with the price topping out at $2.49. That’s an astounding 758% gain — all captured within just under two months. It’s one of the most powerful validations of the AI model’s ability to anticipate momentum early.

Following that rally, a bearish signal was triggered on January 26, 2025, just before the market corrected. Fartcoin retraced sharply, plunging 74.76% from the highs. Traders who acted on this bearish alert could have avoided substantial drawdowns — or even profited through short-side exposure.

On March 25, 2025, the AI turned bullish again, as Fartcoin traded near $0.53. Over the next several weeks, the token surged to $1.58, a 198% rally. Again, the AI proved its ability to detect upward momentum early.

Most recently, on June 1, 2025, Token Metrics AI flipped bearish once again. The current Trader Grade of 24.34 reinforces this view. For now, the system warns of weakness in the memecoin market — a trend that appears to be playing out in real-time.

Across all four trades, the AI captured both the explosive upside and protected traders from steep corrections — a rare feat in the volatile world of meme tokens.

Bittensor

Next, we examine Bittensor, the native asset of the decentralized AI Layer 1 network. Over the last six months, Token Metrics AI produced five key signals — and the results were a mixed bag but still largely insightful.

In December 2024, the AI turned bearish around $510, which preceded a sharp decline to $314 by February — a 38.4% drawdown. This alert helped traders sidestep a brutal correction during a high-volatility period.

On February 21, 2025, the system flipped bullish, but this trade didn't play out as expected. The price dropped 25.4% after the signal. Interestingly, the AI reversed again with a bearish signal just five days later, showing how fast sentiment and momentum can shift in emerging narratives like AI tokens.

The third signal marked a solid win: Bittensor dropped from $327 to $182.9 following the bearish call — another 44% drop captured in advance.

In April 2025, momentum returned. The AI issued a bullish alert on April 19, with TAO at $281. By the end of May, the token had rallied to over $474, resulting in a 68.6% gain — one of the best performing bullish signals in the dataset.

On June 4, the latest red dot (bearish) appeared. The model anticipates another downward move — time will tell if it materializes, but the track record suggests caution is warranted.

Ethereum

Finally, we analyze the AI’s predictive power for Ethereum, the second-largest crypto by market cap. Over the six-month window, Token Metrics AI made three major calls — and each one captured critical pivots in ETH’s price.

On November 7, 2024, a green dot (bullish) appeared when ETH was priced at $2,880. The price then surged to $4,030 in less than 40 days, marking a 40% gain. For ETH, such a move is substantial and was well-timed.

By December 24, the AI flipped bearish with ETH trading at $3,490. This signal was perhaps the most important, as it came ahead of a major downturn. ETH eventually bottomed out near $1,540 in April 2025, avoiding a 55.8% drawdown for those who acted on the signal.

In May 2025, the AI signaled another bullish trend with ETH around $1,850. Since then, the asset rallied to $2,800, creating a 51% gain.

These three trades — two bullish and one bearish — show the AI’s potential in navigating large-cap assets during both hype cycles and corrections.Backtesting Token Metrics AI across memecoins, AI narratives, and Ethereum shows consistent results: early identification of breakouts, timely exit signals, and minimized risk exposure. While no model is perfect, the six-month history reveals a tool capable of delivering real value — especially when used alongside sound risk management.

Whether you’re a trader looking to time the next big altcoin rally or an investor managing downside in turbulent markets, Token Metrics AI signals — available via the fastest crypto API — offer a powerful edge.

Backtesting Token Metrics AI across memecoins, AI narratives, and Ethereum shows consistent results: early identification of breakouts, timely exit signals, and minimized risk exposure. While no model is perfect, the six-month history reveals a tool capable of delivering real value — especially when used alongside sound risk management.

Whether you’re a trader looking to time the next big altcoin rally or an investor managing downside in turbulent markets, Token Metrics AI signals — available via the fastest crypto API — offer a powerful edge.

Research

Token Metrics API vs. CoinGecko API: Which Crypto API Should You Choose in 2025?

Token Metrics Team
7 min
MIN

As the crypto ecosystem rapidly matures, developers, quant traders, and crypto-native startups are relying more than ever on high-quality APIs to build data-powered applications. Whether you're crafting a trading bot, developing a crypto research platform, or launching a GPT agent for market analysis, choosing the right API is critical.

Two names dominate the space in 2025: CoinGecko and Token Metrics. But while both offer access to market data, they serve fundamentally different purposes. CoinGecko is a trusted source for market-wide token listings and exchange metadata. Token Metrics, on the other hand, delivers AI-powered intelligence for predictive analytics and decision-making.

Let’s break down how they compare—and why the Token Metrics API is the superior choice for advanced, insight-driven builders.

🧠 AI Intelligence: Token Metrics Leads the Pack

At the core of Token Metrics is machine learning and natural language processing. It’s not just a data feed. It’s an AI that interprets the market.

Features exclusive to Token Metrics API:

  • Trader Grade (0–100) – Short-term momentum score based on volume, volatility, and technicals
  • Investor Grade (0–100) – Long-term asset quality score using fundamentals, community metrics, liquidity, and funding
  • Bullish/Bearish AI Signals – Real-time alerts based on over 80 weighted indicators
  • Sector-Based Smart Indices – Curated index sets grouped by theme (AI, DeFi, Gaming, RWA, etc.)
  • Sentiment Scores – Derived from social and news data using NLP
  • LLM-Friendly AI Reports – Structured, API-returned GPT summaries per token
  • Conversational Agent Access – GPT-based assistant that queries the API using natural language

In contrast, CoinGecko is primarily a token and exchange aggregator. It offers static data: price, volume, market cap, supply, etc. It’s incredibly useful for basic info—but it lacks context or predictive modeling.

Winner: Token Metrics — The only crypto API built for AI-native applications and intelligent automation.

🔍 Data Depth & Coverage

While CoinGecko covers more tokens and more exchanges, Token Metrics focuses on providing actionable insights rather than exhaustively listing everything.

Feature                                                   Token Metrics API                                    CoinGecko API

Real-time + historical OHLCV              ✅                                                          ✅

Trader/Investor Grades                        ✅ AI-powered                                     ❌

Exchange Aggregation                         ✅ (Used in indices, not exposed)     ✅

Sentiment & Social Scoring                  ✅ NLP-driven                                     ❌

AI Signals                                               ✅                                                         ❌

Token Fundamentals                            ✅ Summary via deepdive         ⚠️ Limited

                                                                        endpoint

NFT Market Data                                  ❌                                                          ✅

On-Chain Behavior                               ✅ Signals + Indices                   ⚠️ Pro-only (limited)

If you're building something analytics-heavy—especially trading or AI-driven—Token Metrics gives you depth, not just breadth.

Verdict: CoinGecko wins on broad metadata coverage. Token Metrics wins on intelligence and strategic utility.

🛠 Developer Experience

One of the biggest barriers in Web3 is getting devs from “idea” to “prototype” without friction. Token Metrics makes that easy.

Token Metrics API Includes:

  • SDKs for Python, Node.js, and Postman
  • Quick-start guides and GitHub sample projects
  • Integrated usage dashboard to track limits and history
  • Conversational agent to explore data interactively
  • Clear, logical endpoint structure across 21 data types

CoinGecko:

  • Simple REST API
  • JSON responses
  • Minimal docs
  • No SDKs
  • No built-in tooling (must build from scratch)

Winner: Token Metrics — Serious devs save hours with ready-to-go SDKs and utilities.

📊 Monitoring, Quotas & Support

CoinGecko Free Tier:

  • 10–30 requests/min
  • No API key needed
  • Public endpoints
  • No email support
  • Rate limiting enforced via IP

Token Metrics Free Tier:

  • 5,000 requests/month
  • 1 request/min
  • Full access to AI signals, grades, rankings
  • Telegram & email support
  • Upgrade paths to 20K–500K requests/month

While CoinGecko’s no-login access is beginner-friendly, Token Metrics offers far more power per call. With just a few queries, your app can determine which tokens are gaining momentum, which are losing steam, and how portfolios should be adjusted.

Winner: Token Metrics — Better for sustained usage, scaling, and production reliability.

💸 Pricing & Value

Plan Feature                CoinGecko Pro            Token Metrics API

Entry Price                  ~$150/month                $99/month

AI Grades & Signals            ❌                               ✅ 

Sentiment Analytics            ❌                               ✅

Sector Index Insights          ❌                               ✅

NLP Token Summaries       ❌                                ✅

Developer SDKs                  ❌                                ✅

Token-Based Discounts     ❌                                ✅ (up to 35% with $TMAI)

For what you pay, Token Metrics delivers quant models and intelligent signal streams — not just raw price.

Winner: Token Metrics — Cheaper entry, deeper value.

🧠 Use Cases Where Token Metrics API Shines

  • Trading Bots
    Use Trader Grade and Signal endpoints to enter/exit based on AI triggers.
  • GPT Agents
    Generate conversational answers for “What’s the best AI token this week?” using structured summaries.
  • Crypto Dashboards
    Power sortable, filtered token tables by grade, signal, or narrative.
  • Portfolio Rebalancers
    Track real-time signals for tokens held, flag risk zones, and show sector exposure.
  • LLM Plugins
    Build chat-based investment tools with explainability and score-based logic.

🧠 Final Verdict: CoinGecko for Info, Token Metrics for Intelligence

If you're building a crypto price tracker, NFT aggregator, or exchange overview site, CoinGecko is a solid foundation. It’s reliable, broad, and easy to get started.

But if your product needs to think, adapt, or help users make better decisions, then Token Metrics API is in another class entirely.

You're not just accessing data — you're integrating AI, machine learning, and predictive analytics into your app. That’s the difference between showing the market and understanding it.

🔗 Ready to Build Smarter?

  • ✅ 5,000 free API calls/month
  • 🤖 Trader & Investor Grades
  • 📊 Live Bull/Bear signals
  • 🧠 AI-powered summaries and GPT compatibility
  • ⚡ 21 endpoints + Python/JS SDKs

👉 Start with Token Metrics API

Research

Python Quick-Start with Token Metrics: The Ultimate Crypto Price API

Token Metrics Team
10 min
MIN

If you’re a Python developer looking to build smarter crypto apps, bots, or dashboards, you need two things: reliable data and AI-powered insights. The Token Metrics API gives you both. In this tutorial, we’ll show you how to quickly get started using Token Metrics as your Python crypto price API, including how to authenticate, install the SDK, and run your first request in minutes.

Whether you’re pulling live market data, integrating Trader Grades into your trading strategy, or backtesting with OHLCV data, this guide has you covered.

🚀 Quick Setup for Developers in a Hurry

Install the official Token Metrics Python SDK:

pip install tokenmetrics

Or if you prefer working with requests directly, no problem. We’ll show both methods below.

🔑 Step 1: Generate Your API Key

Before anything else, you’ll need a Token Metrics account.

  1. Go to app.tokenmetrics.com/en/api
  2. Log in and navigate to the API Keys Dashboard
  3. Click Generate API Key
  4. Name your key (e.g., “Development”, “Production”)
  5. Copy it immediately — keep it secret.

You can monitor usage, rate limits, and quotas right from the dashboard. Track each key’s status, last used date, and revoke access at any time.

📈 Step 2: Retrieve Crypto Prices in Python

Here’s a simple example to fetch the latest price data for Ethereum (ETH):

import requests

API_KEY = "YOUR_API_KEY"

headers = {"x-api-key": API_KEY}

url = "https://api.tokenmetrics.com/v2/daily-ohlcv?symbol=ETH&startDate=<YYYY-MM-DD>&endDate=<YYYY-MM-DD>"

response = requests.get(url, headers=headers)

data = response.json()

for candle in data['data']:

    print(f"Date: {candle['DATE']} | Close: ${candle['CLOSE']}")

You now have a working python crypto price API pipeline. Customize startDate or endDate to get specific range of historical data.

📊 Add AI-Powered Trader Grades

Token Metrics’ secret sauce is its AI-driven token ratings. Here’s how to access Trader Grades for ETH:

grade_url = "https://api.tokenmetrics.com/v2/trader-grades?symbol=ETH&limit=30d"

grades = requests.get(grade_url, headers=headers).json()['data']

for day in grades:

    print(f"{day['DATE']} — Trader Grade: {day['TA_GRADE']}")

Use this data to automate trading logic (e.g., enter trades when Grade > 85) or overlay on charts.

🔁 Combine Data for Backtesting

Want to test a strategy? Merge OHLCV and Trader Grades for any token:

import pandas as pd

ohlcv_df = pd.DataFrame(data['data'])

grades_df = pd.DataFrame(grades)

combined_df = pd.merge(ohlcv_df, grades_df, on="DATE")

print(combined_df.head())

Now you can run simulations, build analytics dashboards, or train your own models.

⚙️ Endpoint Coverage for Python Devs

  • /daily-ohlcv: Historical price data
  • /trader-grades: AI signal grades (0–100)
  • /trading-signals: Bullish/Bearish signals for short and long positions.
  • /sentiment: AI-modeled sentiment scores
  • /tmai: Ask questions in plain English

All endpoints return structured JSON and can be queried via requests, axios, or any modern client.

🧠 Developer Tips

  • Each request = 1 credit (tracked in real time)
  • Rate limits depend on your plan (Free = 1 req/min)
  • Use the API Usage Dashboard to monitor and optimize
  • Free plan = 5,000 calls/month — perfect for testing and building MVPs

💸 Bonus: Save 35% with $TMAI

You can reduce your API bill by up to 35% by staking and paying with Token Metrics’ native token, $TMAI. Available via the settings → payments page.

🌐 Final Thoughts

If you're searching for the best python crypto price API with more than just price data, Token Metrics is the ultimate choice. It combines market data with proprietary AI intelligence, trader/investor grades, sentiment scores, and backtest-ready endpoints—all in one platform.

✅ Real-time & historical data
✅ RESTful endpoints
✅ Python-ready SDKs and docs
✅ Free plan to start building today

Start building today → tokenmetrics.com/api

Looking for SDK docs? Explore the full Python Quick Start Guide

Research

Crypto API to Google Sheets in 5 Minutes: How to Use Token Metrics API with Apps Script

Token Metrics Team
6 min
MIN

If you're a trader, data analyst, or crypto enthusiast, chances are you've wanted to pull live crypto data directly into Google Sheets. Whether you're tracking prices, building custom dashboards, or backtesting strategies, having real-time data at your fingertips can give you an edge.

In this guide, we'll show you how to integrate the Token Metrics API — a powerful crypto API with free access to AI-powered signals — directly into Google Sheets in under 5 minutes using Google Apps Script.

📌 Why Use Google Sheets for Crypto Data?

Google Sheets is a flexible, cloud-based spreadsheet that:

  • Requires no coding to visualize data
  • Can be shared and updated in real time
  • Offers formulas, charts, and conditional formatting
  • Supports live API connections with Apps Script

When combined with the Token Metrics API, it becomes a powerful dashboard that updates live with Trader Grades, Bull/Bear Signals, historical OHLCV data, and more.

🚀 What Is Token Metrics API?

The Token Metrics API provides real-time and historical crypto data powered by AI. It includes:

  • Trader Grade: A score from 0 to 100 showing bullish/bearish potential
  • Bull/Bear Signal: A binary signal showing market direction
  • OHLCV: Open-High-Low-Close-Volume price history
  • Token Metadata: Symbol, name, category, market cap, and more

The best part? The free Basic Plan includes:

  • 5,000 API calls/month
  • Access to core endpoints
  • Hourly data refresh
  • No credit card required

👉 Sign up for free here

🛠️ What You’ll Need

  • A free Token Metrics API key
  • A Google account
  • Basic familiarity with Google Sheets

⚙️ How to Connect Token Metrics API to Google Sheets

Here’s how to get live AI-powered crypto data into Sheets using Google Apps Script.

🔑 Step 1: Generate Your API Key

  1. Visit: https://app.tokenmetrics.com/en/api
  2. Click “Generate API Key”
  3. Copy it — you’ll use this in the script

📄 Step 2: Create a New Google Sheet

  1. Go to Google Sheets
  2. Create a new spreadsheet
  3. Click Extensions > Apps Script

💻 Step 3: Paste This Apps Script

const TOKEN_METRICS_API_KEY = 'YOUR_API_KEY_HERE';

async function getTraderGrade(symbol) {

  const url = `https://api.tokenmetrics.com/v2/trader-grades?symbol=${symbol.toUpperCase()}`;

  const options = {

    method: 'GET',

    contentType: 'application/json',

    headers: {

      'accept': 'application/json',

      'x-api-key': TOKEN_METRICS_API_KEY,

    },

    muteHttpExceptions: true

  };


  const response = UrlFetchApp.fetch(url, options);

  const data = JSON.parse(response.getContentText() || "{}")


  if (data.success && data.data.length) {

    const coin = data.data[0];

    return [

      coin.TOKEN_NAME,

      coin.TOKEN_SYMBOL,

      coin.TA_GRADE,

      coin.DATE

    ];

  } else {

    return ['No data', '-', '-', '-'];

  }

}

async function getSheetData() {

  const sheet = SpreadsheetApp.getActiveSpreadsheet().getActiveSheet();

  const symbols = sheet.getRange('A2:A').getValues().flat().filter(Boolean);

  const results = [];

  results.push(['Name', 'Symbol', 'Trader Grade', 'Date']);

  for (const symbol of symbols) {

    if (symbol) {

      const row = await getTraderGrade(symbol);

      results.push(row);

    }

  }

  sheet.getRange(2, 2, results.length, results[0].length).setValues(results);

}

🧪 Step 4: Run the Script

  1. Replace 'YOUR_API_KEY_HERE' with your real API key.
  2. Save the project as TokenMetricsCryptoAPI.
  3. In your sheet, enter a list of symbols (e.g., BTC, ETH, SOL) in Column A.
  4. Go to the script editor and run getSheetData() from the dropdown menu.

Note: The first time, Google will ask for permission to access the script.

✅ Step 5: View Your Live Data

After the script runs, you’ll see:

  • Coin name and symbol
  • Trader Grade (0–100)
  • Timestamp

You can now:

  • Sort by Trader Grade
  • Add charts and pivot tables
  • Schedule automatic updates with triggers (e.g., every hour)

🧠 Why Token Metrics API Is Ideal for Google Sheets Users

Unlike basic price APIs, Token Metrics offers AI-driven metrics that help you:

  • Anticipate price action before it happens
  • Build signal-based dashboards or alerts
  • Validate strategies against historical signals
  • Keep your data fresh with hourly updates

And all of this starts for free.

🏗️ Next Steps: Expand Your Sheet

Here’s what else you can build:

  • A portfolio tracker that pulls your top coins’ grades
  • A sentiment dashboard using historical OHLCV
  • A custom screener that filters coins by Trader Grade > 80
  • A Telegram alert system triggered by Sheets + Apps Script + Webhooks

You can also upgrade to the Advanced Plan to unlock 21 endpoints including:

  • Investor Grades
  • Smart Indices
  • Sentiment Metrics
  • Quantitative AI reports
  • 60x API speed

🔐 Security Tip

Never share your API key in a public Google Sheet. Use script-level access and keep the sheet private unless required.

🧩 How-To Schema Markup (for SEO)

{

  "@context": "https://schema.org",

  "@type": "HowTo",

  "name": "Crypto API to Google Sheets in 5 Minutes",

  "description": "Learn how to connect the Token Metrics crypto API to Google Sheets using Google Apps Script and get real-time AI-powered signals and prices.",

  "totalTime": "PT5M",

  "supply": [

    {

      "@type": "HowToSupply",

      "name": "Google Sheets"

    },

    {

      "@type": "HowToSupply",

      "name": "Token Metrics API Key"

    }

  ],

  "tool": [

    {

      "@type": "HowToTool",

      "name": "Google Apps Script"

    }

  ],

  "step": [

    {

      "@type": "HowToStep",

      "name": "Get Your API Key",

      "text": "Sign up at Token Metrics and generate your API key from the API dashboard."

    },

    {

      "@type": "HowToStep",

      "name": "Create a New Google Sheet",

      "text": "Open a new sheet and list crypto symbols in column A."

    },

    {

      "@type": "HowToStep",

      "name": "Add Apps Script",

      "text": "Go to Extensions > Apps Script and paste the provided code, replacing your API key."

    },

    {

      "@type": "HowToStep",

      "name": "Run the Script",

      "text": "Execute the getSheetData function to pull data into the sheet."

    }

  ]

}

✍️ Final Thoughts

If you're serious about crypto trading or app development, integrating live market signals into your workflow can be a game-changer. With the Token Metrics API, you can get institutional-grade AI signals — right inside Google Sheets.

This setup is simple, fast, and completely free to start. Try it today and unlock a smarter way to trade and build in crypto.

👉 Get Your API Key & Start for Free

Announcements

🚀Put Your $TMAI to Work: Daily Rewards, No Locks, Up To 200% APR.

Token Metrics Team
5 min
MIN

Liquidity farming just got a major upgrade. Token Metrics AI ($TMAI) has launched its first liquidity incentive campaign on Merk — and it’s designed for yield hunters looking to earn fast, with no lockups, no gimmicks, and real rewards from Day 1.

📅 Campaign Details

  • Duration: June 5 – June 19, 2025
  • Rewards Begin: 17:00 UTC / 1:00 PM ET
  • Total TMAI Committed: 38 million+ $TMAI
  • No Lockups: Enter or exit at any time
  • APR Potential: Up to 200%

For two weeks, liquidity providers can earn high daily rewards across three different pools. All rewards are paid in $TMAI and distributed continuously — block by block — through the Merkl platform.

💧 Where to Earn – The Pools (as of June 5, 17:00 UTC)

Pool                                                    Starting APR %               Total Rewards (14 days)                Current TVL

Aerodrome WETH–TMAI        150%                                16.79M TMAI (~$11,000)                   $86,400

Uniswap v3 USDC–TMAI        200%                                14.92M TMAI (~$9,800)                    $19,900

Balancer 95/5 WETH–TMAI    200%                                5.60M TMAI (~$3,700)                       $9,500

These pools are live and actively paying rewards. APR rates aren’t displayed on Merkl until the first 24 hours of data are available — but early providers will already be earning.

🧠 Why This Campaign Stands Out

1. Turbo Rewards for a Short Time

This isn’t a slow-drip farm. The TMAI Merkl campaign is designed to reward action-takers. For the first few days, yields are especially high — thanks to low TVL and full daily reward distribution.

2. No Lockups or Waiting Periods

You can provide liquidity and withdraw it anytime — even the same day. There are no lockups, no vesting, and no delayed payout mechanics. All rewards accrue automatically and are claimable through Merkl.

3. Choose Your Risk Profile

You get to pick your exposure.

  • Want ETH upside? Stake in Aerodrome or Balancer.
  • Prefer stablecoin stability? Go with the Uniswap v3 USDC–TMAI pool.

4. Influence the Future of TMAI Yield Farming

This campaign isn’t just about yield — it’s a test. If enough users participate and volume grows, the Token Metrics Treasury will consider extending liquidity rewards into Q3 and beyond. That means more TMAI emissions, longer timelines, and consistent passive income opportunities for LPs.

5. Built for Transparency and Speed

Rewards are distributed via Merkl by Angle Labs, a transparent, gas-efficient platform for programmable liquidity mining. You can see the exact rewards, TVL, wallet counts, and pool analytics at any time.

🔧 How to Get Started

Getting started is simple. You only need a crypto wallet, some $TMAI, and a matching asset (either WETH or USDC, depending on the pool).

Step-by-step:

  1. Pick a pool:
    Choose from Aerodrome, Uniswap v3, or Balancer depending on your risk appetite and asset preference.

  2. Provide liquidity:
    Head to the Merkl link for your pool, deposit both assets, and your position is live immediately.

  3. Track your earnings:
    Watch TMAI accumulate daily in your Merkl dashboard. You can claim rewards at any time.

  4. Withdraw when you want:
    Since there are no lockups, you can remove your liquidity whenever you choose — rewards stop the moment liquidity is pulled.

🎯 Final Thoughts

This is a rare opportunity to earn serious rewards in a short amount of time. Whether you’re new to liquidity mining or a DeFi veteran, the TMAI Merkl campaign is built for speed, flexibility, and transparency.

You’re still early. The best yields happen in the first days, before TVL rises and APR stabilizes. Dive in now and maximize your returns while the turbo phase is still on.

👉 Join the Pools and Start Earning

Thank you! Your submission has been received!
Oops! Something went wrong while submitting the form.

Crypto Basics Blog

Research Blogs

Announcement Blogs

Unlock the Secrets of Cryptocurrency

Sign Up for the Newsletter for the Exclusive Updates