Text Link
Text Link
Text Link
Text Link
Text Link
Thank you! Your submission has been received!
Oops! Something went wrong while submitting the form.

Stop Guessing, Start Trading: The Token Metrics API Advantage

Announcements

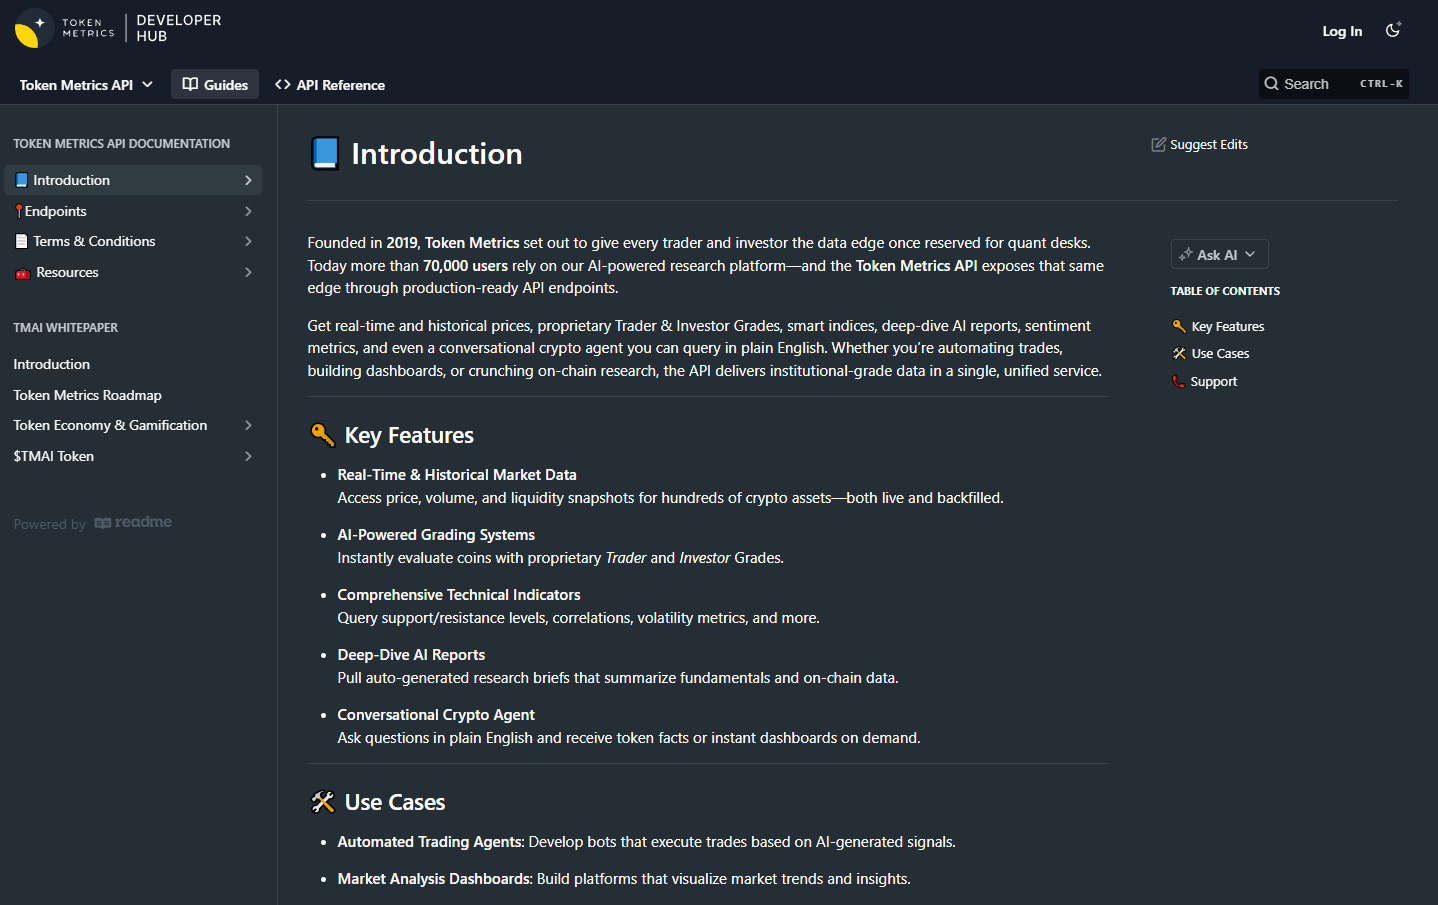
Big news: We’re cranking up the heat on AI-driven crypto analytics with the launch of the Token Metrics API and our official SDK (Software Development Kit). This isn’t just an upgrade – it's a quantum leap, giving traders, hedge funds, developers, and institutions direct access to cutting-edge market intelligence, trading signals, and predictive analytics.

Crypto markets move fast, and having real-time, AI-powered insights can be the difference between catching the next big trend or getting left behind. Until now, traders and quants have been wrestling with scattered data, delayed reporting, and a lack of truly predictive analytics. Not anymore.

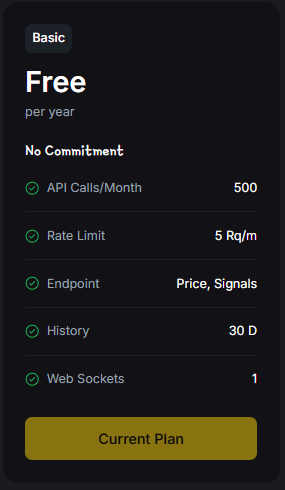
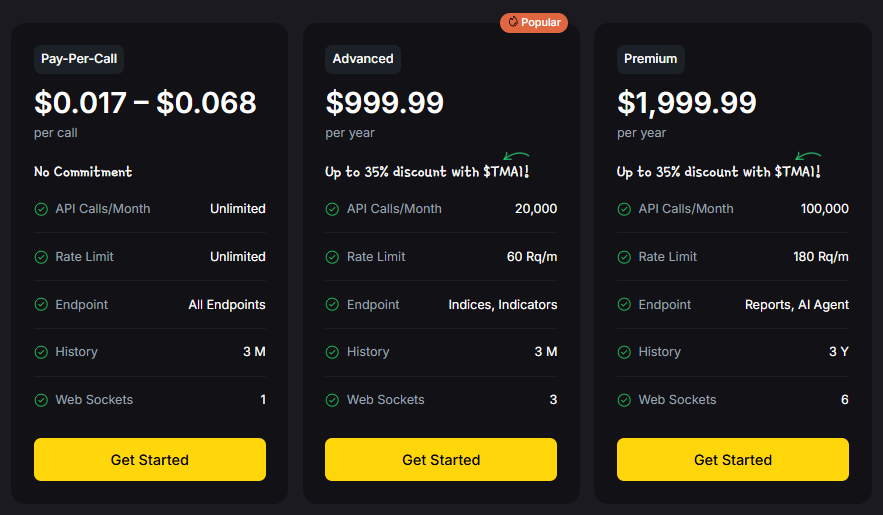
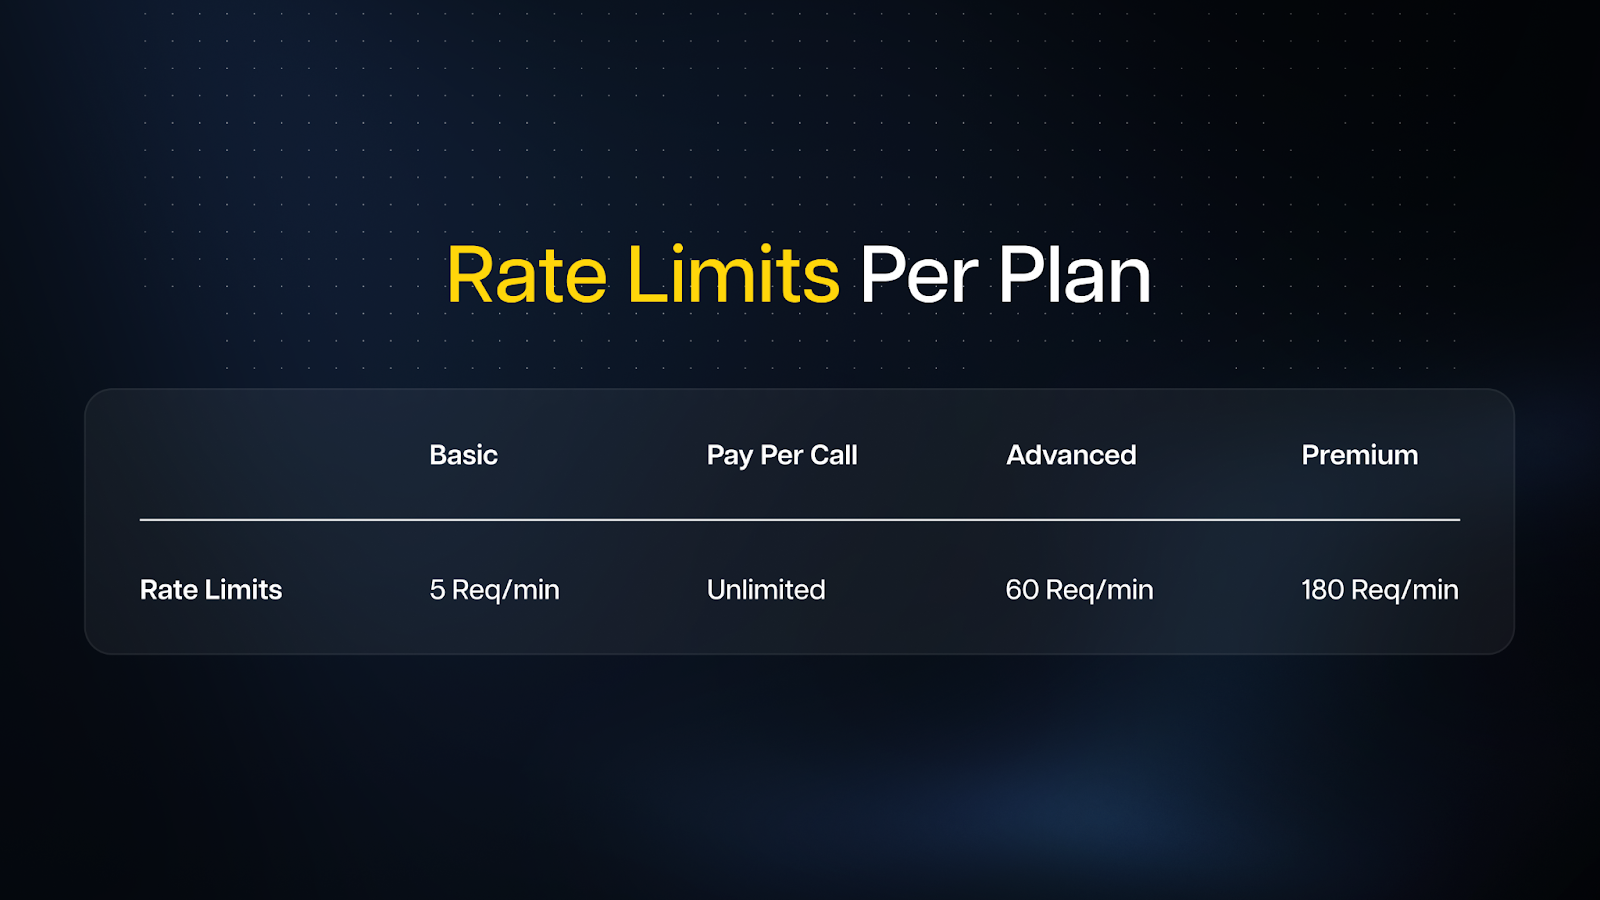
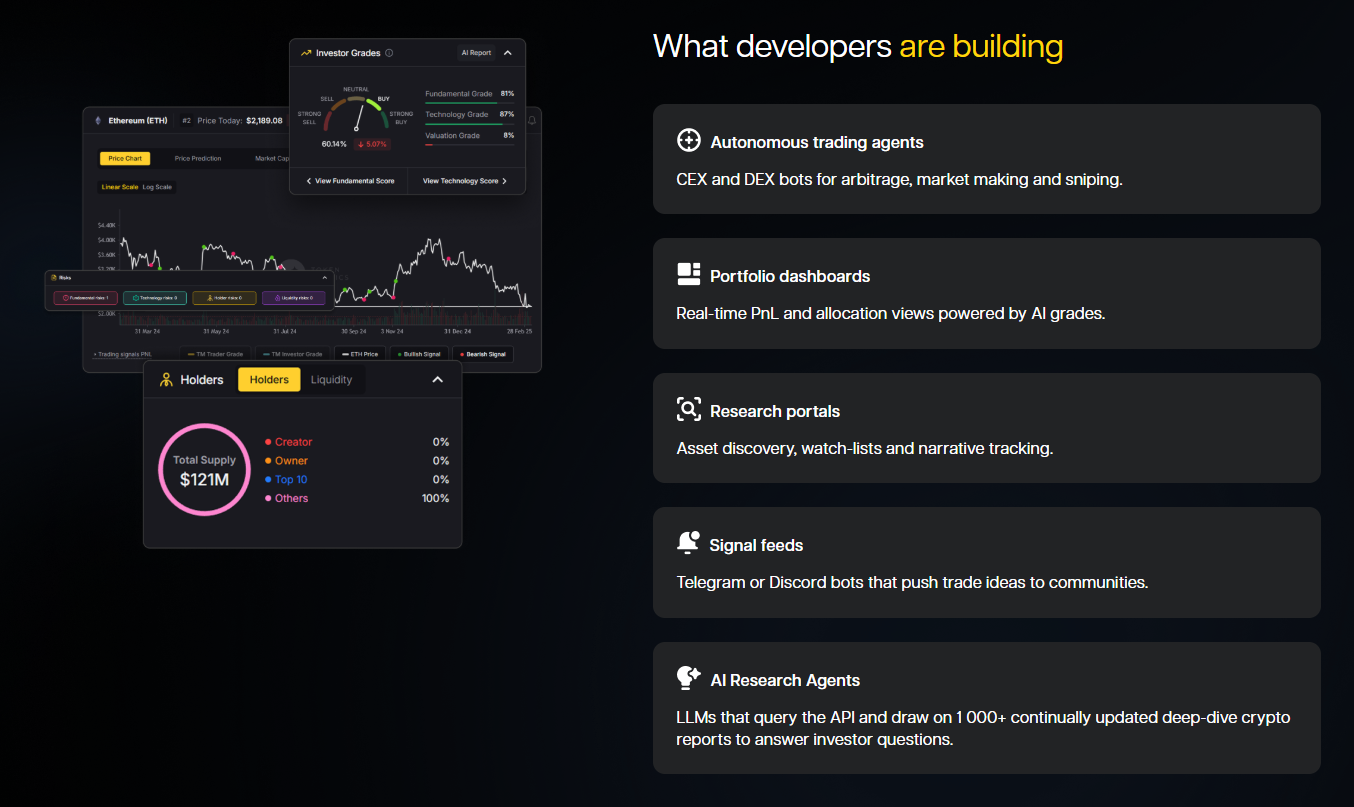
The Token Metrics API delivers 32+ high-performance endpoints packed with powerful AI-driven insights right into your lap, including:

  • Trading Signals: AI-driven buy/sell recommendations based on real-time market conditions.
  • Investor & Trader Grades: Our proprietary risk-adjusted scoring for assessing crypto assets.
  • Price Predictions: Machine learning-powered forecasts for multiple time frames.
  • Sentiment Analysis: Aggregated insights from social media, news, and market data.
  • Market Indicators: Advanced metrics, including correlation analysis, volatility trends, and macro-level market insights.

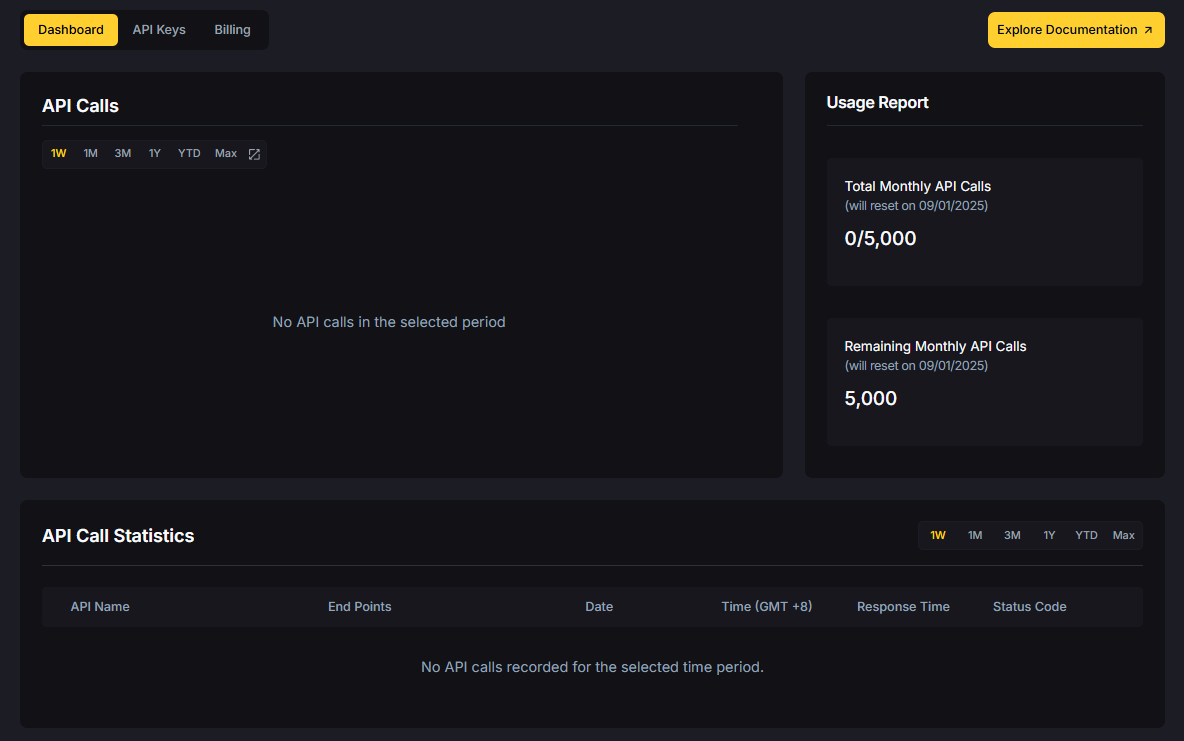
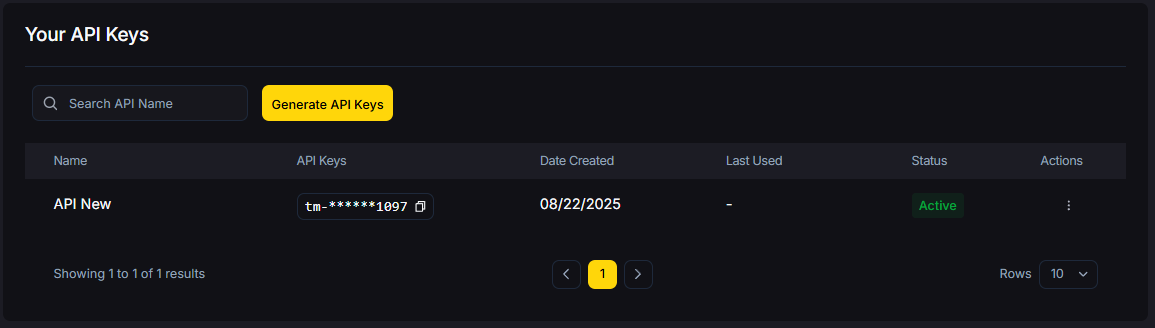
Getting started with the Token Metrics API is simple:

  1. Sign up at www.tokenmetrics.com/api
  2. Generate an API key and explore sample requests.
  3. Choose a tier–start with 50 free API calls/month, or stake TMAI tokens for premium access.
  4. Optionally–download the SDK, install it for your preferred programming language, and follow the provided setup guide.

At Token Metrics, we believe data should be decentralized, predictive, and actionable. 

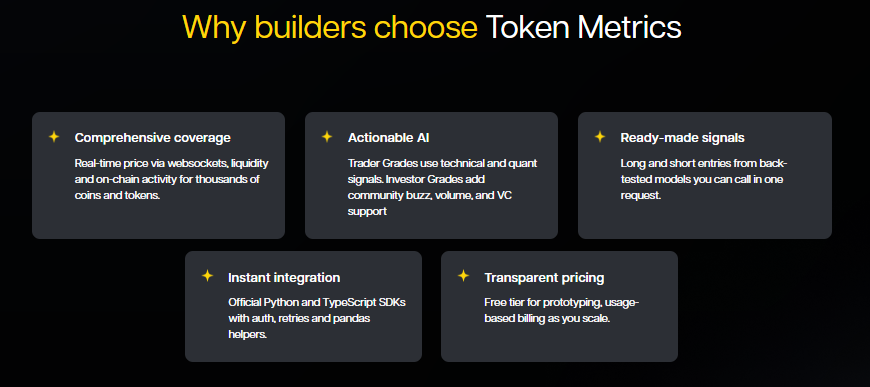
The Token Metrics API & SDK bring next-gen AI-powered crypto intelligence to anyone looking to trade smarter, build better, and stay ahead of the curve. With our official SDK, developers can plug these insights into their own trading bots, dashboards, and research tools – no need to reinvent the wheel.

Research

Top 100 Crypto Index vs. Top 10: Why Breadth Wins in 2025

Token Metrics Team
11
MIN

Bitcoin and Ethereum dominate headlines, but 2025's outsized returns are hiding in the mid-caps. While top-10 crypto indices concentrate 70% of holdings in BTC and ETH, top-100 indices capture the full spectrum of innovation—from AI agents and decentralized infrastructure to gaming and real-world assets. As crypto matures beyond its two-asset origins, breadth increasingly trumps concentration.

Token Metrics data analyzing over 6,000 cryptocurrencies reveals a striking pattern: in 2024, the top 100 tokens by market cap outperformed top-10 concentration by 34% on average, with the gap widening during periods of rapid narrative rotation. As we move deeper into 2025, this divergence is accelerating. Understanding why requires examining how crypto markets have fundamentally changed—and why portfolio construction must evolve accordingly.

The Concentration Problem: When Two Assets Control Your Fate

Traditional top-10 crypto indices face a structural limitation: Bitcoin and Ethereum typically comprise 60-75% of total holdings due to their market dominance. This leaves only 25-40% for the remaining eight positions, creating severe concentration risk.

Real-World Top-10 Allocation (Market Cap Weighted)

  • Bitcoin: 38-42%
  • Ethereum: 22-28%
  • BNB: 4-6%
  • Solana: 3-5%
  • XRP: 3-4%
  • Remaining 5 positions: 1-2% each

The problem: Your portfolio moves almost entirely with BTC and ETH. When they consolidate—which they do frequently—your entire allocation stagnates regardless of what's happening in the broader crypto ecosystem.

Q4 2024: A Case Study in Concentration Risk

Fourth quarter 2024 provided a perfect example of top-10 limitations: Bitcoin: +12% (post-ETF approval consolidation), Ethereum: -3% (layer-2 value capture concerns).
Combined BTC+ETH impact on top-10 index: ~+6%.
Meanwhile, significant moves occurred outside the top 10:

  • Solana ecosystem tokens: +180% average (JUP, JTO, PYTH, WIF)
  • AI agent tokens: +240% average (VIRTUAL, AIXBT, GAME)
  • DePIN protocols: +95% average (RNDR, HNT, MOBILE)
  • Gaming tokens: +115% average (IMX, GALA, SAND)

A top-10 index captured minimal exposure to these narratives. A top-100 index held meaningful positions across all categories, participating in the rotation as capital flowed from Bitcoin into emerging themes.

Performance differential: Top-10 index gained approximately 6-8% in Q4. Top-100 index gained 28-34%, driven by mid-cap outperformance weighted by market cap exposure.
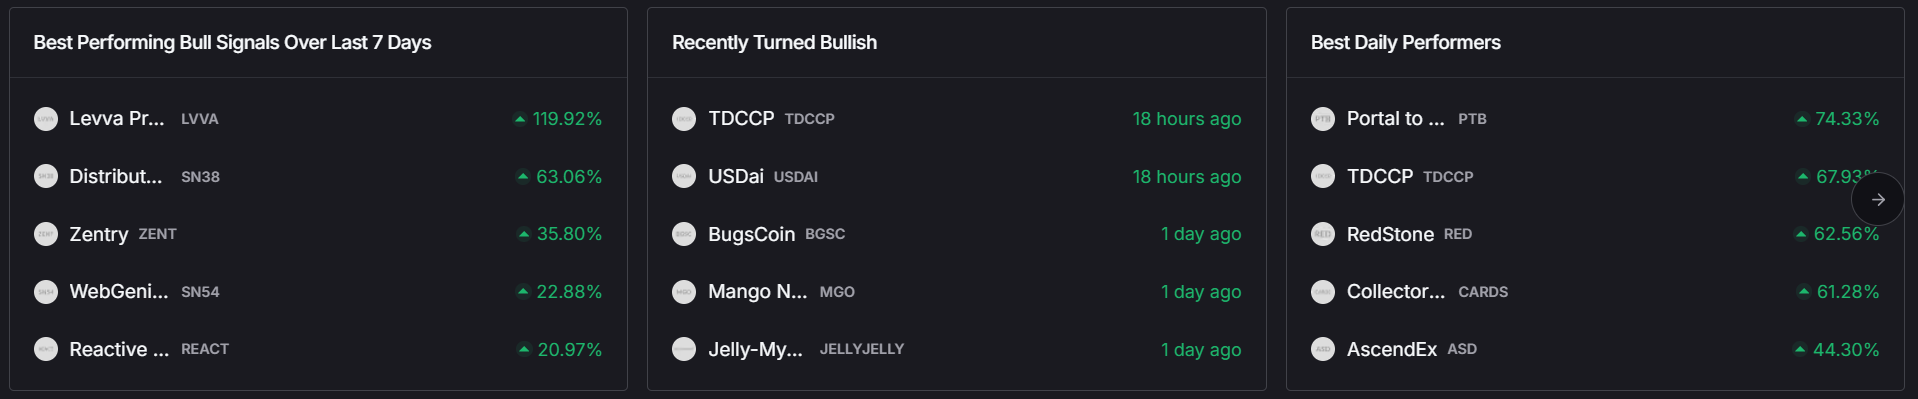
Token Metrics' rating system flagged many of these mid-cap opportunities weeks before peak momentum, but top-10 concentration prevented meaningful participation.

Narrative Rotation: The Defining Feature of 2025 Crypto Markets

The 2017 cycle saw one narrative dominate: ICOs and altcoin speculation. The 2020-2021 cycle featured DeFi Summer and NFTs, each lasting months. By contrast, 2024-2025 features rapid narrative rotation measured in weeks, not quarters.

The New Rotation Cycle

  1. Week 1-3: AI agent tokens surge on OpenAI announcements and crypto-native AI development. Capital flows into VIRTUAL, AIXBT, and related ecosystem plays. Mid-cap tokens in this category gain 100-300%.
  2. Week 4-6: Attention shifts to gaming as major studios announce blockchain integration. IMX, GALA, and SAND see volume spikes. Previous AI winners consolidate or correct.
  3. Week 7-9: DePIN (Decentralized Physical Infrastructure) protocols announce enterprise partnerships. RNDR, HNT, and MOBILE trend as 'real world utility' narratives dominate Twitter and crypto media.
  4. Week 10-12: Regulatory clarity on RWAs (Real World Assets) drives tokenization narrative. Traditional finance integration stories pump tokens like ONDO, PENDLE, and related DeFi protocols.
  5. Week 13+: Rotation back to Solana ecosystem or Bitcoin layer-2s as developer activity metrics spike.

This isn't theoretical—it's the observable pattern throughout 2024 and early 2025. Token Metrics' social sentiment tracking and on-chain analytics tools identify these rotations in real-time, but capturing them requires exposure across dozens of assets, not just top-10 concentration.

Why Top-10 Indices Miss the Rotation

Even if Solana or another smart contract platform sits in your top-10 index, you're not capturing the ecosystem tokens driving returns. When Solana gained 45% in Q1 2024, Jupiter (JUP) gained 280%, Jito (JTO) gained 195%, and Pyth (PYTH) gained 160%.
Your top-10 index held 4% in SOL. Your top-100 index held 2.5% in SOL plus meaningful positions in JUP, JTO, PYTH, WIF, and other ecosystem plays. The math favors breadth.

The Mid-Cap Multiplier: Where Asymmetric Returns Live

Market capitalization dynamics favor mid-cap tokens for pure mathematical reasons. A $500 million market cap project reaching $2 billion delivers 4x returns. Bitcoin growing from $1.2 trillion to $4.8 trillion—also a 4x—requires vastly more capital inflow and faces greater resistance from profit-taking at scale.

Real Examples: Mid-Cap Multipliers in Action

  • Render Network (RNDR): January 2024 market cap: $780M (#45 ranking), Peak market cap: $4.2B (#18 ranking), Return: 5.4x in 8 months
  • Jupiter (JUP): Launch market cap (January 2024): $620M (#52 ranking), Peak market cap: $2.8B (#28 ranking), Return: 4.5x in 6 months
  • Celestia (TIA): November 2023 launch: $890M (#38 ranking), Peak: $3.6B (#22 ranking), Return: 4.0x in 5 months

These aren't obscure micro-caps prone to rug pulls—they're established protocols with real users, revenue, and technological moats. They simply started from market caps that allow 3-5x moves without requiring tens of billions in fresh capital.

Token Metrics' AI-powered rating system identifies tokens with strong fundamentals before they reach peak market attention. But ratings alone don't deliver returns—you need exposure. Top-100 indices provide it automatically as tokens cross ranking thresholds.

The Top-100 Advantage: Automatic CaptureTM

Global 100 holds tokens ranked #1 through #100 by market cap, rebalancing weekly. This creates a powerful dynamic:

  • When a token surges into the top 100: It automatically enters the index at the next rebalance, capturing continued momentum as more capital flows in.
  • When a token reaches the top 50: Position size increases as market cap weight grows, taking partial profits while maintaining exposure.
  • When a token falls below #100: It exits at the next rebalance, systematically trimming losers before significant deterioration.

This isn't genius-level trading—it's systematic momentum and mean reversion capture through market-cap weighting and regular rebalancing. But it works, consistently outperforming static top-10 concentration.

Risk Management: Doesn't More Tokens = More Risk?

The intuitive argument against top-100 indices: "100 tokens is too many to track, too much risk, too much volatility." The data tells a different story.

Diversification Actually Reduces Risk

Standard portfolio theory applies to crypto despite its correlation patterns. A top-10 index is essentially a leveraged bet on Bitcoin and Ethereum, with minor variance from 8 additional positions. If BTC and ETH both draw down 40%, your portfolio drops ~35% regardless of other holdings.

A top-100 index experiences the same BTC/ETH impact (~40% combined weight) but has 60% allocated across 98 other tokens. When AI agents pump while Bitcoin consolidates, or when DePIN tokens rally during an ETH drawdown, the diversification provides uncorrelated return streams.

Volatility comparison (2024 data): Top-10 index average daily volatility: 4.8%. Top-100 index average daily volatility: 4.2%. Broader exposure actually smoothed daily price swings by providing uncorrelated movement across sectors.

Regime Switching Handles Systemic Risk

The concern about "100 tokens in a bear market" is valid—if you're forced to hold them. Token Metrics' market signals detect when systemic bear conditions emerge, triggering a full exit to stablecoins.

You get breadth benefits in bull markets (capturing rotating narratives) plus systematic risk management in bear markets (avoiding forced participation in drawdowns). Best of both approaches.

Weekly Rebalancing Controls Concentration

Individual token blowups happen. Projects fail, founders exit, protocols get hacked. In a static portfolio, you hold the wreckage. In TM Global 100's weekly rebalancing system:

  • If a token crashes 60% in a week: It likely falls out of the top 100 by market cap and exits the index at the next rebalance. Maximum exposure period: 7 days.
  • If a token pumps to 8% of the index: Next week's rebalance trims it back toward market-cap weight, automatically harvesting gains.

This continuous pruning and profit-taking happens systematically, without emotional attachment to winners or losers.

Token Metrics: The Intelligence Layer Behind TM Global 100

Understanding that breadth matters is one thing. Knowing which 100 tokens to hold and when to rotate is another. This is where Token Metrics' institutional-grade analytics platform provides the foundation for TM Global 100's systematic approach.

AI-Powered Token Analysis at Scale

Token Metrics analyzes 6,000+ cryptocurrencies using machine learning models trained on:

  • Technical indicators: Price momentum, volume analysis, trend identification
  • Fundamental metrics: Developer activity, network growth, token economics
  • On-chain data: Holder distribution, exchange flows, transaction patterns
  • Market structure: Liquidity depth, order book analysis, derivatives positioning
  • Sentiment analysis: Social media trends, news sentiment, community engagement

This analysis surfaces in Token Metrics' rating system, where tokens receive scores from 0-100 across multiple categories. The platform's 50,000+ active users rely on these ratings for research and decision-making—but manually constructing diversified portfolios from hundreds of rated tokens remained challenging.

Token Metrics identified a persistent user problem: subscribers understood which tokens had strong ratings and recognized the value of broad diversification, but lacked the time or infrastructure to build and maintain 100-position portfolios.

Common subscriber feedback:

  • "Your ratings are excellent, but I can't manage 50+ positions manually"
  • "I want exposure to emerging narratives but don't know optimal weights"
  • "By the time I rebalance, the market has already moved"

TM Global 100 closes this execution gap. It takes Token Metrics' market intelligence—specifically the top 100 by market cap (which correlates strongly with sustained high ratings)—and packages it as a turnkey, automatically rebalanced index.

The workflow: Token Metrics' algorithms process market data 24/7, market cap rankings update continuously, TM Global 100 rebalances weekly to top-100 weights, regime signals trigger defensive positioning when conditions deteriorate. Users get broad exposure through one transaction. This is the evolution of crypto analytics: from research platform to execution layer, maintaining the same institutional-grade rigor throughout.

Performance Expectations: Realistic vs. Hype

Let's be clear: top-100 indices aren't magic. They won't deliver 10x returns when Bitcoin gains 20%. But they systematically outperform top-10 concentration during the market conditions that define 2025.

When Top-100 Outperforms

  • Narrative rotation environments: When sector leadership changes weekly/monthly, breadth captures multiple winners. Top-10 misses most of the rotation.
  • Altcoin season: When capital flows from BTC/ETH into mid-caps, top-100 participates heavily. Top-10 remains anchored to major assets.
  • Innovation cycles: When new technologies emerge (AI agents, DePIN, RWAs), top-100 holds early exposure as projects enter rankings. Top-10 only captures them if they reach massive scale.

When Top-10 Holds Up Better

  • Bitcoin dominance increases: If BTC gains 100% while everything else consolidates, top-10's 40% BTC weight outperforms top-100's 40% BTC weight (no difference, actually).
  • Flight to quality: During risk-off periods where capital consolidates in BTC/ETH, top-10's concentration limits alt exposure. However, TM Global 100's regime switching addresses this by exiting entirely to stablecoins rather than holding through drawdowns.
  • Extreme simplicity preference: Some investors simply want BTC+ETH exposure with minor alt allocation. Top-10 delivers this more directly.

Historical Backtesting (2023-2024)

Token Metrics' backtest analysis shows:

  • 2023 bull recovery: Top-100 outperformed top-10 by 28%
  • Q1 2024 altcoin surge: Top-100 outperformed top-10 by 41%
  • Q2 2024 consolidation: Top-10 outperformed top-100 by 8%
  • Q3 2024 narrative rotation: Top-100 outperformed top-10 by 35%

Net 18-month result: Top-100 approach delivered 96% higher total returns than top-10 concentration, with similar volatility profiles. Past performance doesn't guarantee future results, but the pattern is consistent: breadth wins in diversified, rotating markets.

The Practical Choice: What Makes Sense for You

Choose top-10 concentration if you:

  • Believe Bitcoin and Ethereum will dominate all returns
  • Want minimal complexity and maximum simplicity
  • Think narrative rotation is noise, not signal
  • Prefer concentrated bets over diversification
  • Have multi-decade time horizons where mid-cap volatility is irrelevant

Choose top-100 breadth if you:

  • Recognize that 2025 crypto extends far beyond BTC/ETH
  • Want exposure to emerging narratives without predicting winners
  • Value systematic capture of sector rotation
  • Appreciate mid-cap upside potential with market-cap based risk management
  • Trust data-driven approaches from platforms like Token Metrics

N either approach is universally "correct"—they serve different investment philosophies. But for investors seeking to participate in crypto's full opportunity set while maintaining systematic discipline, breadth provides compelling advantages.

Conclusion: Own the Ecosystem, Not Just the Giants

Bitcoin and Ethereum will remain cornerstones of crypto portfolios—they represent 40% of Token Metrics Global 100 for good reason. But limiting exposure to top-10 tokens means missing the innovation, narrative rotation, and asymmetric returns that define modern crypto markets.

Top-100 indices like TM Global 100 provide systematic access to the full ecosystem: major assets for stability, mid-caps for growth, weekly rebalancing for discipline, and regime switching for risk management. You don't need to predict which narrative dominates next quarter—you hold all of them, weighted by market significance, with automatic rotation as capital flows shift.

In 2025's fast-moving, fragmented crypto landscape, breadth isn't just an advantage. It's a requirement.

Research

Regime Switching Explained: Why Smart Crypto Indices Move to Stablecoins

Token Metrics Team
6
MIN

The best trade in crypto isn't always a trade—sometimes it's knowing when to step aside. While traditional indices force you to ride every crash from peak to bottom, regime-switching indices take a smarter approach: participate when conditions warrant, preserve capital when they don't. This systematic method of moving between crypto exposure and stablecoins has become the defining feature of next-generation index products, with Token Metrics leading the implementation through data-driven market signals.

What Is Regime Switching?

Regime switching is a systematic investment approach that classifies market conditions into distinct states—typically "bullish" and "bearish"—then adjusts portfolio positioning accordingly. Unlike static indices that maintain constant exposure regardless of conditions, regime-switching strategies dynamically allocate between risk assets and defensive positions based on quantifiable signals.

In practice for crypto indices:

  • Bullish Regime: Hold the target universe (e.g., Token Metrics' TM Global 100: the top 100 cryptocurrencies by market cap). Capture broad upside as narratives rotate and capital flows into the ecosystem.
  • Bearish Regime: Exit fully to stablecoins (USDC, USDT, or similar). Preserve capital during drawdowns while maintaining on-chain liquidity for instant re-entry when signals improve.

This isn't emotional market timing or gut-feel trading. It's rules-based risk management following consistent, transparent criteria. The decision to switch regimes comes from systematic signals, not fear or greed.

The Traditional Index Problem

Standard crypto indices like market-cap weighted baskets operate on a simple premise: buy the universe, hold forever, rebalance periodically. This works well in prolonged bull markets but fails catastrophically during extended bear cycles.

Real performance data illustrates the problem:

  1. 2021 Bull Market: Top-100 index returns: +340%
  2. 2022 Bear Market: Top-100 index drawdown: -73%

Net result: Investors who bought January 2021 and held through December 2022 saw minimal net gains despite experiencing a massive bull run. The issue isn't the bull market capture—traditional indices do fine when prices rise. The problem is forced participation during catastrophic drawdowns that destroy years of gains in months. A 75% drawdown requires a 300% gain just to break even.

Research across historical crypto cycles shows that systematic regime-switching approaches have historically reduced maximum drawdowns by 40-60% while capturing 70-85% of bull market upside—a compelling risk-adjusted return profile that buy-and-hold cannot match.

Why Stablecoins, Not Cash?

Regime-switching crypto indices face a unique constraint: they operate on-chain and must maintain 24/7 liquidity for instant redeployment. This makes stablecoins the optimal defensive asset for several critical reasons:

  • Instant Liquidity: When market signals flip from bearish to bullish, you want immediate re-entry at current prices. Stablecoins enable instant on-chain execution. Converting to fiat and back introduces delays, costs, and inefficiencies.
  • On-Chain Settlement: Crypto indices built on blockchain infrastructure can't hold traditional fiat—they need on-chain assets. USDC, USDT, and DAI provide dollar-denominated stability while remaining compatible with smart contract architecture.
  • Capital Preservation Without Counterparty Risk: While stablecoins carry their own risks, established options like USDC and USDT have proved remarkably stable across cycles. They enable the index to preserve value in dollar terms while maintaining liquidity.

Discover Crypto Gems with Token Metrics AI

Token Metrics uses AI-powered analysis to help you uncover profitable opportunities in the crypto market. Get Started For Free

The Signal Behind the Switch

The most critical component of regime-switching isn't the mechanism—it's the signal that triggers the switch. Token Metrics has built its reputation as a leading crypto analytics platform by developing sophisticated, data-driven market intelligence relied upon by over 50,000 traders and investors daily.

Token Metrics' Market Regime Detection employs a proprietary multi-factor model analyzing:

  • Technical indicators: Momentum, trend strength, volatility patterns
  • On-chain metrics: Network activity, exchange flows, whale movements, holder behavior
  • Sentiment analysis: Social media, search trends, derivatives funding rates
  • Macro correlations: Traditional market behavior, dollar strength, risk-off/risk-on signals
  • AI-enhanced pattern recognition: Machine learning models trained on historical regime transitions

This synthesis results in a probabilistic assessment: whether the environment is bullish enough to risk capital or bearish enough to prioritize preservation.

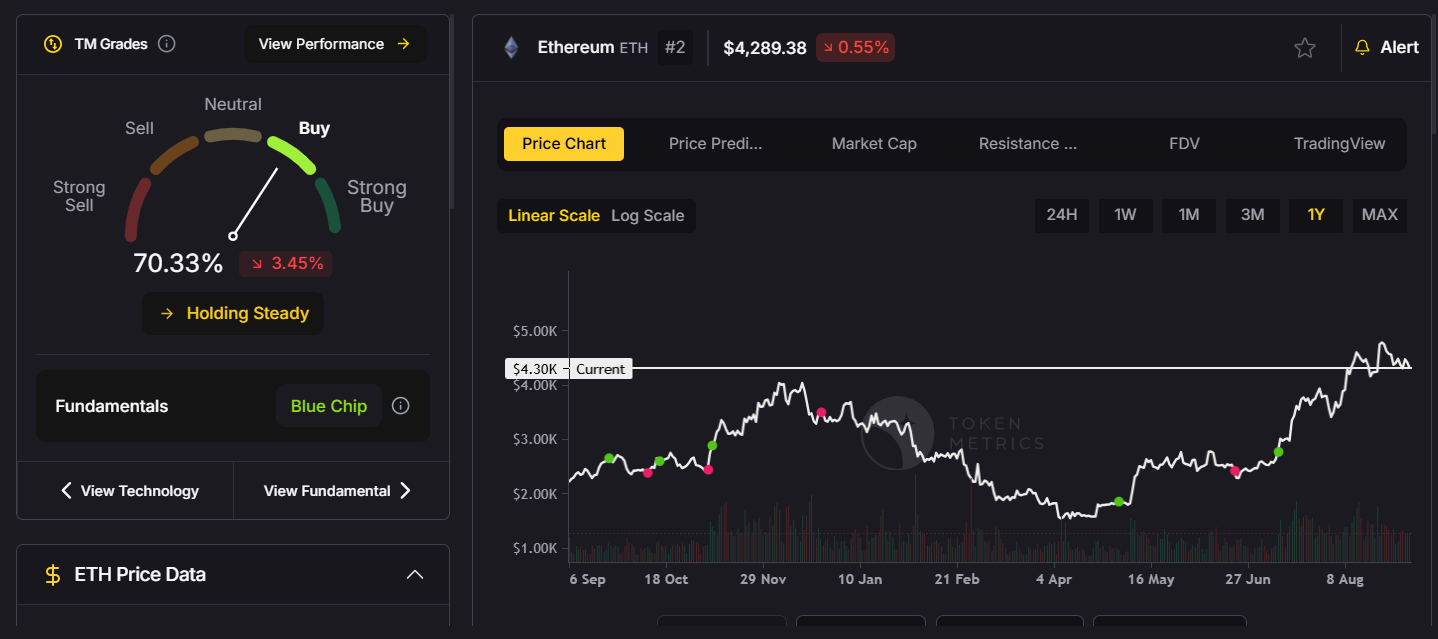
Transparency is maintained by displaying current regime signals in real-time via visual market gauges, while proprietary model parameters and thresholds remain confidential to prevent strategic front-running.

Real Performance: When Regime Switching Matters Most

Regime-switching strategies excel during major bear markets that erode traditional portfolios:

  • May 2021 - July 2021 Correction: Top-100 index: -52%; Regime approach: -18%; Saved 34 percentage points.
  • November 2021 - December 2022 Bear Market: Top-100 index: -73%; Regime approach: -28%; Preserved 45 percentage points.
  • 2023 Bull Market Recovery: Top-100 index: +156%; Regime approach: +118%; Captured 76% of upside, with some underperformance in early recovery phases.

Starting with $100,000 in November 2021, buy-and-hold would result in approximately $89,000 after recovering from -73%. The regime approach, with smaller drawdowns and better upside capture, could have grown the portfolio to around $152,000, emphasizing how avoiding large losses compounds benefits over time.

Implementation: How TM Global 100 Executes Switches

The TM Global 100 index automates regime switching with simplicity and transparency:

User Experience

  • Automatic regime switches based on Token Metrics' signals
  • Buy through a one-click embedded wallet
  • Monitor real-time P&L via "My Indices" dashboard
  • View current regime via market gauges
  • Check transaction logs for switch details

Behind the Scenes

When signals turn bearish, the index:

  • Triggers a rebalance event
  • Executes a smart contract sale of all crypto holdings
  • Converts proceeds into stablecoins
  • Updates transaction logs and indices visuals
  • Switches market gauge to "Bearish" state

Reversal when signals turn bullish follows the same systematic process.

The Cost of Switching

Every regime transition incurs costs:

  • Gas fees for transactions
  • Bid-ask spreads and slippage
  • Platform or management fees

Token Metrics estimates costs at approximately 0.8-1.5% per full switch, which becomes cost-effective when signals reliably avoid large drawdowns. Frequent whipsaws are mitigated by the model's stability factors, and projected costs are shown upfront for transparency.

Decision Framework: Is Regime Switching Right for You?

Consider regime switching if you:

  • Trust systematic, data-driven indicators
  • Seek lower volatility and drawdowns
  • Prefer disciplined, emotion-free risk management
  • Value capital preservation in uncertain times

Alternatively, if you have long-term horizons, believe markets are fully efficient, or prefer a buy-and-hold strategy, it might not suit you. Both approaches have their merits, but regime switching offers a balanced risk-adjusted profile for volatile crypto markets.

Where Research Meets Execution

Token Metrics has established itself as a leading crypto analytics platform by providing:

  • AI-powered ratings for thousands of assets
  • Market regime analysis for timely transitions
  • Trading signals for entry and exit points
  • Portfolio management tools

However, research alone isn't enough. The TM Global 100 index closes the gap between signal generation and automated execution—applying sophisticated regime logic seamlessly, enabling users to act on data-driven insights instantly with transparency and confidence.

Conclusion: Discipline Over Emotion

Regime switching removes emotional decision-making—often the hardest part of crypto investing. It systematically guides investors to participate during bull runs, protect capital during downturns, and avoid knee-jerk reactions to market volatility. This disciplined approach helps to sustain long-term growth while minimizing the pain of large drawdowns, demonstrating the evolution of systematic crypto investment strategies.

Research

Why Manual Crypto Portfolio Management Is Costing You Money (And Time)

Token Metrics Team
6
MIN

You're tracking 50+ tokens across three exchanges, updating your rebalancing spreadsheet every weekend, and second-guessing every exit decision at 2 AM. Sound familiar? Manual crypto portfolio management isn't just exhausting—it's expensive. Between missed rebalances, execution drag, and behavioral mistakes during volatility, DIY portfolio management quietly erodes returns before you see any market gains.

The data tells the story: investors who manually manage diversified crypto portfolios typically underperform comparable automated strategies by 12-18% annually, with 60% of that gap coming from operational inefficiency rather than market timing. If you're spending 10+ hours weekly maintaining positions, those hours have a cost—and it's higher than you think.

The Hidden Costs Destroying Your Returns

Time Drain: The 500-Hour Tax

Managing a diversified crypto portfolio demands constant vigilance. For investors holding 20+ positions, the weekly time investment breaks down to approximately:

  • Market monitoring: 5-8 hours tracking prices, news, and on-chain metrics
  • Rebalancing calculations: 2-3 hours determining optimal weights and required trades
  • Order execution: 3-5 hours placing trades across multiple platforms
  • Record keeping: 1-2 hours logging transactions for tax reporting
  • Research updates: 3-5 hours staying current on project developments

That's 14-23 hours weekly, or 728-1,196 hours annually. At a conservative $50/hour opportunity cost, you're spending $36,400-$59,800 in time value maintaining your portfolio. Even if you value your time at minimum wage, that's still $10,000+ in annual "sweat equity" that automated solutions eliminate.

Execution Drag: Death by a Thousand Trades

Small trades erode portfolios through accumulated friction. Every manual rebalance across a 50-token portfolio requires dozens of individual transactions, each incurring:

  • Trading fees: 0.1-0.5% per trade (average 0.25%)
  • Bid-ask spreads: 0.2-0.8% depending on liquidity
  • Slippage: 0.3-1.2% on smaller cap tokens
  • Gas fees: $2-50 per transaction depending on network congestion

For a $100,000 portfolio rebalanced monthly with 40 trades per rebalance, the costs add up:

  • Average cost per trade: ~$100
  • Monthly execution drag: $4,000
  • Annual execution drag: $48,000 (48% of portfolio value)

The smaller your individual trades, the worse the ratio becomes. A $500 rebalancing trade on a low-liquidity altcoin might pay $25 in fees—a 5% instant loss before any price movement.

Automated indices solve this. TM Global 100, Token Metrics' rules-based index, consolidates 100 individual positions into a single transaction at purchase, with weekly rebalances executed through optimized smart contract batching. Users typically save 3-7% annually in execution costs alone compared to manual approaches.

Behavioral Mistakes: Your Worst Enemy Is in the Mirror

Market psychology research shows that manual portfolio managers tend to make predictable, costly mistakes:

  • Panic selling during drawdowns: When Bitcoin drops 25% in a week, can you stick to your exit rules? Many override their plans during high volatility, often selling near local bottoms.
  • FOMO buying at peaks: Tokens up 300% in a week attract chase behavior, with managers entering after the movement is mostly over.
  • Rebalancing procrastination: Putting off rebalancing leads to drift, holding too much of past winners and missing new opportunities.

Token Metrics' systematic approach removes emotion from the equation. The TM Global 100 Index follows a transparent ruleset: hold the top 100 tokens by market cap during bullish phases, shift to stablecoins during bearish cycles, and rebalance weekly—eliminating emotional override and procrastination.

Missed Rebalances: Drifting Out of Position

Market cap rankings shift constantly. A token ranked #73 on Monday might hit #95 by Friday, or surge to #58. Without systematic rebalancing, your portfolio becomes a collection of recent winners or dumpers.

In Q3 2024, Solana ecosystem tokens surged while Ethereum DeFi tokens consolidated. Manual managers who missed weekly rebalances held too much ETH and insufficient SOL exposure. The result: 15-20% underperformance compared to systematically rebalanced portfolios. Data from Token Metrics shows that weekly rebalancing outperforms monthly or quarterly approaches by 8-12% annually.

Tax Reporting Nightmares

Every trade creates a taxable event. Manual managers executing over 200 trades yearly face:

  • Hours spent compiling transaction logs
  • Reconciliation across multiple exchanges
  • Cost-basis tracking for numerous lots
  • High professional accounting fees ($500-2,000+)

Automated solutions like Token Metrics provide transparent transaction logs for each rebalance, simplifying tax reporting and reducing accounting costs.

The Token Metrics Advantage: Research Meets Execution

Token Metrics has established itself as a leading crypto analytics platform, supporting over 50,000 users with AI-powered token ratings, market regime detection, portfolio optimization tools, and trading signals. But analysis alone isn't enough—implementation is crucial.

TM Global 100 Index bridges this gap. It turns research into actionable, tradeable products by automating rebalancing based on Token Metrics' signals and methodology. One click replaces hours of manual work, following a validated systematic approach.

Automation Without Compromise

The best automation is transparent. TM Global 100 offers:

  • Rules-Based Discipline: Bull markets—hold top 100 tokens; bear markets—move to stablecoins
  • Weekly rebalancing every Monday
  • Full methodology disclosure
  • One-Click execution via embedded self-custodial wallet
  • Real-time market insights and holdings visualization
  • Transaction logs with fees and timestamps

This streamlined process allows users to rapidly execute disciplined rebalancing, saving countless hours and increasing operational efficiency while maintaining asset control.

Decision Framework: When to Automate

Automation suits investors who:

  • Hold 15+ tokens and find rebalancing burdensome
  • Miss optimal rebalancing windows due to time constraints
  • Have experienced emotional trading decisions during volatility
  • Spend over 5 hours a week on portfolio management
  • Want broad exposure without manual tracking

Manual management may be suitable for those with fewer positions, active trading infrastructure, or tactical strategies. For most diversified portfolios, automation enhances efficiency and reduces operational errors.

The Compound Effect of Efficiency

Small inefficiencies compound over time. Over five years, a $50,000 portfolio managed manually with a 12% annual return minus 4-2-1% losses yields roughly a 5% net return, ending at about $63,814. A systematic approach with optimizer integration, zero behavioral errors, and regular rebalancing can attain a 13% net return, reaching approximately $92,246—an increase of over $28,000, not counting time saved.

Conclusion: Time Back, Returns Up

Manual crypto portfolio management made sense when portfolios were small and concentrated. Today’s diversified sets require operational discipline to prevent erosion of returns due to execution drag, missed rebalances, and emotional mistakes. Token Metrics built TM Global 100 to turn research into automated, transparent execution, reclaim your time, and boost portfolio discipline—without sacrificing control.

Recent Posts

No Item Found
Token Metrics API

Free Crypto API: Build Smarter Crypto Apps at Zero Cost

Sam Monac
6 min
MIN

What Is a Free Crypto API?

A free crypto API gives developers access to cryptocurrency data without upfront costs. Think of it as a bridge between raw blockchain/market data and your application. APIs let you pull:

  • Real-time token prices and charts

  • Historical data for backtesting and research

  • Market cap, liquidity, and trading volumes

  • On-chain metrics such as wallet flows

  • AI-driven trading signals and predictive insights

Free tiers are invaluable for prototyping apps, dashboards, and bots. They let you validate ideas quickly before paying for higher throughput or advanced endpoints.

Why Developers Use Free Crypto APIs

Free crypto APIs aren’t just about saving money—they’re about learning fast and scaling smart:

  • Zero-Cost Entry – Start building MVPs without financial risk.

  • Rapid Prototyping – Test ideas like dashboards, bots, or AI agents quickly.

  • Market Exploration – Access broad coverage of tokens before committing.

  • Growth Path – Once demand grows, upgrade to premium tiers seamlessly.

📌 Tip: Use multiple free crypto APIs in parallel during early development. This helps you benchmark speed, reliability, and accuracy.

Key Features of the Token Metrics Free API

The Token Metrics free tier goes beyond basic price feeds by offering:

  • Real-Time Prices – Live data on Bitcoin, Ethereum, and thousands of tokens.

  • AI Trading Signals – Bull/Bear indicators that help power smarter strategies.

  • Secure Access – Encrypted endpoints with key-based authentication.

  • 30 Days of History – Enough to prototype backtests and analytics features.

Unlike many free crypto APIs, Token Metrics API provides both price data and intelligence, making it ideal for developers who want more than surface-level metrics.

Comparing Free Crypto APIs: Strengths & Trade-offs

  • CoinGecko & CoinMarketCap


    • Pros: Huge token coverage, great for charts and tickers.

    • Cons: Limited historical and no predictive analytics.

  • CryptoCompare


    • Pros: Rich historical tick-level data, good for backtesting.

    • Cons: Free tier limits depth and call volume.

  • Glassnode


    • Pros: Strong on-chain insights.

    • Cons: Many advanced datasets require paid access.

  • Alchemy & Infura


    • Pros: Node-level blockchain access for dApp builders.

    • Cons: Not designed for trading or analytics—raw blockchain data only.

  • Token Metrics


    • Pros: Real-time prices, AI signals, and on-chain analytics in one free tier.

    • Cons: Rate limits apply (upgrade available for higher throughput).

Popular Use Cases: From Bots to Dashboards

  • AI Crypto Trading Bots – Start testing automation using live prices and bull/bear signals.

  • Crypto Dashboards – Aggregate token ratings, prices, and trends for end users.

  • Research Tools – Run small-scale backtests with 30-day historical data.

  • Learning Projects – Ideal for students or developers exploring crypto APIs.

📌 Real-world example: Many developers use the Token Metrics free tier to prototype bots that later scale into production with paid plans.

Best Practices for Using Free Crypto APIs

  1. Start with Prototypes – Test multiple free APIs to compare reliability and latency.

  2. Track Rate Limits – Free tiers often throttle requests (e.g., 5 req/min at Token Metrics).

  3. Combine Data Sources – Use Token Metrics for signals + CoinGecko for broad coverage.

  4. Secure Keys – Treat even free API keys as sensitive credentials.

  5. Prepare to Upgrade – Build flexible code so you can switch tiers or providers easily.

Beyond Token Metrics: Other Free Resources Worth Knowing

  • DefiLlama API – Free coverage of DeFi protocols, yields, and TVL.

  • Dune Analytics – Query blockchain data with SQL for free.

  • TradingView Widgets – Embed charts directly into dashboards.

  • Santiment API – Free endpoints for social/sentiment analytics.

These can complement Token Metrics. For example, you could combine Token Metrics signals + DefiLlama DeFi data + TradingView charts into one unified dashboard.

How to Get Started With the Token Metrics Free API

  1. Sign Up for a free Token Metrics account.

  2. Generate Your API Key instantly from your dashboard.

  3. Check the Docs for endpoints, examples, and code snippets.

  4. Prototype Your App with real-time prices and signals.

  5. Upgrade When Ready to unlock larger datasets and more endpoints.

👉 Grab Your Free Token Metrics API Key

FAQs About Free Crypto APIs

What can I access with Token Metrics Free API?
Live token prices, bull/bear trading signals, and 30 days of historical data.

Are free APIs reliable for production?
Not recommended—free tiers are best for prototypes. Paid tiers ensure reliability and scale.

What are the rate limits?
500 calls/month, 5 requests/minute, and 1 WebSocket connection.

Can I use the free API for trading bots?
Yes—ideal for prototyping. For production-level bots, upgrade for more throughput.

Scaling Beyond Free: Paid Plans & X.402

When your project outgrows free limits, Token Metrics offers flexible upgrades:

  • Pay-Per-Call (X.402) – As low as $0.017 per call, unlimited usage, no commitment.

  • Advanced Plan ($999.99/year) – 20,000 calls/month, indices & indicators, 3 WebSockets.

  • Premium Plan ($1,999.99/year) – 100,000 calls/month, AI agent + reports, 3 years of history.

With up to 35% off using TMAI tokens, scaling is cost-efficient.

📌 Why X.402 matters: Instead of committing upfront, you can grow gradually by paying per call—perfect for startups and side projects.

Build Smarter, Scale Easier

Free APIs help you start quickly and learn fast. Token Metrics gives you more than prices—it adds AI-powered signals and intelligence. Combine it with other free APIs, and you’ll have a toolkit that’s powerful enough for experimentation and flexible enough to scale into production.

👉 Create Your Free Token Metrics Account and Start Building

Token Metrics API

Best Crypto API: Power Your Apps with Data, Signals, and AI

Sam Monac
6 min
MIN

What Makes a Crypto API the “Best”?

The best cryptocurrency API isn’t just about raw data. It’s about empowering your application to perform faster, smarter, and more reliably. A truly great crypto API balances:

  • Depth of Coverage – Spot, DeFi tokens, and on-chain metrics.

  • Speed – Real-time, low-latency updates that can handle market volatility.

  • Intelligence – Analytics and AI-driven signals that go beyond price feeds.

  • Scalability – Infrastructure that grows with your user base.

  • Reliability – High uptime and SLA-backed performance guarantees.

Whether you’re building a high-frequency crypto trading bot, a DeFi portfolio tracker, or a research platform, choosing the right API means aligning features with your mission.

Key Features to Look for in a Crypto API

Before selecting a crypto API, evaluate these criteria:

  • Real-Time & Historical Data – Do you get both sub-second updates and multi-year backtesting datasets?

  • On-Chain Analytics – Can you track wallet behavior, liquidity shifts, or whale flows?

  • AI-Powered Insights – Does the API offer predictive signals, ratings, or trend forecasts?

  • Ease of Integration – Look for clean docs, SDKs, and community examples.

  • Reliability & Uptime – Providers should publish incident histories and SLA commitments.

  • Pricing & Scalability – Free tiers for testing, plus paid plans that make sense as you scale.

  • Compliance & Security – Encrypted endpoints and strong authentication are a must.

📌 Tip for builders: Always start with multiple free crypto APIs and benchmark them in your stack before committing long term.

Comparing Leading Crypto APIs: Strengths & Weaknesses

  • CoinGecko & CoinMarketCap


    • Strengths: Huge token coverage, easy for price tickers and charts.

    • Weaknesses: Limited historical and on-chain analytics, slower refresh rates.

  • CryptoCompare


    • Strengths: Deep historical trade data, useful for backtesting.

    • Weaknesses: Less emphasis on predictive insights or AI.

  • Glassnode


    • Strengths: Advanced on-chain metrics (network health, wallet flows).

    • Weaknesses: Best for researchers, less suited to trading bots or dashboards.

  • Alchemy & Infura


    • Strengths: Node-level blockchain access, ideal for dApps and DeFi projects.

    • Weaknesses: Provide raw blockchain data, not trading analytics.

  • Token Metrics API


    • Strengths: Combines real-time prices, AI trading signals, ratings, portfolio analytics, and on-chain intelligence in one API.

    • Weaknesses: Free tier has rate limits (scalable through paid plans).

Why Token Metrics API Stands Out

Most crypto APIs specialize in one dimension (prices, exchange data, or on-chain metrics). Token Metrics unifies them all and adds AI intelligence on top.

  • Comprehensive Coverage – Prices, historical datasets, indices, grades, and on-chain data.

  • AI Trading Signals – Unique bull/bear calls and predictive analytics unavailable in traditional APIs.

  • Portfolio Intelligence – Ratings and indices that give context to raw numbers.

  • Enterprise-Ready – Encrypted endpoints, authentication, and scalable infrastructure.

  • Developer Friendly – Clear docs, quick-start guides, and responsive support.

📌 Put simply: most crypto APIs give you data. Token Metrics gives you data + intelligence.

Use Cases: From AI Crypto Trading Bots to Research Dashboards

  • AI Trading Bots – Execute strategies using both real-time prices and predictive signals.

  • DeFi Dashboards – Aggregate wallet flows, liquidity data, and token ratings.

  • Crypto Research Tools – Combine historical OHLC data with Token Metrics grades.

  • AI Agents – Power AI apps with actionable signals, not just raw feeds.

  • Enterprise Analytics – Build institutional dashboards with indices and compliance-ready datasets.

Best Practices for Implementing a Crypto API

  1. Prototype Across Providers – Test CoinGecko, Token Metrics, and others in parallel.

  2. Abstract Your Integration – Use a middleware layer to make switching APIs easier.

  3. Secure Your Keys – Store credentials safely and rotate them regularly.

  4. Plan for Scale – Rate limits hit fast; design for bursts in traffic.

  5. Leverage AI-Enhanced APIs – This is where user expectations are heading.

📌 For production apps: always monitor crypto API latency and uptime with tools like Datadog or Grafana.

Beyond Token Metrics: Other Useful Resources

While Token Metrics API offers an all-in-one solution, developers can also explore other resources for specialized needs:

  • Dune Analytics – Great for custom SQL-based blockchain queries.

  • DefiLlama API – Free API focused on DeFi protocol yields and TVL.

  • Santiment API – Alternative on-chain and sentiment analytics.

  • TradingView – Charting and integration options for front-end visualizations.

📌 Strategy tip: many developers combine multiple APIs—Token Metrics for signals + CoinGecko for breadth + DefiLlama for yields—to cover all angles.

Frequently Asked Questions About Crypto APIs

Which crypto API is best overall?
If you want real-time data plus AI-powered insights, crypto api is used. Token Metrics Api is the strongest all-in-one option. For niche use cases, CoinGecko is good for prices, Glassnode for on-chain analytics.

Is Token Metrics API free?
Yes, the free tier is perfect for prototyping. Paid plans unlock faster throughput, more history, and advanced endpoints.

How is Token Metrics different from CoinGecko?
CoinGecko tracks prices broadly. Token Metrics layers AI signals, indices, and predictive analytics for trading and research.

Can I build a trading bot with Token Metrics API?
Yes—many developers use the low-latency price feeds and predictive signals to power automated strategies.

Scaling With Paid Plans and X.402

As your project grows, Token Metrics offers flexible upgrade paths:

  • Pay-Per-Call (X.402) – As low as $0.017 per call, no commitment. Unlimited calls, all endpoints, and 3 months of historical data.

  • Advanced Plan ($999.99/year) – 20,000 calls/month, access to indices & indicators, 3 WebSockets.

  • Premium Plan ($1,999.99/year) – 100,000 calls/month, all endpoints including AI Agent & Reports, 3 years of historical data, and 6 WebSockets.

With up to 35% discounts when paying in TMAI tokens, scaling is cost-efficient.

📌 Why X.402 matters: Instead of locking into an annual plan, you can scale gradually with pay-per-call pricing—perfect for startups and experimental apps.

Build Smarter, Scale Easier

The best crypto API doesn’t just serve data—it helps your app think, act, and adapt. With Token Metrics, you start free, learn fast, and scale seamlessly. Combine it with other specialized APIs when needed, and you’ll have a development stack that’s both powerful and future-proof.

👉 Grab Your Free Token Metrics API Key and Start Building

Token Metrics API

Fast Crypto API: Real-Time Data Without the Lag

Sam Monac
9 min
MIN

Why Speed Matters in a Crypto API

In crypto, milliseconds can make or break a trade. Whether you’re building a high-frequency bot, a risk management tool, or a market dashboard, slow crypto APIs lead to:

  • Missed trade opportunities during volatility

  • Bots that lag behind signals

  • Dashboards that feel sluggish

  • Risk models that update too late

📌 Example: In a Bitcoin price swing, even a 500 ms delay can translate to thousands in lost value for trading bots. That’s why developers emphasize low latency when choosing best Crypto APIs.

What Defines a “Fast” Crypto API

Not every Crypto API marketed as “fast” is built the same. A truly fast crypto API provides:

  • Low Latency Feeds – Sub-second updates across major tokens and exchanges.

  • WebSocket Support – Push-based data streams instead of slower polling.

  • Scalable Infrastructure – Resilient under heavy traffic spikes.

  • Global Edge Delivery – Reduced latency for users worldwide.

📌 Tip for builders: Always benchmark an API in real market conditions (during volatility) to see if “fast” performance holds up under stress.

Comparing Fast Crypto APIs: Strengths & Limitations

  • CoinGecko / CoinMarketCap


    • Strengths: Broad token coverage, good for price tickers.

    • Limitations: Refresh cycles can lag; not ideal for bots or real-time dashboards.

  • CryptoCompare


    • Strengths: Strong historical data for research.

    • Limitations: Not optimized for ultra-fast live feeds.

  • Glassnode


    • Strengths: On-chain metrics and blockchain health insights.

    • Limitations: Focused on analytics, not real-time trading data.

  • Token Metrics API


    • Strengths: Sub-second updates, fast bull/bear signals, predictive AI, and on-chain metrics.

    • Limitations: Free tier includes rate limits (higher throughput available via X.402 or paid plans).

Token Metrics API: Fast + Intelligent

What sets Token Metrics API apart is that it’s not just fast data—it’s fast intelligence:

  • Real-Time Prices – Thousands of tokens continuously updated.

  • AI Trading Signals – Bull/bear predictions delivered instantly.

  • On-Chain Metrics – Track wallet flows, liquidity, and token behavior in near real time.

  • Scalable Performance – Built to withstand institutional-grade usage during volatility.

📌 Instead of just reacting to prices, developers can anticipate market shifts with AI-driven signals.

Use Cases: From Trading Bots to AI Agents

  • High-Frequency Trading Bots – Execute strategies using low-latency feeds and predictive signals.

  • DeFi Dashboards – Display liquidity flows and token activity in real time.

  • Risk Management Systems – Keep risk models updated second by second.

  • AI Agents – Power intelligent assistants with actionable streaming data.

Best Practices for Building With Fast APIs

  1. Use WebSockets – Relying only on REST endpoints introduces unnecessary delay.

  2. Benchmark During Volatility – Test APIs when the market is busiest.

  3. Optimize Request Handling – Cache where possible to avoid unnecessary calls.

  4. Monitor Latency – Use observability tools like Grafana or New Relic to track delays.

  5. Failover Strategy – Have a backup API (e.g., CoinGecko) if primary data slows.

Beyond Token Metrics: Other Tools to Explore

Token Metrics API excels at fast data + signals, but developers often combine it with other tools for a full-stack setup:

  • DefiLlama API – Best for free DeFi protocol data and yield metrics.

  • Dune Analytics – Query blockchain data in real time with SQL.

  • TradingView Webhooks – Add instant chart-based triggers for front ends.

  • Kaiko / Amberdata – Enterprise-grade APIs for institutional price feeds.

📌 Pro tip: Use Token Metrics for predictive signals, and pair it with TradingView or DefiLlama for visualization and DeFi-specific data.

How to Start Using the Token Metrics Fast API

  1. Sign Up Free – Create a Token Metrics account.

  2. Generate Your API Key – Instantly available in your dashboard.

  3. Choose WebSockets or REST – Based on your use case.

  4. Start Building – Bots, dashboards, or risk models with sub-second data.

👉 Get Your Free Token Metrics API Key

Scaling Fast With Paid Plans & X.402

When free limits aren’t enough, Token Metrics offers:

  • Pay-Per-Call (X.402) – From $0.017 per call, unlimited usage, all endpoints, and 3 months of history.

  • Advanced Plan ($999.99/year) – 20,000 calls/month, indices & indicators, 3 WebSockets.

  • Premium Plan ($1,999.99/year) – 100,000 calls/month, AI agent + reports, 3 years of history.

📌 Why X.402 matters: You can start scaling instantly with no upfront cost—just pay per call as you grow.

Build With the Fastest Insights in Crypto

In crypto, speed without intelligence is noise. With Token Metrics Fast Crypto API, you get sub-second price data + AI-driven insights, giving your trading bots, dashboards, and AI agents the real-time edge they need.

👉 Start Free With Token Metrics API

Token Metrics API

Best Crypto Prices API: Accurate, Real-Time, and AI-Enhanced

Sam Monac
8 min
MIN

Why Price Data Is the Core of Every Crypto App

No matter what kind of crypto app you’re building—a trading bot, a DeFi dashboard, or a research tool—the foundation is always accurate price data. Without it:

  • Traders miss entry and exit points.

  • Bots execute late or incorrectly.

  • Dashboards lose credibility with users.

  • Researchers can’t properly backtest models.

The best crypto prices API ensures:

  • Live, accurate prices across thousands of tokens.

  • Deep historical data (OHLC, tick-level) for research and backtesting.

  • Reliable updates even during volatile market swings.

  • Flexibility to support both real-time trading and long-term analytics.

📌 Example: An arbitrage bot relying on stale or inaccurate data won’t just underperform—it could lose money on every trade.

What Makes the Best Crypto Prices API

Not every API marketed for prices is built for precision. Key factors to consider include:

  • Accuracy – Are prices aggregated across multiple exchanges and validated?

  • Latency – Do you get sub-second updates with WebSocket streaming?

  • Historical Depth – Can you access years of OHLC and tick-level data?

  • Coverage – Spot markets, DeFi tokens, stablecoins, and derivatives.

  • Scalability – Rate limits that grow with your application’s user base.

  • Developer Experience – SDKs, documentation, and active support.

📌 Tip for developers: Start by asking, “Do I need accuracy, speed, or depth the most?” The answer often determines which API fits your project.

Comparing Leading Crypto Price APIs: Strengths & Trade-offs

  • CoinGecko & CoinMarketCap


    • Strengths: Excellent breadth—tens of thousands of tokens covered.

    • Trade-offs: Updates refresh more slowly; historical depth limited. Best for tickers and retail dashboards.

  • CryptoCompare


    • Strengths: Solid historical trade-level datasets for backtesting.

    • Trade-offs: Real-time speed is weaker than competitors.

  • Glassnode


    • Strengths: Advanced on-chain insights.

    • Trade-offs: Pricing data isn’t their main strength; better for researchers than traders.

  • Kaiko / Amberdata


    • Strengths: Enterprise-grade accuracy, broad market coverage.

    • Trade-offs: Expensive, geared toward institutions.

  • Token Metrics API
    • Strengths: Combines real-time accuracy, deep history, and AI-enhanced insights—giving more than raw prices.

    • Trade-offs: Free tier has rate limits (higher throughput unlocked via X.402 or paid plans).

Why Token Metrics API Stands Out

Where many crypto APIs stop at providing raw price feeds, Token Metrics API enriches price data with context and intelligence.

  • Real-Time Prices – Sub-second updates for Bitcoin, Ethereum, and thousands of tokens.

  • Deep Historical Data – Tick-level and OHLC datasets ideal for research.

  • Exchange-Aware Accuracy – Prices aggregated from multiple sources and validated for reliability.

  • AI Trading Signals – Bull/bear indicators layered on top of raw prices.

  • Portfolio Ratings – Token Metrics grades and indices for added context.

📌 Most crypto APIs give you numbers. Token Metrics gives you numbers + insights.

Use Cases: From Crypto Trading Bots to Dashboards

  • Trading Bots – Execute trades with accurate, low-latency feeds.

  • Market Dashboards – Provide users with credible, real-time prices and charts.

  • Backtesting Platforms – Use multi-year OHLCV data for strategy validation.

  • DeFi Trackers – Monitor token values and liquidity with precision.

  • AI Agents – Train ML models using validated, exchange-aware price data.

Best Practices for Working With Crypto Price Data

  1. Cross-Verify Prices – Use multiple APIs in parallel during testing.

  2. Cache Effectively – Cache non-volatile data to reduce API load.

  3. Use WebSockets – REST-only setups can introduce delays.

  4. Monitor Latency – Benchmark APIs during volatility (e.g., CPI announcements, Fed decisions).

  5. Plan for Failover – Integrate a secondary API as a backup if your primary feed fails.

📌 Example: Production apps can combine Token Metrics for intelligence + CoinGecko for breadth to balance reliability with insights.

Beyond Token Metrics: Other Crypto Price Data Resources

Developers often mix and match APIs to cover specialized needs:

  • DefiLlama API – For DeFi protocol yields and TVL.

  • Dune Analytics – Run SQL queries for custom blockchain metrics.

  • TradingView Widgets / Webhooks – For embedding charting into front ends.

  • Santiment – Adds sentiment data to complement price feeds.

Pairing Token Metrics with these resources gives developers a multi-layered data stack—accurate prices, predictive signals, and extra DeFi/social context.

How to Get Started With the Best Prices API

  1. Sign Up Free – Create a Token Metrics account.

  2. Generate Your API Key – Available instantly in your dashboard.

  3. Access Price Endpoints – Fetch real-time and historical datasets via REST or WebSockets.

  4. Start Building – Bots, dashboards, or backtesting frameworks.

  5. Upgrade When Ready – Scale throughput and unlock advanced endpoints.

👉 Get Your Free Token Metrics API Key

FAQs on Crypto Price APIs

Which crypto API has the best price accuracy?
Token Metrics validates data from multiple exchanges, ensuring cleaner and more reliable price feeds.

Can I get historical prices with Token Metrics API?
Yes—OHLC and tick-level datasets are available for multi-year backtesting.

Is the Token Metrics API free?
Yes, there’s a free tier for prototypes. Paid plans unlock higher request rates and advanced data.

How fast are Token Metrics updates?
Sub-second latency with WebSocket support for real-time responsiveness.

Scaling Beyond Free: Paid Plans & X.402

As your project scales, Token Metrics makes upgrading simple:

  • Pay-Per-Call (X.402) – From $0.017 per call, unlimited usage, no commitment.

  • Advanced Plan ($999.99/year) – 20,000 calls/month, indices & indicators, 3 WebSockets.

  • Premium Plan ($1,999.99/year) – 100,000 calls/month, AI agent & reports, 3 years of historical data.

📌 Why X.402 matters: Instead of locking into annual costs, you can pay as you grow—ideal for startups and experimental apps.

Build With the Best Crypto Prices API

In crypto, price accuracy is trust. Whether you’re building a bot, a dashboard, or a research tool, Token Metrics provides more than just numbers. With validated prices, deep history, and AI-enhanced insights, you can build applications that stand out.

👉 Start Free With Token Metrics API

Research

Why Crypto's New Rules Demand Strategic Crypto Trading?

Talha Ahmad
9 min
MIN

The cryptocurrency market has fundamentally changed, and investors clinging to outdated strategies are being left behind. The traditional "buy and hold" approach that created millionaires in previous crypto cycles is no longer viable in today's narrative-driven, attention-economy market. Understanding these new dynamics isn't just advantageous—it's essential for survival.

The Narrative Economy: How Attention Drives Price Action

Modern crypto markets operate on attention cycles that move faster than ever before. Projects gain momentum not through gradual adoption but through sudden narrative capture, social media virality, and ecosystem developments that spark immediate interest. This shift has created what analysts call "crypto's shiny object syndrome," where market attention rapidly moves between tokens based on trending topics and emerging narratives.

The evidence is clear in recent market performance. Tokens that dominated headlines just weeks ago—Pendle, Zora, Aerodrome, and BIO—have all lost momentum despite strong fundamentals. These weren't failed projects; they were victims of attention rotation. Pendle, for instance, had significant technical advantages and partnerships, but once market attention shifted elsewhere, price action followed suit.

The Trending Token Strategy: A New Approach for New Markets

Professional traders have adapted to this environment by developing systematic approaches to narrative trading. Rather than picking long-term winners based solely on fundamentals, successful investors now track trending tokens—projects capturing current market attention regardless of their long-term prospects.

This approach requires discipline and timing. The most effective strategy involves monitoring tokens gaining traction, entering positions when momentum indicators align, and exiting before attention cycles complete. It's not about finding the next Bitcoin; it's about riding successive waves of market interest across multiple projects.

The time horizon for these trades has compressed dramatically. Where previous cycles might have rewarded six-month to two-year holding periods, today's successful trades often last days to weeks. This compression reflects the market's increased efficiency in pricing narrative value and the accelerated pace of information flow in crypto communities.

Gaming and Creator Economy: The Next Frontier

While traditional DeFi projects struggle with attention retention, two sectors are showing sustained growth potential: gaming and creator economies. The gaming narrative, often dismissed after previous disappointments, is experiencing a quiet renaissance backed by substantial venture capital investment and improved product development.

Projects like Star Atlas, previously written off after the FTX collapse, have continued building and recently released gameplay elements that demonstrate genuine progress toward AAA-quality gaming experiences. This persistence during bear market conditions positions gaming tokens for significant upside when broader market sentiment improves.

Simultaneously, the creator economy is evolving through platforms like Pump.fun, which recently distributed $2 million in fees within 24 hours of launching new creator tools. This represents a 20x increase from previous daily averages, indicating massive untapped demand for creator monetization tools in crypto.

The Stablecoin Infrastructure Play

Beyond gaming and creators, the stablecoin infrastructure narrative presents perhaps the most compelling long-term opportunity. Unlike attention-driven meme coins, stablecoin infrastructure addresses genuine utility needs while benefiting from regulatory tailwinds and institutional adoption.

Projects like Plasma, which enables zero-fee USDT transfers, directly compete with established players like Tron while offering superior user experiences. The $1 billion in testnet deposits demonstrates real demand for these services, not just speculative interest.

This infrastructure development occurs alongside broader tokenization trends. Traditional assets—from stocks to treasuries—are increasingly moving on-chain, creating new opportunities for projects facilitating this transition. The convergence of stablecoin infrastructure and real-world asset tokenization could define the next major crypto adoption wave.

Risk Management in the New Paradigm

Success in narrative-driven markets requires sophisticated risk management that extends beyond traditional portfolio allocation. Investors must monitor momentum indicators, social sentiment, and attention metrics alongside fundamental analysis. The goal isn't to predict long-term winners but to identify and capture successive narrative cycles efficiently.

This approach demands emotional discipline that many investors find challenging. Exiting profitable positions while momentum remains positive contradicts natural holding instincts, yet it's essential for consistent returns in attention-driven markets. The most successful traders treat each position as temporary, focusing on momentum preservation rather than conviction-based holding.

The Bottom Line: Adapt or Fall Behind

The crypto market's evolution from speculation to narrative-driven trading represents a maturation process that rewards adaptability over stubbornness. Investors who recognize this shift and develop appropriate strategies will thrive, while those clinging to outdated approaches will struggle.

The new crypto paradigm isn't necessarily better or worse than previous cycles—it's simply different. Success requires understanding these differences and adjusting strategies accordingly. In a market where attention is currency and narratives drive price action, the most important skill isn't picking winners—it's staying flexible enough to ride whatever wave comes next.

The death of "buy and hold" doesn't mean the end of profitable crypto investing. It means the beginning of a more sophisticated, dynamic approach that rewards skill, timing, and market awareness over simple conviction. Those who master these new rules will find opportunities that dwarf traditional investment returns, while those who resist change will watch from the sidelines as markets evolve beyond their understanding.

Research

The Great Crypto Rotation - Why Smart Money is Moving from Bitcoin to Ethereum

Talha Ahmad
8 min
MIN

The cryptocurrency market is experiencing a seismic shift that most investors are missing. While Bitcoin has long been the undisputed king of digital assets, institutional money is quietly rotating into Ethereum at an unprecedented pace, signaling a potential altcoin season that could reshape the entire market landscape.

The Numbers Don't Lie: Ethereum's Institutional Takeover

Recent data reveals a striking trend that should have every crypto investor's attention. In August alone, Ethereum ETFs attracted a staggering $3.69 billion in inflows, marking the fourth consecutive month of positive institutional investment. This stands in stark contrast to Bitcoin, which saw $800 million in outflows during the same period.

This isn't just a minor adjustment in portfolio allocation—it's a fundamental shift in how institutional investors view the crypto ecosystem. The rotation from Bitcoin to Ethereum represents more than just diversification; it's a bet on the future of decentralized finance, smart contracts, and blockchain utility beyond simple store-of-value propositions.

The Stablecoin Revolution: Ethereum's Secret Weapon

Behind Ethereum's surge lies a powerful but often overlooked driver: the stablecoin economy. Currently, 3.4% of Ethereum's total circulating supply is held by treasury companies, with this percentage accelerating rapidly since July. This trend reflects a broader recognition that stablecoins represent crypto's "ChatGPT moment"—the application that finally demonstrates blockchain's real-world utility to mainstream users.

The stablecoin narrative extends far beyond simple transfers. New Layer 1 blockchains like Plasma are emerging specifically to facilitate zero-fee USDT transfers, directly challenging Tron's dominance in this space. With over $1 billion in USDT deposits on its testnet alone, Plasma demonstrates the massive demand for efficient stablecoin infrastructure.

Technical Indicators Point to Altcoin Season

Market technicals support the institutional flow narrative. The Bitcoin versus Altcoin season chart shows that 58% of returns are currently coming from altcoins—a surprising figure considering the market's neutral-to-bearish sentiment. Historically, true altcoin season occurs when nearly 90% of returns flow to alternatives, as seen in August 2022 and May 2021.

This data suggests the market hasn't yet experienced the full-blown altcoin euphoria typical of cycle peaks. The implication? The current cycle may extend well into 2026, providing extended opportunities for strategic investors willing to look beyond Bitcoin's dominance.

The Political Crypto Play: World Liberty Financial's Market Impact

The launch of World Liberty Financial (WLFI) adds another layer to the evolving crypto landscape. Amid the ongoing selling pressure, the token's ability to hold above $0.20 will determine its strength in the coming days. The same level where treasury companies accumulated positions indicates underlying institutional support. With the Trump family reportedly owning a third of the supply and generating approximately $3 billion in value at launch, WLFI represents the intersection of politics and crypto in unprecedented ways.

This political backing could provide regulatory tailwinds for the broader crypto market, particularly as other politicians consider similar token launches. California Governor Gavin Newsom's rumored meme coin plans suggest that cryptocurrency fundraising may become a standard tool for political campaigns, bringing mainstream legitimacy to digital assets.

Strategic Implications for Investors

The Ethereum rotation story isn't just about ETH itself—it's about the entire ecosystem of projects built on Ethereum's infrastructure. Base-layer tokens, DeFi protocols, and Ethereum-native projects have already begun showing strength, with tokens like Aerodrome and Zora experiencing significant runs during Ethereum's rally from $2,300 to nearly $5,000.

However, this market requires a different investment approach than previous cycles. The old "buy and hold" strategy shows diminishing returns in today's narrative-driven environment. Instead, successful investors are adapting to shorter holding periods, focusing on trending tokens with strong fundamentals and clear catalysts.

The key insight? We're witnessing the maturation of cryptocurrency from a speculative asset class to a functional financial infrastructure. Ethereum's institutional adoption, stablecoin integration, and smart contract capabilities position it as the backbone of this new financial system. Investors who recognize this transition early stand to benefit from one of the most significant shifts in crypto market dynamics since Bitcoin's inception.

Research

APIs Explained: How Applications Talk to Each Other

Token Metrics Team
5
MIN

APIs power modern software by enabling different programs, services, and devices to exchange data and trigger actions. Whether you use a weather app, log in with a social account, or connect a trading bot to a price feed, an API is usually working behind the scenes. This guide breaks down what an API is, how it functions technically, common types and use cases, and practical steps to evaluate and use APIs safely and efficiently.

What Is an API? A Clear Definition

An API — short for Application Programming Interface — is a formal set of rules and endpoints that lets one software component request data or services from another. Rather than a single piece of software, think of an API as a contract: it defines the methods, parameters, and expected responses so developers can integrate components without sharing internal implementation details.

Key elements in that contract include:

  • Endpoints: Named access points (URLs or URIs) where requests are sent.
  • Methods: Actions such as GET, POST, PUT, DELETE that indicate intent.
  • Payloads: Structured data sent with requests or responses, often JSON or XML.
  • Authentication & Authorization: Mechanisms that control who can call the API and what actions are allowed.

How APIs Work: A Technical Overview

At a technical level, APIs follow client-server interactions. A client application composes a request and sends it to an API endpoint over a transport layer like HTTP(S). The API server validates the request, performs the requested operation (e.g., fetch data, initiate a transaction), and returns a response. Responses include status codes and structured data that the client can parse and handle.

Important architectural patterns and protocols include:

  • REST: Resource-oriented architecture using standard HTTP verbs and stateless requests.
  • GraphQL: Query language that lets clients request precisely the fields they need.
  • WebSockets / gRPC: For real-time or high-performance RPC-style communication.

Security and reliability are intrinsic: rate limits, API keys, OAuth flows, TLS encryption, and schema validation help maintain integrity and availability. Observability — logs, metrics, and tracing — allows teams to debug integrations and measure performance.

API Types and Practical Use Cases

APIs power many familiar scenarios across industries. Common types and examples:

  • Public APIs: Openly available endpoints for developers (e.g., maps, weather, social feeds).
  • Private/Internal APIs: Used within an organization to modularize services and speed development.
  • Partner APIs: Shared selectively with business partners for integrations.
  • Data & Financial APIs: Provide market data, price feeds, or on-chain metrics used by analytics and trading systems.

Typical use cases include:

  1. Integrating third-party services (payments, authentication, notifications).
  2. Feeding data into dashboards, analytics, or machine learning pipelines.
  3. Automating workflows (CI/CD, orchestration) across tools and platforms.
  4. Building AI agents that chain multiple APIs for retrieval, reasoning, and action.

In domains like crypto and AI research, APIs let developers access price histories, on-chain data, and model outputs programmatically. AI-driven research tools such as Token Metrics combine signals and historical analysis through APIs to support systematic investigation of datasets.

How to Evaluate and Use an API: Practical Checklist

When choosing or integrating an API, apply a structured evaluation to reduce technical and operational risk:

  • Documentation Quality: Clear examples, error codes, and SDKs reduce implementation time.
  • Rate Limits & Pricing: Check throughput constraints and cost model to avoid unexpected bills.
  • Data Freshness & Coverage: For time-sensitive systems, confirm update frequency and historical depth.
  • Authentication & Permissions: Prefer APIs that support token-based auth and role-restricted access.
  • SLAs & Uptime: Review availability guarantees and incident history if reliability matters.
  • Security Practices: Ensure TLS, input validation, and secure key handling are in place.

Integration steps:

  1. Sandbox: Start with a sandbox environment or test key to validate behavior safely.
  2. Schema Validation: Use contract tests to detect breaking changes early.
  3. Monitoring: Instrument calls with retries, metrics, and alerting on error rates.
  4. Governance: Rotate keys regularly and enforce least-privilege on production secrets.

Build Smarter Crypto Apps & AI Agents with Token Metrics

Token Metrics provides real-time prices, trading signals, and on-chain insights all from one powerful API. Grab a Free API Key

FAQ: Common Questions About APIs

What is the difference between an API and a web service?

An API is a broader concept describing an interface for software interaction. A web service is a specific kind of API that uses web protocols (usually HTTP) to exchange data. Not all APIs are web services (some use binary RPC), but most public APIs today are web-based.

How do I authenticate with an API?

Common methods include API keys, OAuth 2.0 flows, JWT tokens, and mutual TLS. The choice depends on security needs: OAuth is suitable for delegated access, while API keys are simple for server-to-server integrations.

What is rate limiting and why does it matter?

Rate limiting restricts the number of requests a client can make in a time window. It protects the API provider from abuse and ensures fair usage. Clients should implement exponential backoff and respect provided retry headers.

Can APIs change without notice?

APIs can evolve, which is why versioning matters. Good providers document deprecation schedules and maintain backward-compatible versions. Contract testing and version pinning help clients avoid disruptions.

How do I secure API keys and secrets?

Never hard-code secrets in client-side code. Store keys in secure vaults, use environment variables for servers, restrict keys by origin/IP, and rotate keys on a regular schedule.

What formats do APIs typically use for data?

JSON is the dominant format due to readability and language support. XML remains in some legacy systems. Binary formats like Protocol Buffers are used where performance and compact size are priorities.

How do APIs enable AI and automation?

APIs expose data and model capabilities that AI agents can call for retrieval, scoring, and orchestration. Combining data APIs with model APIs allows automated workflows that augment research and decision-support processes.

Disclaimer

This article is for informational and educational purposes only. It does not constitute professional, legal, or financial advice. Evaluate APIs and tools based on your own technical, legal, and operational requirements before integrating them into production systems.

Research

APIs Explained: A Practical Guide for Developers

Token Metrics Team
5
MIN

APIs power much of the digital world but the term can feel abstract to newcomers. Whether you are building a web app, integrating an AI model, or pulling market data for research, understanding what an API is and how to evaluate one speeds development and improves reliability. This guide breaks down core concepts, common patterns, and practical steps to choose and use APIs effectively—without assuming prior expertise.

How an API Works: The Basics

An API (Application Programming Interface) is a defined set of rules and protocols that lets one software program request services or data from another. At a high level, an API specifies:

  • Endpoints: named URLs or addresses where requests are sent.
  • Methods: actions you can perform (for web APIs, common HTTP methods are GET, POST, PUT, DELETE).
  • Parameters and payloads: the inputs required or optional for a request.
  • Responses and status codes: how the server returns data and signals success or error.

Think of an API as a waitstaff in a restaurant: you (the client) place an order (request) using a menu (API documentation), and the kitchen (server) returns a dish (response). The menu defines what is possible and how to order it.

Key API Architectures and Types

APIs come in different styles depending on design goals and constraints:

  • REST (Representational State Transfer): The most common web API pattern, using HTTP verbs and resource-oriented URLs. REST emphasizes stateless communication and cacheable responses.
  • GraphQL: A query language that allows clients to request exactly the data they need in a single request, reducing over- and under-fetching.
  • gRPC: A high-performance RPC framework using Protocol Buffers, suited for low-latency service-to-service calls.
  • Webhooks: Server-to-client callbacks that push data to a consumer when events happen, rather than requiring constant polling.
  • Library/SDK APIs: Language-specific interfaces bundled as packages that abstract network details for developers.

Each type has trade-offs: REST is simple and widely compatible, GraphQL is flexible for variable payloads, and gRPC is optimized for performance between services.

Real-World Uses: Crypto, AI, and Beyond

APIs are central to modern crypto and AI stacks. In crypto, APIs provide access to market prices, on-chain data, wallet balances, and transaction histories. In AI, APIs expose model inference endpoints, allowing applications to send prompts and receive processed outputs without hosting models locally.

When connecting these domains—such as feeding on-chain data into an AI research pipeline—developers use layered APIs: one service to fetch reliable market or chain data, another to run models or scoring logic. For example, research platforms and data providers expose standardized endpoints so teams can automate backtesting, signal generation, and analytics workflows.

For neutral examples of an analytics provider in the crypto space, see Token Metrics, which demonstrates how specialized APIs and models can structure insights for research use cases.

How to Evaluate and Use an API: Practical Checklist

Choosing and integrating an API is a mix of technical evaluation and operational planning. Use this checklist:

  1. Documentation quality: Clear, example-driven docs accelerate integration and reduce errors.
  2. Rate limits and pricing: Understand throughput limits, cost per request, and billing models to avoid surprises.
  3. Data consistency and latency: For real-time needs, measure update frequency and response times.
  4. Authentication and security: Prefer APIs that use robust auth (OAuth, API keys with scoped permissions) and TLS encryption.
  5. Error handling and retries: Check how errors are communicated and design idempotent requests or backoff strategies.
  6. SDKs and language support: Availability of client libraries can shorten development time, but inspect their maintenance status.
  7. Operational SLAs and reliability: For production systems, review uptime guarantees and incident history if available.

Applying this framework helps teams decide between alternatives (self-hosting vs managed, REST vs GraphQL) based on their latency, cost, and control needs.

Build Smarter Crypto Apps & AI Agents with Token Metrics

Token Metrics provides real-time prices, trading signals, and on-chain insights all from one powerful API. Grab a Free API Key

FAQ: Common Questions About APIs

What is the difference between an API and an SDK?

An API is a set of rules for interacting with a service, typically over a network. An SDK (Software Development Kit) is a package that may include APIs, helper libraries, and tools to make integrating those APIs easier in a specific programming language.

How do REST and GraphQL compare for client apps?

REST maps resources to endpoints and is simple to cache and reason about. GraphQL lets clients request only needed fields and combine multiple resources in one query, which can reduce round trips but may add server-side complexity.

Are public APIs safe to use for sensitive data?

Public APIs can be secure if they implement proper authentication, encryption, and access controls. Avoid sending sensitive secrets through unencrypted channels and use scoped credentials and least-privilege principles.

How do rate limits affect application design?

Rate limits cap how many requests a client can make in a time window. Design strategies include batching requests, caching responses, exponential backoff on errors, and choosing higher-tier plans if sustained throughput is required.

Can I combine multiple APIs in a single workflow?

Yes. Orchestration patterns let you fetch data from one API, transform it, and pass it to another (for example, pulling market data into an AI inference pipeline). Maintain clear error handling and data validation between steps.

How should I test an API integration?

Use sandbox or staging environments when possible, write automated tests for expected responses and error states, monitor real-world requests, and include assertions for schema and performance thresholds.

What are the typical authentication methods?

Common methods include API keys, OAuth 2.0 tokens, and mutual TLS. Select a method that balances ease of use and security for your application's context.

Disclaimer

This article is educational and informational only. It does not constitute financial, legal, or professional advice. Evaluate APIs and tools independently, review provider terms, and consider operational and security requirements before integration.

Research

APIs Explained: How They Power Modern Apps

Token Metrics Team
5
MIN

APIs (Application Programming Interfaces) are the invisible connectors that let software systems talk to each other. Whether you open a weather app, embed a payment form, or fetch crypto market data, APIs are doing the behind-the-scenes work. This guide explains what an API is, how APIs function, common types, practical use cases, and how to evaluate them securely and effectively.

What is an API?

An API is a defined set of rules and protocols that allows one software component to request services or data from another. Think of an API as a waiter in a restaurant: you (the client) request a dish, the waiter (the API) passes the order to the kitchen (the server), and then returns the prepared meal. APIs standardize interactions so developers can integrate external functionality without understanding internal implementation details.

How APIs Work: Basic Mechanics

At a technical level, most modern APIs use web protocols over HTTP/HTTPS. A client sends a request (GET, POST, PUT, DELETE) to a defined endpoint URL. The server processes the request, optionally interacts with databases or other services, and returns a response, often in JSON or XML format. Key components:

  • Endpoint: The URL where the API listens for requests.
  • Method: Defines the action (e.g., GET to read, POST to create).
  • Headers: Metadata such as authentication tokens and content type.
  • Payload: Data sent to the server (for POST/PUT).
  • Response: Data returned by the server, with status codes like 200 (OK) or 404 (Not Found).

Types of APIs You’ll Encounter

APIs come in several architectural styles and transport patterns. Understanding differences helps pick the right integration model.

  • REST APIs: Representational State Transfer is the most common style. REST uses standard HTTP methods and stateless requests, typically with JSON payloads. It’s simple and broadly supported.
  • GraphQL: A query language that lets clients request exactly the fields they need. Useful for complex data models and reducing over-fetching.
  • WebSocket APIs: Provide persistent two-way communication, enabling low-latency streaming—useful for live market feeds or chat applications.
  • gRPC: A high-performance, binary RPC framework well suited for microservices and internal communication.
  • Third-party and SDK APIs: Many platforms expose endpoints plus language-specific SDKs to simplify integration.

APIs in Crypto and AI: Practical Use Cases

In crypto and AI contexts, APIs are central to tooling and research workflows:

  • Market data: Price, volume, order book snapshots and historical candles from exchanges or aggregators via REST or WebSocket.
  • On-chain data: Blockchain explorers expose endpoints to query transactions, addresses, and contract state.
  • Trading execution: Exchanges provide authenticated endpoints to place orders and manage positions.
  • AI model inference: ML providers offer APIs to run models or pipelines without exposing underlying infrastructure.

AI-driven research platforms and analytics services can combine multiple API feeds to produce indicators, signals, or summaries. Platforms like Token Metrics illustrate how aggregated datasets and models can be exposed via APIs to power decision-support tools.

Evaluating and Using APIs: A Practical Framework

Before integrating an API, apply a simple due-diligence framework:

  1. Documentation quality: Clear, versioned docs and examples reduce integration time and prevent unexpected behavior.
  2. Latency & throughput: Measure response times and rate limits to ensure they meet your application’s needs.
  3. Data coverage & freshness: Verify supported assets, historical depth, and update frequency—especially for time-sensitive use cases.
  4. Authentication & permissions: Check available auth methods (API keys, OAuth) and least-privilege controls.
  5. Reliability & SLAs: Look for uptime guarantees, status pages, and error handling patterns.
  6. Cost model: Understand free tiers, rate-limited endpoints, and pricing for higher throughput.

Security Best Practices for API Integrations

APIs introduce attack surfaces. Adopt defensive measures:

  • Use HTTPS and verify certificates to prevent man-in-the-middle attacks.
  • Store API keys securely (environment variables, secrets managers) and rotate them periodically.
  • Implement rate limit handling and exponential backoff to avoid cascading failures.
  • Limit permissions—use API keys scoped to necessary endpoints only.
  • Monitor logs and set alerts for unusual patterns like spikes in failed requests.

Build Smarter Crypto Apps & AI Agents with Token Metrics

Token Metrics provides real-time prices, trading signals, and on-chain insights all from one powerful API. Grab a Free API Key

FAQ: What is an API?

Q: What is the simplest way to describe an API?
A: An API is an interface that defines how software components communicate—standardized requests and responses that let systems share data and functionality.

FAQ: How do API types differ?

Q: When should I use REST vs WebSocket or GraphQL?
A: REST is suitable for standard CRUD operations. WebSocket is appropriate for real-time bidirectional needs like live feeds. GraphQL is useful when clients need flexible queries to minimize data transfer.

FAQ: Are APIs secure to use?

Q: What are common API security concerns?
A: Major concerns include credential leakage, insufficient authorization, unencrypted transport, and abuse due to inadequate rate limiting. Following best practices reduces these risks.

FAQ: Can I build production apps with free APIs?

Q: Are free APIs viable for production?
A: Free tiers can be useful for prototypes and low-traffic apps, but evaluate limits, reliability, and support before relying on them for critical production workloads.

FAQ: How to choose the best API for my project?

Q: What factors matter most when selecting an API?
A: Prioritize data relevance, latency, reliability, documentation quality, security controls, and cost. Prototype early to validate assumptions about performance and coverage.

Disclaimer

This article is educational and informational only. It does not provide financial, legal, or investment advice. Evaluate tools and services independently and consult professionals where appropriate.

Thank you! Your submission has been received!
Oops! Something went wrong while submitting the form.

Crypto Basics Blog

Research Blogs

Announcement Blogs

Unlock the Secrets of Cryptocurrency

Sign Up for the Newsletter for the Exclusive Updates