


.png)


.png)
.png)


.png)


.png)
%201%20(1).png)

.png)


.png)


.png)
.png)


.png)


.png)

.png)
.png)
.png)
.png)
.png)
.png)
.png)
.png)
.png)


.png)


.png)

.png)
.png)


.png)


.png)
.png)
.png)
.png)

.png)
.png)


Research
Top Crypto Trading Platforms in 2025
When it comes to crypto trading platforms, Token Metrics is not an exchange, but a crypto analytics and crypto trading intelligence platform powered by AI.
Token Metrics Team
10 min


%201.svg)
%201.svg)
Big news: We’re cranking up the heat on AI-driven crypto analytics with the launch of the Token Metrics API and our official SDK (Software Development Kit). This isn’t just an upgrade – it's a quantum leap, giving traders, hedge funds, developers, and institutions direct access to cutting-edge market intelligence, trading signals, and predictive analytics.
Crypto markets move fast, and having real-time, AI-powered insights can be the difference between catching the next big trend or getting left behind. Until now, traders and quants have been wrestling with scattered data, delayed reporting, and a lack of truly predictive analytics. Not anymore.
The Token Metrics API delivers 32+ high-performance endpoints packed with powerful AI-driven insights right into your lap, including:
Getting started with the Token Metrics API is simple:
At Token Metrics, we believe data should be decentralized, predictive, and actionable.
The Token Metrics API & SDK bring next-gen AI-powered crypto intelligence to anyone looking to trade smarter, build better, and stay ahead of the curve. With our official SDK, developers can plug these insights into their own trading bots, dashboards, and research tools – no need to reinvent the wheel.
Opening Hook
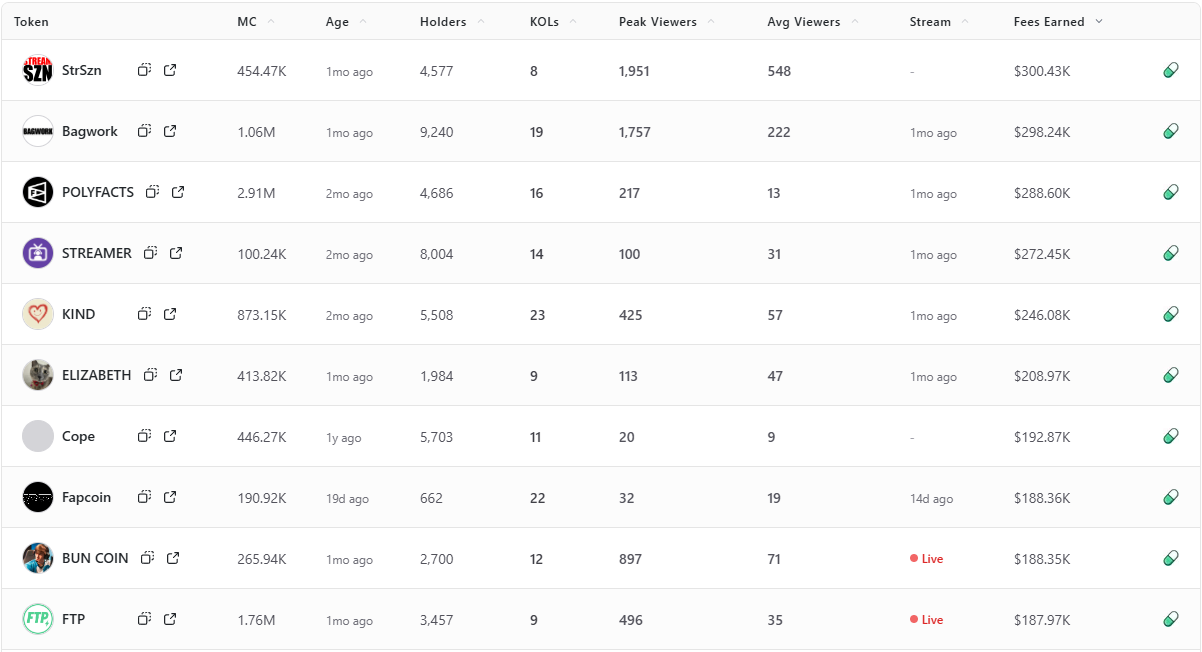
Fees Earned is a clean way to see which livestream tokens convert attention into on-chain activity. This leaderboard ranks the top 10 Pump.fun livestream tokens by Fees Earned using the screenshot you provided.
Selection rule is simple, top 10 by Fees Earned from the screenshot, numbers appear exactly as shown. If a field is not in the image, it is recorded as —.
Entity coverage: project names and tickers are taken as listed on Pump.fun, chain is Solana, sector is livestream meme tokens and creator tokens.
Token Metrics Live (TMLIVE) brings real time, data driven crypto market analysis to Pump.fun. The team has produced live crypto content for 7 years with a 500K plus audience and a platform of more than 100,000 users. Our public track record includes early coverage of winners like MATIC and Helium in 2018.
TMLIVE Quick Stats, as captured
TLDR: Fees Earned Leaders at a Glance
Short distribution note: the top three sit within a narrow band of each other, while mid-table tokens show a mix of older communities and recent streams. Several names with modest average viewers still appear due to concentrated activity during peaks.
StrSzn
Positioning: Active community meme with consistent viewer base.
Research Blurb: Project details unclear at time of writing. Fees and viewership suggest consistent stream engagement over the last month.
Quick Facts: Chain = Solana, Status = —, Peak Viewers = 1,951, Avg Viewers = 548.
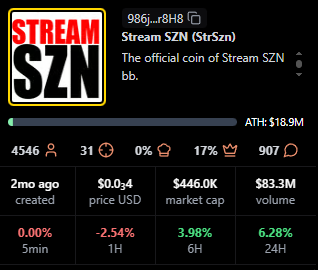
https://pump.fun/coin/986j8mhmidrcbx3wf1XJxsQFvWBMXg7gnDi3mejsr8H8
Bagwork
Positioning: Large holder base with sustained attention.
Research Blurb: Project details unclear at time of writing. Strong holders and KOL presence supported steady audience numbers.
Quick Facts: Chain = Solana, Status = 1mo ago, Holders = 9,192, KOLs = 19.

https://pump.fun/coin/7Pnqg1S6MYrL6AP1ZXcToTHfdBbTB77ze6Y33qBBpump
POLYFACTS
Positioning: Higher market cap with light average viewership.
Research Blurb: Project details unclear at time of writing. High market cap with comparatively low average viewers implies fees concentrated in shorter windows.
Quick Facts: Chain = Solana, Status = 1mo ago, MC = 3.15M, Avg Viewers = 13.
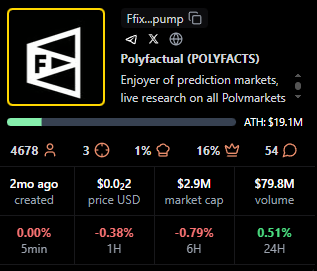
https://pump.fun/coin/FfixAeHevSKBZWoXPTbLk4U4X9piqvzGKvQaFo3cpump
STREAMER
Positioning: Community focused around streaming identity.
Research Blurb: Project details unclear at time of writing. Solid holders and moderate KOL count, steady averages over time.
Quick Facts: Chain = Solana, Status = 1mo ago, Holders = 8,008, KOLs = 14.

https://pump.fun/coin/3arUrpH3nzaRJbbpVgY42dcqSq9A5BFgUxKozZ4npump
KIND
Positioning: Heaviest KOL footprint in the top 10.
Research Blurb: Project details unclear at time of writing. The largest KOL count here aligns with above average view metrics and meaningful fees.
Quick Facts: Chain = Solana, Status = 29d ago, KOLs = 23, Avg Viewers = 57.

https://pump.fun/coin/V5cCiSixPLAiEDX2zZquT5VuLm4prr5t35PWmjNpump
ELIZABETH
Positioning: Mid-cap meme with consistent streams.
Research Blurb: Project details unclear at time of writing. Viewer averages and recency indicate steady presence rather than single spike behavior.
Quick Facts: Chain = Solana, Status = 1mo ago, Avg Viewers = 47, Peak Viewers = 113.
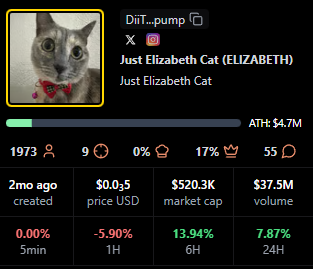
https://pump.fun/coin/DiiTPZdpd9t3XorHiuZUu4E1FoSaQ7uGN4q9YkQupump
Cope
Positioning: Older token with a legacy community.
Research Blurb: Project details unclear at time of writing. Despite low recent averages, it holds a sizable base and meaningful fees.
Quick Facts: Chain = Solana, Status = —, Age = 1y ago, Avg Viewers = 9.
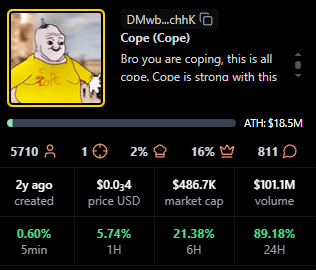
https://pump.fun/coin/DMwbVy48dWVKGe9z1pcVnwF3HLMLrqWdDLfbvx8RchhK
BUN COIN
Positioning: Currently live, strong peaks relative to size.
Research Blurb: Project details unclear at time of writing. Live streaming status often coincides with bursts of activity that lift fees quickly.
Quick Facts: Chain = Solana, Status = Live, Peak Viewers = 897, Avg Viewers = 71.
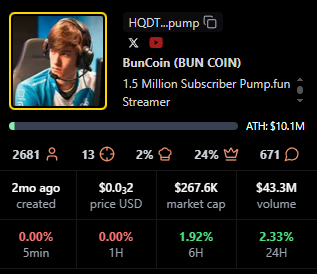
https://pump.fun/coin/HQDTzNa4nQVetoG6aCbSLX9kcH7tSv2j2sTV67Etpump
Fapcoin
Positioning: Newer token with targeted pushes.
Research Blurb: Project details unclear at time of writing. Recent age and meaningful KOL support suggest orchestrated activations that can move fees.
Quick Facts: Chain = Solana, Status = 13d ago, Age = 18d ago, KOLs = 22.

https://pump.fun/coin/8vGr1eX9vfpootWiUPYa5kYoGx9bTuRy2Xc4dNMrpump
FTP
Positioning: Live status with solid mid-table view metrics.
Research Blurb: Project details unclear at time of writing. Peaks and consistent averages suggest an active audience during live windows.
Quick Facts: Chain = Solana, Status = Live, Peak Viewers = 496, Avg Viewers = 35.

https://pump.fun/coin/J2eaKn35rp82T6RFEsNK9CLRHEKV9BLXjedFM3q6pump
Signals From Fees Earned: Patterns to Watch
Fees Earned often rise with peak and average viewers, but timing matters. Several tokens here show concentrated peaks with modest averages, which implies that well timed announcements or coordinated segments can still produce high fees.
Age is not a blocker for this board. Newer tokens like Fapcoin appear due to focused activity, while older names such as Cope persist by mobilizing established holders. KOL count appears additive rather than decisive, with KIND standing out as the KOL leader.
For creators, Fees Earned reflects whether livestream moments translate into on-chain action. Design streams around clear calls to action, align announcements with segments that drive peaks, then sustain momentum with repeatable formats that stabilize averages.
For traders, Fees Earned complements market cap, viewers, and age. Look for projects that combine rising averages with consistent peaks, because those patterns suggest repeatable engagement rather than single event spikes.
TV Live is a fast way to follow real-time crypto market news, creator launches, and token breakdowns as they happen. You get context on stream dynamics, audience behavior, and on-chain activity while the story evolves.
CTA: Watch TV Live for real-time crypto market news →TV Live Link
CTA: Follow and enable alerts → TV Live
Token Metrics is trusted for transparent data, crypto analytics, on-chain ratings, and investor education. Our platform offers cutting-edge signals and market research to empower your crypto investing decisions.
What is the best way to track Pump.fun livestream leaders?
Tracking Pump.fun livestream leaders starts with the scanner views that show Fees Earned, viewers, and KOLs side by side, paired with live coverage so you see data and narrative shifts together.
Do higher fees predict higher market cap or sustained viewership?
Higher Fees Earned does not guarantee higher market cap or sustained viewership, it indicates conversion in specific windows, while longer term outcomes still depend on execution and community engagement.
How often do these rankings change?
Rankings can change quickly during active cycles, the entries shown here reflect the exact time of the screenshot.
Next Steps
Disclosure
This article is educational content. Cryptocurrency involves risk. Always do your own research.
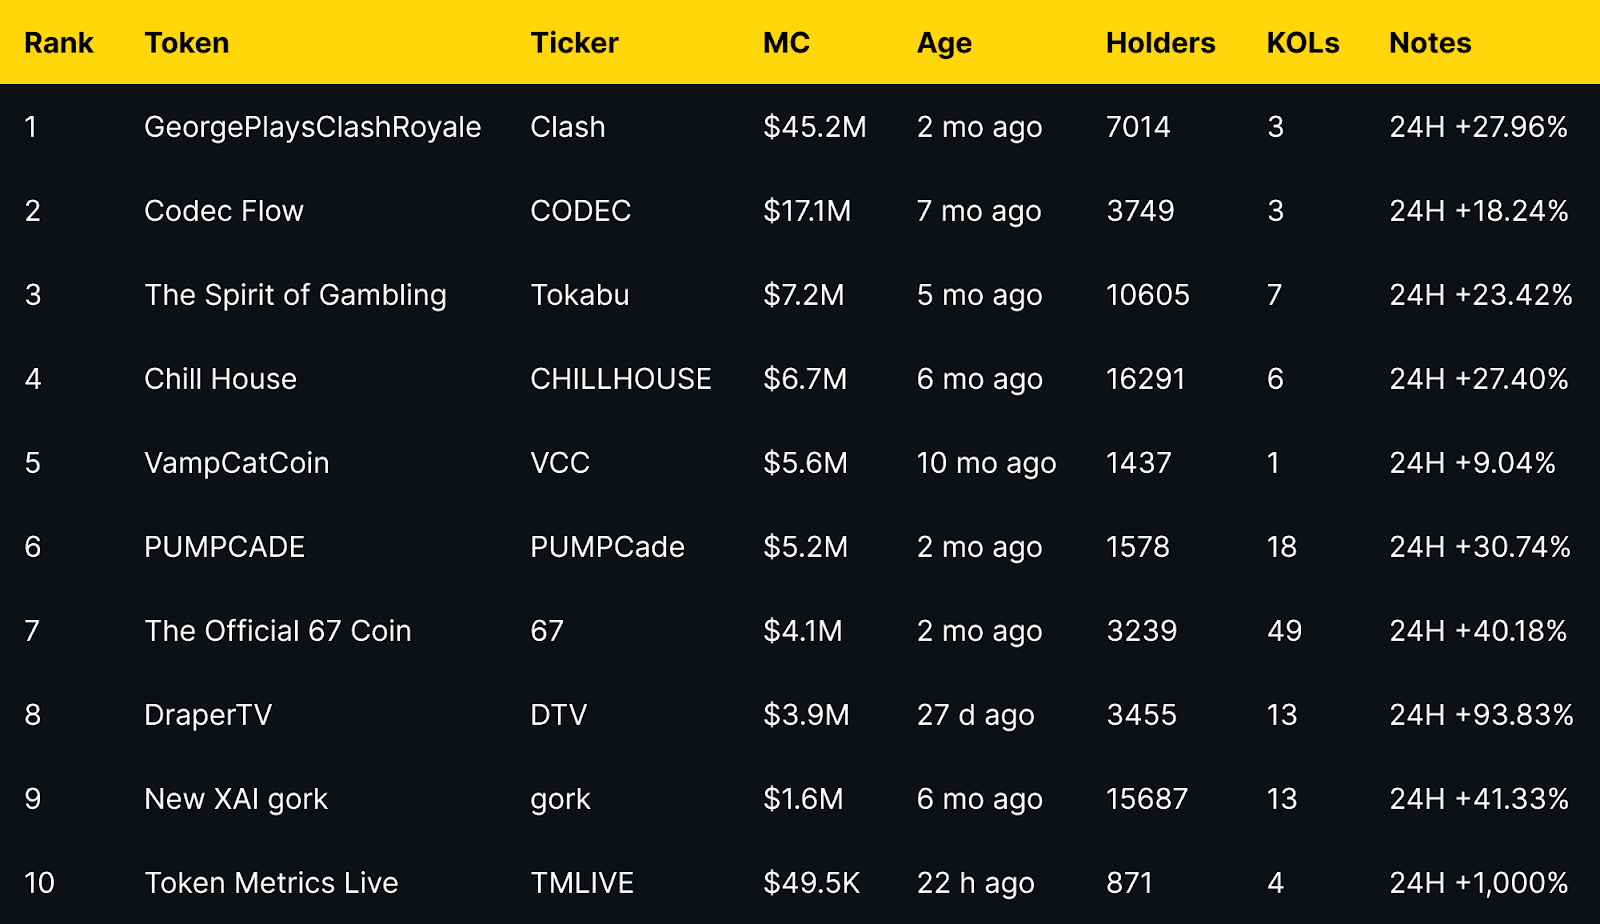
New XAI gork leads with 15,687 holders, followed by Chill House at 16,291 and The Spirit of Gambling (Tokabu) at 10,605. Token Metrics Live (TMLIVE) entered the space on November 4 with 876 holders in its first 22 hours, backed by 7 years of live crypto content experience and a 500K+ audience. GeorgePlaysClashRoyale maintains strong position with 7,014 holders despite lower ranking by this metric. Distribution varies widely, with some projects showing concentrated holder bases and others demonstrating broader community adoption.
For readers tracking pump.fun, recent pump.fun news around each pump.fun token and pump.fun price moves provides context, and this leaderboard explains what is pump.fun in practice through live data.
Token Metrics Live (TMLIVE) is the primary focus of this series. On day one, the stream drove $1.7M 24h volume and an ATH market cap of $291.7K, with ~876 holders captured in the first 22 hours.
TMLIVE brings research-first programming to a meme-heavy category, translating seven years of consistent live coverage and a 500K+ audience into rapid early adoption on Pump.fun.
Holder Count Rankings for Pump.fun Livestream Tokens
Holder count measures how widely a token is distributed across a community. Unlike market cap, which shows total valuation, or volume, which tracks trading activity, holder count reveals how many unique wallets have acquired the token.
For livestream tokens on Pump.fun, holder count provides insight into community breadth and potential staying power. Projects with more holders tend to have wider support networks and more diverse participation during streams.
This ranking selects the top 10 Pump.fun tokens by holder count from the provided data. Numbers, tickers, and dates are kept exactly as shown, and any missing data points are marked with a dash.
https://pump.fun/coin/8Dxpc8Q8jg7TK8TT1pVntcqunHGofqpetCaP5fEhpump
https://pump.fun/coin/8Dxpc8Q8jg7TK8TT1pVntcqunHGofqpetCaP5fEhpump
https://pump.fun/coin/8Dxpc8Q8jg7TK8TT1pVntcqunHGofqpetCaP5fEhpump
Methodology and Secondary Signals
Holder count alone does not guarantee project success. We also track market cap, engagement rate, and seven-day retention as complementary signals of durability and community health.
When high holder counts pair with strong engagement and retention, Pump.fun projects tend to sustain momentum longer. Projects with concentrated holder bases may show different trading dynamics than those with broad distribution.
Methodology note: where available, we reference pump.fun api endpoints and pump.fun api documentation (including pump.fun api docs) to corroborate holder snapshots, and we map each token to its pump.fun program id (also called pump.fun solana program id or pump.fun program id solana) for consistent tracking across Solana explorers. We consider transactions, tvl, and pump.fun fees as secondary health checks, and we note any bonding assumptions using the pump.fun bonding curve formula, basic pump.fun tokenomics, and typical pump.fun token bonding time where publicly visible.
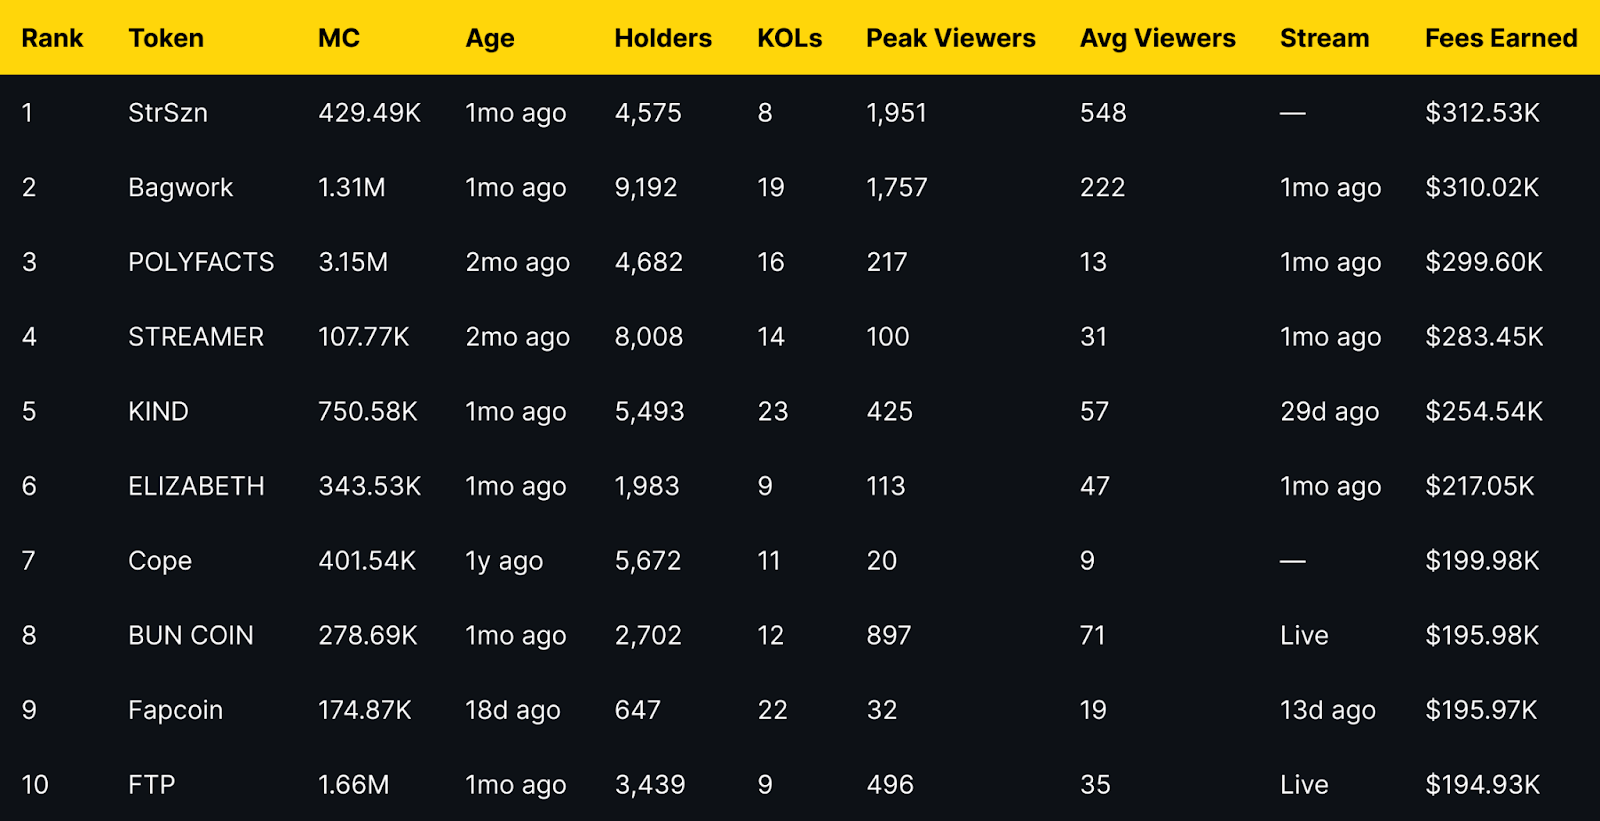
Rank
Token Ticker Holders MC Age KOLs Notes
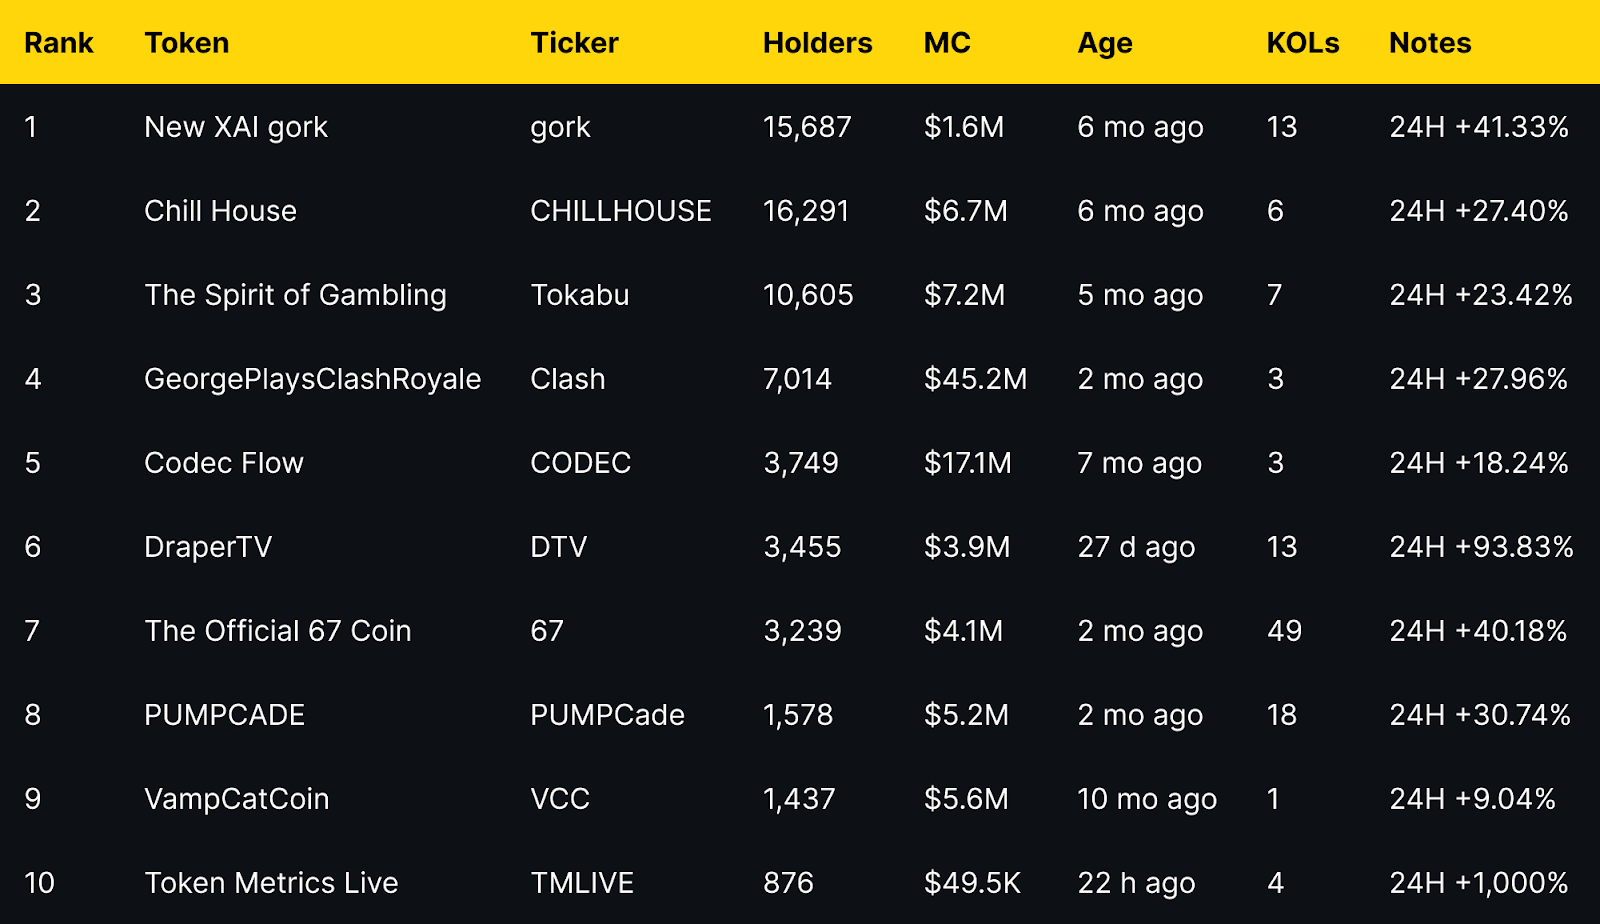
Data source: stalkchain.com/streams/scanner, captured Nov 4-5, 2024
The distribution shows clear patterns
Top holders include established projects aged 5-10 months with organic growth curves. Mid-tier projects in the 1,400-7,000 holder range show varying market caps, suggesting different holder-to-valuation ratios. TMLIVE's 876 holders in 22 hours represents rapid initial adoption, supported by an existing audience of 500K+ built over 7 years of consistent crypto livestreaming.
Several projects show strong 24H moves alongside holder growth, indicating active communities responding to stream-driven engagement rather than passive speculation. Leaderboard commentary often highlights pump.fun trending tokens, pump.fun trending tokens 24h gain holders volume, and pump.fun trending coins as new solana tokens appear. You may also see pump.fun new solana tokens, pump.fun solana new tokens, pump.fun new tokens, and pump.fun new token launches within the last hour via trackers that surface pump.fun new solana tokens last hour for discovery.
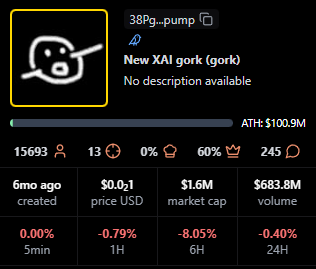
New XAI gork (gork): Minimal Meme
No description available. Project details unclear at time of writing.
Quick facts: chain = Solana, status = live, milestone = ATH $100.9M shown
Context for readers: as a pump.fun coin within pump.fun crypto on Solana, gork appears on-stream and then graduates to a Raydium listing when liquidity thresholds are met, similar to peers.
https://pump.fun/coin/38PgzpJYu2HkiYvV8qePFakB8tuobPdGm2FFEn7Dpump
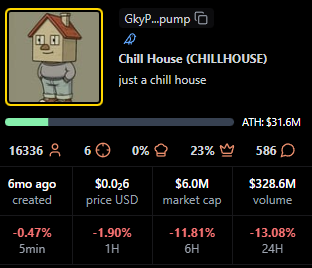
Chill House (CHILLHOUSE): Community Meme with Cozy Theme
"Just a chill house." The Chill House theme suggests community vibes and frequent participation during Pump.fun streams. Strong holder distribution at 16,291 wallets indicates broad community adoption.
Quick facts: chain = Solana, status = live, milestone = ATH $31.6M shown
Readers often watch for pump.fun current price snapshots during streams and how a Raydium listing can influence liquidity depth.
https://pump.fun/coin/GkyPYa7NnCFbduLknCfBfP7p8564X1VZhwZYJ6CZpump
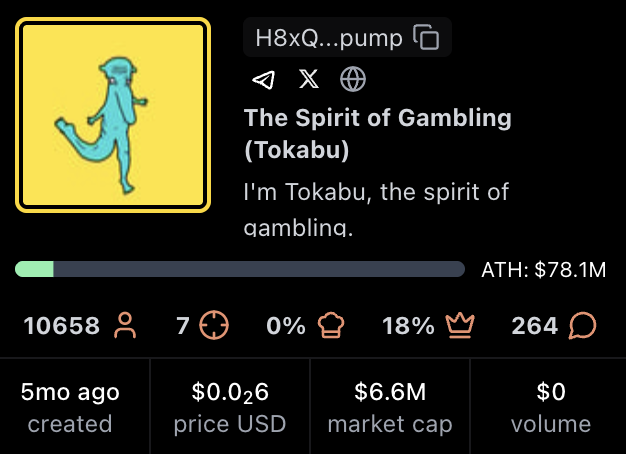
The Spirit of Gambling (Tokabu): Meme Character with Gambling Motif
"I am Tokabu, the spirit of gambling." The Tokabu project leans into a playful narrative and steady Pump.fun live presence. 10,605 holders demonstrate sustained community participation.
Quick facts: chain = Solana, status = live, milestone = ATH $78.1M shown
As a Solana-native project, Tokabu is part of pump.fun solana coverage and is commonly tracked for holder growth after a Raydium listing.
https://pump.fun/coin/H8xQ6poBjB9DTPMDTKWzWPrnxu4bDEhybxiouF8Ppump
GeorgePlaysClashRoyale (Clash): Creator Gaming Stream
Watch George play the game Clash Royale on Pump.fun livestreams. Community interest is driven by creator-led live content and regular gameplay moments that translate to token engagement. 7,014 holders support a $45.2M market cap, showing concentrated high-value participation.
Quick facts: chain = Solana, status = live, milestone = ATH $87.9M shown
This token is also referenced in searches for pump.fun pump token market cap when viewers compare creator-led launches.

https://pump.fun/coin/6nR8wBnfsmXfcdDr1hovJKjvFQxNSidN6XFyfAFZpump
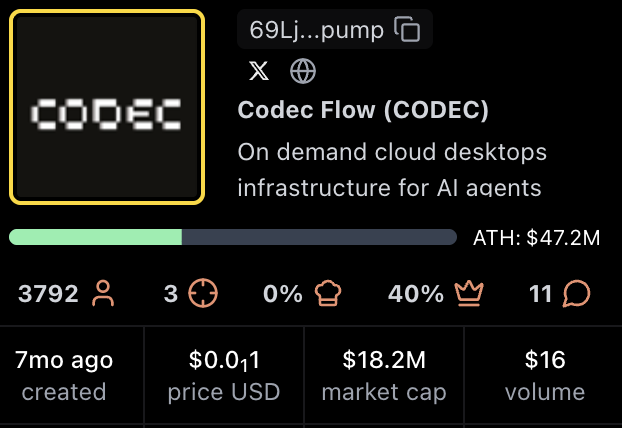
Codec Flow (CODEC): Infrastructure for AI Agents
On-demand cloud desktops infrastructure for AI agents. The Codec Flow narrative centers on AI tooling and always-on compute for agents using streamed engagement.
Quick facts: chain = Solana, status = live, milestone = ATH $47.2M shown
Some viewers check the pump.fun website to confirm contract pages and observe pump.fun current price movement during streams.
https://pump.fun/coin/69LjZUUzxj3Cb3Fxeo1X4QpYEQTboApkhXTysPpbpump
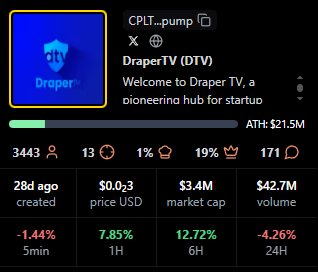
DraperTV (DTV): Media and Community Token
"Welcome to Draper TV, a pioneering hub for startup innovation." The DraperTV token sits at the intersection of media, startups, and community engagement during Pump.fun streams. 3,455 holders in 27 days indicates strong early momentum.
Quick facts: chain = Solana, status = live, milestone = ATH $21.5M shown
Audience interest often focuses on pump.fun revenue and future programming cadence.
https://pump.fun/coin/CPLTbYbtDMKZtHBaPqdDmHjxNwESCEB14gm6VuoDpump
The Official 67 Coin (67): Creator and Fan Coin
The 67 Coin meme centers on a creator identity and fan-driven momentum on Pump.fun. 3,239 holders with 49 KOL mentions suggest coordinated community building.
Quick facts: chain = Solana, status = live, milestone = ATH $8.0M shown
Holders monitor pump.fun website pages and Raydium listing status as liquidity scales.
https://pump.fun/coin/9AvytnUKsLxPxFHFqS6VLxaxt5p6BhYNr53SD2Chpump
PUMPCADE (PUMPCade): Arcade Mini Games Inside Live Chat
"Play arcade games with others in a Pump.fun live chat and win." The hook is interactive gameplay blended with streaming. 1,578 holders participate in the gaming-focused community.
Quick facts: chain = Solana, status = live, milestone = ATH $9.3M shown
Viewers compare pump.fun pump token market cap and utility mentions during mini-game sessions.

https://pump.fun/coin/Eg2ymQ2aQqjMcibnmTt8erC6Tvk9PVpJZCxvVPJz2agu
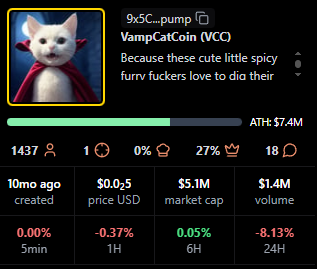
VampCatCoin (VCC): Cute Vampire Cat Meme
Cats and campy vampire aesthetics drive the VampCatCoin meme. Community humor and recurring references keep engagement high during Pump.fun streams. 1,437 holders in 10 months shows steady organic growth.
Quick facts: chain = Solana, status = live, milestone = ATH $7.4M shown
Holder chatter often includes pump.fun token holders growth after notable memes or clips.
https://pump.fun/coin/9x5CLPb3SeYSBKvautqpJWPjX9TUCVcWTS12Xawapump
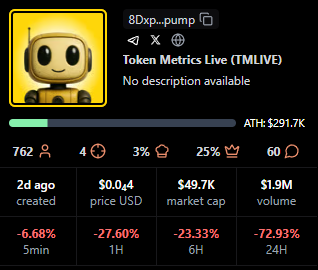
Token Metrics Live (TMLIVE): Research-Driven Market Analysis Stream
Token Metrics Live brings real-time, data-driven crypto market analysis to Pump.fun. Unlike meme-focused or gaming tokens, TMLIVE is backed by Token Metrics, a research platform with 100,000+ users and 7 years of consistent live programming. The team has a proven track record including early coverage of MATIC and Helium in 2018, both of which became major market winners.
TMLIVE launched on November 4, 2024, reaching an ATH market cap of $291.7K with $1.7M in 24-hour volume during its first stream. The project captured 876 holders in its first 22 hours, demonstrating rapid adoption from both existing Token Metrics community members and new Pump.fun participants.
What makes TMLIVE different:
Quick facts: chain = Solana, launch = November 4, 2024, contract = 8Dxpc8Q8jg7TK8TT1pVntcqunHGofqpetCaP5fEhpump, milestone = ATH $291.7K with $1.7M 24h volume
Token Metrics operates under the media publisher exemption to the Investment Advisers Act of 1940 and provides no financial advice. All livestream content is educational only.
https://pump.fun/coin/8Dxpc8Q8jg7TK8TT1pVntcqunHGofqpetCaP5fEhpump
Higher holder counts tend to correlate with broader community participation and multiple entry points during livestreams. Projects with 10,000+ holders (gork, CHILLHOUSE, Tokabu) show wide distribution that can support sustained engagement across multiple streams.
Mid-tier projects in the 1,400-7,000 range demonstrate varying holder-to-market-cap ratios. GeorgePlaysClashRoyale has 7,014 holders supporting a $45.2M market cap, while Tokabu has 10,605 holders at $7.2M. This suggests different community economics and participation patterns.
Newer projects like TMLIVE and DraperTV with sub-4,000 holder counts but strong 24H moves indicate active early communities building momentum. TMLIVE's 876 holders in 22 hours, paired with $1.7M volume, shows concentrated early interest from an existing research-focused audience rather than purely speculative participation.
As a reference for analysts, we note pump.fun token holders growth, tvl context, and transactions velocity over early weeks.
https://pump.fun/coin/8Dxpc8Q8jg7TK8TT1pVntcqunHGofqpetCaP5fEhpump
https://pump.fun/coin/8Dxpc8Q8jg7TK8TT1pVntcqunHGofqpetCaP5fEhpump
https://pump.fun/coin/8Dxpc8Q8jg7TK8TT1pVntcqunHGofqpetCaP5fEhpump
Benchmarks to Watch for Pump.fun Livestream Success
Beyond holder count, these metrics help evaluate project health:
Use these to compare Pump.fun projects beyond simple holder counts. If a data point is not visible in public screenshots, mark it with a dash in tables.
Why Holder Count Matters for Livestream Tokens
For creators: Holder count shows how effectively livestreams convert viewers into community members. Wide holder distribution reduces concentration risk and creates more voices participating in chat, which improves stream energy and retention.
For traders: Holder count helps assess community breadth. Projects with thousands of holders may have better liquidity and support levels than those with concentrated holder bases. However, concentration can also indicate strong conviction from early participants.
Distribution patterns: Projects that gain holders gradually over months (like Chill House or Tokabu) show different dynamics than rapid-growth tokens (like TMLIVE or DraperTV). Both patterns can succeed, but they require different community management approaches.
https://pump.fun/coin/8Dxpc8Q8jg7TK8TT1pVntcqunHGofqpetCaP5fEhpump
https://pump.fun/coin/8Dxpc8Q8jg7TK8TT1pVntcqunHGofqpetCaP5fEhpump
https://pump.fun/coin/8Dxpc8Q8jg7TK8TT1pVntcqunHGofqpetCaP5fEhpump
Creator Playbook: Convert Viewers to Holders
Additional Signals to Watch for Pump.fun Token Success
Structured segments and interactive formats increase average watch time and chat velocity, which correlate with healthier communities after launch. Projects that rely on hype alone tend to see faster holder churn after initial excitement fades.
Clear expectations and transparent messaging improve seven-day retention compared with hype-only streams. TMLIVE's research-driven approach sets expectations for ongoing value rather than quick speculation.
Multi-channel amplification across X, Telegram, Discord, and email consistently lifts day-one reach and discovery for Pump.fun tokens. Projects with 6+ KOL mentions tend to show faster early holder growth.
Creators can design Pump.fun launches around consistent live segments and clear narratives. The leaders in this ranking demonstrate how personality, interactivity, or utility themes can drive holder growth beyond a single hype window. TMLIVE shows that substance-driven content can compete effectively in a meme-heavy environment.
Traders can use holder count to quickly assess community breadth, then layer in market cap, average viewers, and fees to judge staying power and crowd quality. Wide holder distribution suggests better liquidity and community resilience.
What non-holder signals matter most for Pump.fun token durability?
Engagement rate (measured as messages per viewer per hour), average watch time, follower conversion from viewers, and seven-day retention matter most for Pump.fun token durability. These show whether attention sticks once the stream ends. We also reference pump.fun token price views, pump.fun pump price checks, and pump.fun pump current price context in dashboards.
What is the best way to track Pump.fun livestream leaders by holder count?
Use stalkchain.com/streams/scanner or Pump.fun token pages to view current holder rankings. For historical context, save periodic screenshots to compare changes over time. On Solana, the pump.fun program id helps map tokens to explorers, and the pump.fun logo on the pump.fun website makes official pages easy to verify.
Does higher holder count predict higher future returns for Pump.fun tokens?
Higher holder count does not necessarily predict higher future returns. Holder count reflects current distribution, not forward performance. Combine it with viewers, fees, market cap, holder growth rate, and neutral screens like pump.fun price prediction models for additional context.
How often do Pump.fun token holder rankings change?
Pump.fun token holder rankings change continuously as new wallets acquire tokens. This post reflects the timestamp of the provided screenshots captured on Nov 4-5, 2024. For creation topics, people ask how does pump.fun work, how to make a coin on pump.fun, how to create a coin on pump.fun, or simply how to create a coin on pump.fun with a pump.fun create coin flow. We also see searches on pump.fun airdrop, pump.fun bot, pump.fun token pump price, and is pump.fun legit. One trending-search note often bundled into a single clause: teen pump.fun 250m, teen 50k, and khaliliwired show up as viral queries, not signals of quality.
Next Steps for Tracking Pump.fun Tokens
About Token Metrics Live (TMLIVE)
Token Metrics Live is a research-driven crypto livestream on Pump.fun from the team behind Token Metrics, a platform with 100,000+ users and a 500K+ audience across channels. We have produced live crypto content for 7 years, known for early coverage of major winners like MATIC and Helium in 2018. Follow TMLIVE on Pump.fun and join our next stream for real-time analysis and community Q&A.
Trade and watch TMLIVE: Contract address 8Dxpc8Q8jg7TK8TT1pVntcqunHGofqpetCaP5fEhpump on Solana
Disclaimer
Disclaimer: Token Metrics operates as a media publisher. Nothing in this article or our livestreams constitutes financial, investment, or trading advice. Digital assets carry risk, including the potential loss of principal. Do your own research and consult a professional where appropriate.
Data captured: November 4-5, 2024, from stalkchain.com/streams/scanner and Pump.fun token pages. Stats may change over time.
Market Cap Rankings for Pump.fun Livestream Tokens
Market Cap represents the circulating valuation of a token. For livestream tokens on Pump.fun, market cap provides a fast way to compare where capital has concentrated, and which communities have built sustained traction. This post references pump.fun crypto context where relevant.
This ranking selects the top 10 Pump.fun tokens by Market Cap from the provided screenshots. Numbers, tickers, and dates are kept exactly as shown, and any missing datapoints are marked with a dash.
Methodology and Secondary Signals
Market cap is a snapshot of attention and liquidity at a point in time. We also track engagement rate and seven-day retention as complementary signals of durability.
When market cap pairs with strong engagement and retention, Pump.fun projects tend to sustain momentum longer. For discovery, some readers follow pump.fun trending tokens and pump.fun new token launches to compare momentum.
While most Pump.fun livestream tokens center on memes, gaming, or creator personalities, Token Metrics Live (TMLIVE) brings a different approach, research-driven market analysis backed by 7 years of consistent crypto content and a 500K+ audience.
TMLIVE launched on Pump.fun on November 4, 2024, capturing 876 holders in its first 22 hours. The token reached an ATH market cap of $291.7K with $1.7M in 24-hour volume, demonstrating strong initial adoption from both the existing Token Metrics community of 100,000+ platform users and new Pump.fun participants.
The team behind TMLIVE has a proven track record in identifying market opportunities early, including coverage of MATIC and Helium in 2018, both became significant market winners. This credibility factor differentiates TMLIVE from hype-driven tokens, positioning it as a substance-over-speculation play in the Pump.fun livestream space.
This blog ranks the top 10 Pump.fun livestream tokens by holder count, examining how community distribution patterns reveal different engagement strategies and durability signals across the ecosystem.
Leaderboard: Pump.fun Tokens by Market Cap
Note, data is taken from screenshots at the time of capture. Reference signals like pump.fun trending tokens 24h gain holders volume for additional context.
Benchmarks to Watch for Pump.fun Livestream Success
Use these to compare Pump.fun projects beyond market cap. If a data point is not visible in public screenshots, mark it with a dash in the table.
The distribution shows a clear long tail. One mega cap leader, one strong upper mid cap, then a cluster between $3.9M and $7.2M. Several mid caps display notable 24H moves, suggesting active communities and recent stream driven interest.
GeorgePlaysClashRoyale (Clash): Creator Gaming Stream
Watch George play the game Clash Royale on Pump.fun livestreams. Community interest is driven by creator led live content and regular gameplay moments that translate to token engagement. As a pump.fun coin on Solana, the appeal is creator first.
Quick facts: chain = Solana, status = live, milestone = ATH $87.9M shown
https://pump.fun/coin/6nR8wBnfsmXfcdDr1hovJKjvFQxNSidN6XFyfAFZpump
Codec Flow (CODEC): Infrastructure for AI Agents
On demand cloud desktops infrastructure for AI agents. The Codec Flow narrative centers on AI tooling and always on compute for agents using streamed engagement.
Quick facts: chain = Solana, status = live, milestone = ATH $47.2M shown
https://pump.fun/coin/69LjZUUzxj3Cb3Fxeo1X4QpYEQTboApkhXTysPpbpump
The Spirit of Gambling (Tokabu): Meme Character with Gambling Motif
"I am Tokabu, the spirit of gambling." The Tokabu project leans into a playful narrative and steady Pump.fun live presence.
Quick facts: chain = Solana, status = live, milestone = ATH $78.1M shown
https://pump.fun/coin/H8xQ6poBjB9DTPMDTKWzWPrnxu4bDEhybxiouF8Ppump
Chill House (CHILLHOUSE): Community Meme with Cozy Theme
"Just a chill house." The Chill House theme suggests community vibes and frequent participation during Pump.fun streams.
Quick facts: chain = Solana, status = live, milestone = ATH $31.6M shown
https://pump.fun/coin/GkyPYa7NnCFbduLknCfBfP7p8564X1VZhwZYJ6CZpump
VampCatCoin (VCC): Cute Vampire Cat Meme
Cats and campy vampire aesthetics drive the VampCatCoin meme. Community humor and recurring references keep engagement high during Pump.fun streams.
Quick facts: chain = Solana, status = live, milestone = ATH $7.4M shown
https://pump.fun/coin/9x5CLPb3SeYSBKvautqpJWPjX9TUCVcWTS12Xawapump
PUMPCADE (PUMPCade): Arcade Mini Games Inside Live Chat
"Play arcade games with others in a Pump.fun live chat and win." The hook is interactive gameplay blended with streaming.
Quick facts: chain = Solana, status = live, milestone = ATH $9.3M shown
https://pump.fun/coin/Eg2ymQ2aQqjMcibnmTt8erC6Tvk9PVpJZCxvVPJz2agu
The Official 67 Coin (67): Creator and Fan Coin
The 67 Coin meme centers on a creator identity and fan-driven momentum on Pump.fun.
Quick facts: chain = Solana, status = live, milestone = ATH $8.0M shown
https://pump.fun/coin/9AvytnUKsLxPxFHFqS6VLxaxt5p6BhYNr53SD2Chpump
DraperTV (DTV): Media and Community Token
"Welcome to Draper TV, a pioneering hub for startup innovation." The DraperTV token sits at the intersection of media, startups, and community engagement during Pump.fun streams.
Quick facts: chain = Solana, status = live, milestone = ATH $21.5M shown
https://pump.fun/coin/CPLTbYbtDMKZtHBaPqdDmHjxNwESCEB14gm6VuoDpump
New XAI gork (gork): Minimal Meme
No description available. Project details unclear at time of writing.
Quick facts: chain = Solana, status = live, milestone = ATH $100.9M shown
https://pump.fun/coin/38PgzpJYu2HkiYvV8qePFakB8tuobPdGm2FFEn7Dpump
Token Metrics Live (TMLIVE): Media and Live Coverage Token
Token Metrics Live: real-time, data-driven crypto analysis with token breakdowns and live Q&A. 7 years streaming, 500K+ audience. We turn on-chain signals into strategy, actionable insights, smart tools, and a learning community.. TMLIVE powers Token Metrics live coverage and community streams on Pump.fun.
Authority and substance tend to win on Pump.fun. Consistent analyst-led segments, live screening, and real Q and A-drive engagement that lasts beyond a single meme spike.
Quick facts: chain = Solana, status = Created 22 h ago, milestone = ATH $291.7K shown
https://pump.fun/coin/8Dxpc8Q8jg7TK8TT1pVntcqunHGofqpetCaP5fEhpump
Additional Signals to Watch for Pump.fun Token Success
Creator Playbook: Turn Market Cap into Staying Power
Watch Real Time Coverage on TV Live
Use Token Metrics discovery tools, AI-powered data, and deep analyst research to compare Pump.fun tokens beyond price momentum. Tap into livestreamed daily crypto market intelligence, on-chain signals, and automated alerts to stay ahead of meme coin and Solana trend cycles. Join 100,000+ active users — try Token Metrics free.
What non market cap signals matter most for Pump.fun token durability?
Engagement rate measured as messages per viewer per hour, average watch time, follower conversion from viewers, and seven day retention matter most for Pump.fun token durability. These show whether attention sticks once the stream ends.
What is the best way to track Pump.fun livestream leaders by Market Cap?
Use stalkchain.com/streams/scanner or Pump.fun token pages to view current market cap rankings. For historical context, save periodic screenshots to compare changes over time.
Does higher Market Cap predict higher future returns for Pump.fun tokens?
Higher Market Cap does not necessarily predict higher future returns. Market Cap reflects current valuation, not forward performance. Combine it with viewers, fees, and holder growth to evaluate momentum and resilience.
How often do Pump.fun token market cap rankings change?
Pump.fun token market cap rankings change intraday in many cases. This post reflects the timestamp of the provided screenshots.
what is pump.fun
Pump.fun is a Solana based launch and livestream platform where creators can launch tokens and stream to communities. It is a directory of coins and live shows with token pages, a feed, and basic discovery features.
how does pump.fun work
Creators launch a token and go live, viewers discover and watch streams, and token pages show public metrics. Always verify contract addresses on chain and avoid relying on unverified claims.
is pump.fun legit
Pump.fun is a widely used Solana site for token launches and streams. As with any crypto site, use caution, verify contracts, and never invest more than you can afford to lose.
how to make a coin on pump.fun / how to create a coin on pump.fun
On the pump.fun website, creators use the launch flow to create a token, provide basic details, and publish. Review the interface carefully and confirm on chain details before sharing links.
pump.fun program id solana / pump.fun solana program id / pump.fun program id
On Solana, a program ID identifies the deployed program that executes instructions. The program ID typically appears in developer tooling or Explorer views for the pump.fun contracts.
pump.fun api / pump.fun api docs / pump.fun api documentation
APIs let developers read public data like token lists or recent launches. Check official pump.fun documentation pages for endpoints and usage, then test carefully in a sandbox.
pump.fun bonding curve formula
A bonding curve describes how token price changes as supply increases. Many launch tools use curves that raise prices as more tokens are bought. This is educational only and not investment advice.
pump.fun airdrop
Airdrops are sometimes mentioned by communities. Treat any airdrop claims with caution and verify through official channels. There are no guarantees.
pump.fun price prediction
Price predictions are inherently uncertain and speculative. For education, compare public metrics and historical snapshots, and avoid relying on forecasts.
pump.fun coin / pump.fun token
These phrases generally refer to tokens launched on the site. Always verify token pages and on chain data.
pump.fun token price / pump.fun price / pump.fun pump price / pump.fun token pump price
Current price views are available on token pages. Prices change frequently during livestreams and may differ across aggregators.
pump.fun bot
Some users employ trading or alert bots to monitor launches and prices. Use third party tools with care and do not share private keys.
pump.fun revenue
Public pages sometimes describe fees and platform mechanics. Revenue models can include creator or platform fees documented on official resources.
teen pump.fun 250m khaliliwired / teen 50k pump.fun
These look like search phrases seen in community chatter. Treat unrelated viral terms with skepticism and rely on official project pages for facts.
pump.fun token bonding time raydium listing
Some launches discuss bonding or listing timelines. Check the specific token page or official posts for any Raydium listing details.
pump.fun logo
Logos typically appear on token or platform pages. Use official assets from the pump.fun website when available.
pump.fun website
Visit the main directory to explore streams, coin pages, and recent launches. Bookmark official links only.
Next Steps for Tracking Pump.fun Tokens
Disclosure
Educational content only. Cryptocurrency involves risk. Always do your own research.
.svg)


.png)
Token Metrics Media LLC is a regular publication of information, analysis, and commentary focused especially on blockchain technology and business, cryptocurrency, blockchain-based tokens, market trends, and trading strategies.
Token Metrics Media LLC does not provide individually tailored investment advice and does not take a subscriber’s or anyone’s personal circumstances into consideration when discussing investments; nor is Token Metrics Advisers LLC registered as an investment adviser or broker-dealer in any jurisdiction.
Information contained herein is not an offer or solicitation to buy, hold, or sell any security. The Token Metrics team has advised and invested in many blockchain companies. A complete list of their advisory roles and current holdings can be viewed here: https://tokenmetrics.com/disclosures.html/
Token Metrics Media LLC relies on information from various sources believed to be reliable, including clients and third parties, but cannot guarantee the accuracy and completeness of that information. Additionally, Token Metrics Media LLC does not provide tax advice, and investors are encouraged to consult with their personal tax advisors.
All investing involves risk, including the possible loss of money you invest, and past performance does not guarantee future performance. Ratings and price predictions are provided for informational and illustrative purposes, and may not reflect actual future performance.


%20Price%20Prediction%202025%2C%202030%20-%20Forecast%20Analysis.png)


.png)

%20Price%20Prediction%20.webp)


%20Price%20Prediction.webp)


%20Price%20Prediction%20Analysis%20-%20Can%20it%20Reach%20%24500%20in%20Future_.png)


