Text Link
Text Link
Text Link
Text Link
Thank you! Your submission has been received!
Oops! Something went wrong while submitting the form.

Stop Guessing, Start Trading: The Token Metrics API Advantage

Announcements

Big news: We’re cranking up the heat on AI-driven crypto analytics with the launch of the Token Metrics API and our official SDK (Software Development Kit). This isn’t just an upgrade – it's a quantum leap, giving traders, hedge funds, developers, and institutions direct access to cutting-edge market intelligence, trading signals, and predictive analytics.

Crypto markets move fast, and having real-time, AI-powered insights can be the difference between catching the next big trend or getting left behind. Until now, traders and quants have been wrestling with scattered data, delayed reporting, and a lack of truly predictive analytics. Not anymore.

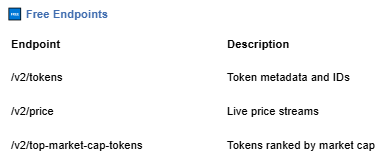
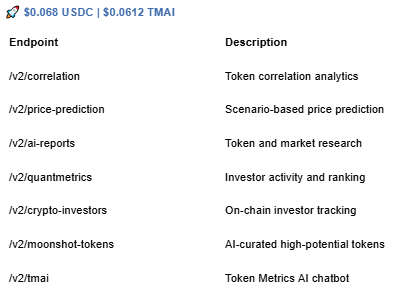
The Token Metrics API delivers 32+ high-performance endpoints packed with powerful AI-driven insights right into your lap, including:

  • Trading Signals: AI-driven buy/sell recommendations based on real-time market conditions.
  • Investor & Trader Grades: Our proprietary risk-adjusted scoring for assessing crypto assets.
  • Price Predictions: Machine learning-powered forecasts for multiple time frames.
  • Sentiment Analysis: Aggregated insights from social media, news, and market data.
  • Market Indicators: Advanced metrics, including correlation analysis, volatility trends, and macro-level market insights.

Getting started with the Token Metrics API is simple:

  1. Sign up at www.tokenmetrics.com/api
  2. Generate an API key and explore sample requests.
  3. Choose a tier–start with 50 free API calls/month, or stake TMAI tokens for premium access.
  4. Optionally–download the SDK, install it for your preferred programming language, and follow the provided setup guide.

At Token Metrics, we believe data should be decentralized, predictive, and actionable. 

The Token Metrics API & SDK bring next-gen AI-powered crypto intelligence to anyone looking to trade smarter, build better, and stay ahead of the curve. With our official SDK, developers can plug these insights into their own trading bots, dashboards, and research tools – no need to reinvent the wheel.

Research

Top Crypto Prime Brokers (2025): Best Institutional Trading & Settlement Platforms

Token Metrics Team
17 min read
  • If you’re an institution that needs multi-venue liquidity, off-exchange settlement, and integrated custody/financing, this guide ranks the top crypto prime brokers for 2025 based on scale, security posture, and product breadth.
  • Top picks: Coinbase Prime for integrated trading + qualified custody with negotiated fees; FalconX for deep liquidity and capital solutions across spot/derivatives; Anchorage Digital Prime for bank-regulated custody with prime services and derivatives access. (Coinbase)
  • Caveats: Pricing is often negotiated; availability and products vary by region and legal entity. Always verify coverage on the provider’s official pages before onboarding. (docs.cdp.coinbase.com)

Introduction: Why Prime Brokerage Matters in 2025

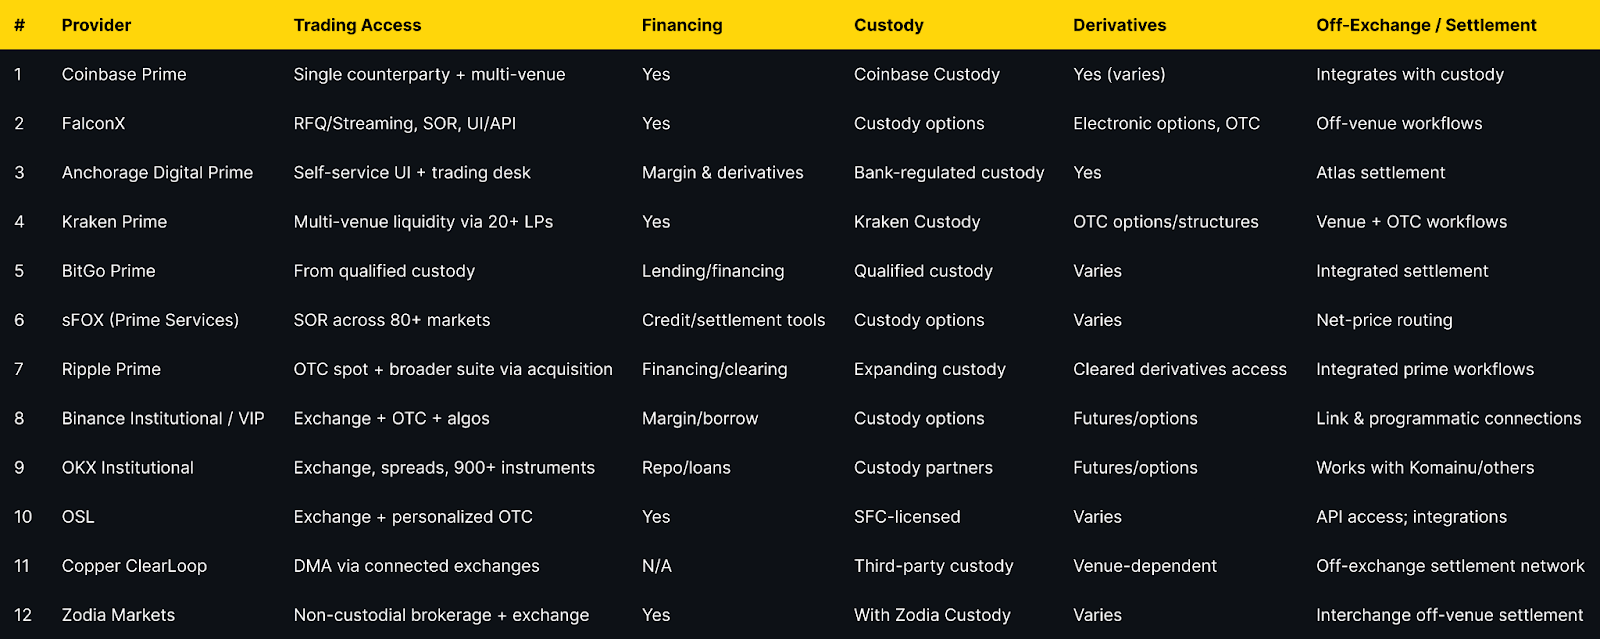
Institutional participation accelerated in 2025, and with it the need for crypto prime brokers that unify execution, financing, custody, and settlement while minimizing counterparty risk. The leading platforms now resemble capital-markets infrastructure: single-counterparty access to multi-venue liquidity, off-exchange settlement networks that keep assets in segregated custody, and derivatives rails to hedge risk. Solutions like Coinbase Prime, FalconX, and Anchorage Digital Prime illustrate this evolution, while settlement networks such as Copper ClearLoop reduce venue risk without slowing execution. (Coinbase)

Primary intent: commercial-investigational. This guide compares features, fees, regions, and tradeoffs, then maps use cases to the right providers—so teams can move from diligence to deployment with confidence.


Our Evaluation Methodology

SCORING_WEIGHTS (sum = 100):

  • Scale & Liquidity (25) – depth of venues/LPs, 24/7 execution, options/futures where applicable.
  • Security & Regulatory Posture (25) – qualified custody, bank licensing/registrations, segregation, insurance disclosures.
  • Product Breadth (15) – spot, OTC/RFQ, derivatives, financing, settlement networks.
  • Costs & Fees (10) – published or negotiated schedules, financing/borrow terms.
  • Connectivity & Tooling (10) – FIX/WebSocket APIs, OEMS/SOR, reporting.
  • Capital Efficiency (10) – cross-margin, off-exchange settlement, instant delegation.
  • Support & Service (5) – coverage windows, onboarding SLAs.

Verification approach: We relied on official product, pricing, docs, security, and status pages only. If a claim wasn’t verifiable on an official page, we omitted it. Last updated: November 2025.


Crypto Prime Brokerage Comparison: At a Glance


Notes: “Pricing” reflects publicly stated models (often negotiated). “Regions/Notes” summarize official disclosures and licensing language where available on provider sites.


Detailed Provider Analysis

Coinbase Prime — Full-service prime brokerage at scale

Overview. Coinbase Prime combines trading, financing, and qualified custody under one institutional platform, with negotiated trading fees and flexible order denomination (base/quote). Execution integrates with reporting and controls suitable for asset managers and corporates. (Coinbase)
Ideal For. Asset managers, corporates/treasuries, hedge funds, RIAs.
Standout Features. Integrated custody; negotiated All-In / Cost-Plus fee models; staking fee schedules; institutional reporting. (docs.cdp.coinbase.com)
Pricing. Negotiated, fee currency = quote currency. (docs.cdp.coinbase.com)
Availability. Global, entity-dependent; product availability varies by jurisdiction.
Worth Noting. Some services require separate agreements (e.g., validators, derivatives access).
Alternatives to Consider. Kraken Prime, Anchorage Digital Prime. (Kraken)  


FalconX — Deep liquidity & capital solutions across markets

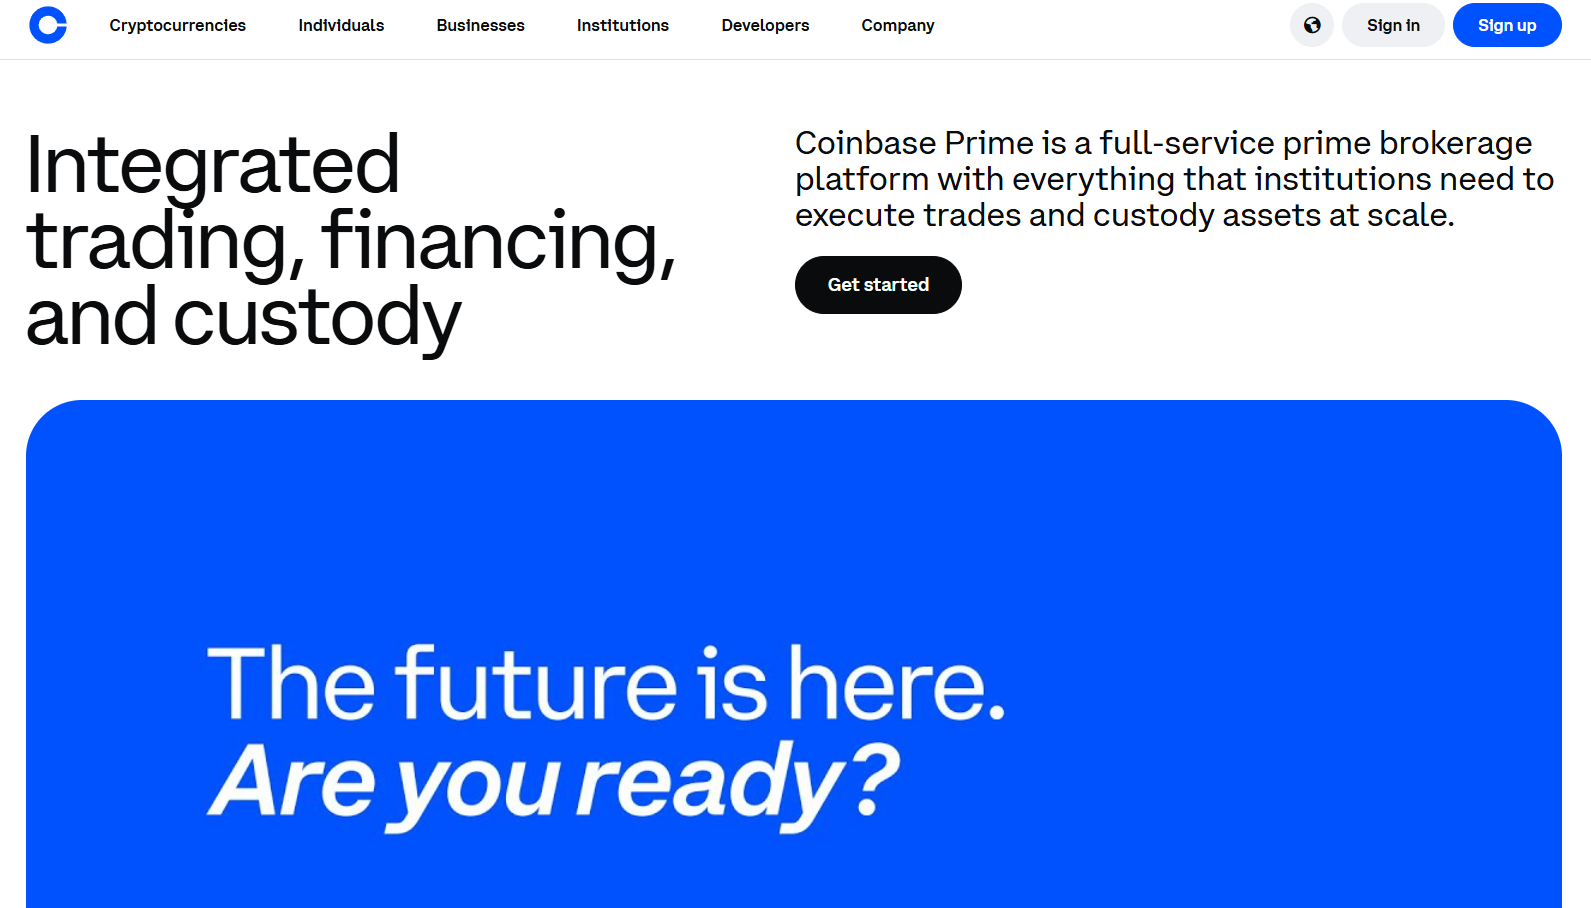
Overview. FalconX offers RFQ/streaming execution across spot and FX with FIX/WebSocket/REST connectivity, plus electronic options and capital solutions. Scale and 24/7 liquidity are central, with workflows for large tickets and programmatic strategies. (falconx.io)
Ideal For. Multi-strategy funds, HFT/systematic traders, market makers.
Standout Features. RFQ/streaming with TWAP/FOK; electronic options; FX desk integrated into prime; institutional APIs. (falconx.io)
Pricing. Negotiated; bespoke based on flow and venues.
Availability. Global institutional focus (entity-dependent).
Worth Noting. Derivatives access and product scope vary by entity/region.
Alternatives to Consider. Coinbase Prime, Kraken Prime. (Coinbase)  


Anchorage Digital Prime — Prime services on top of a US bank custodian

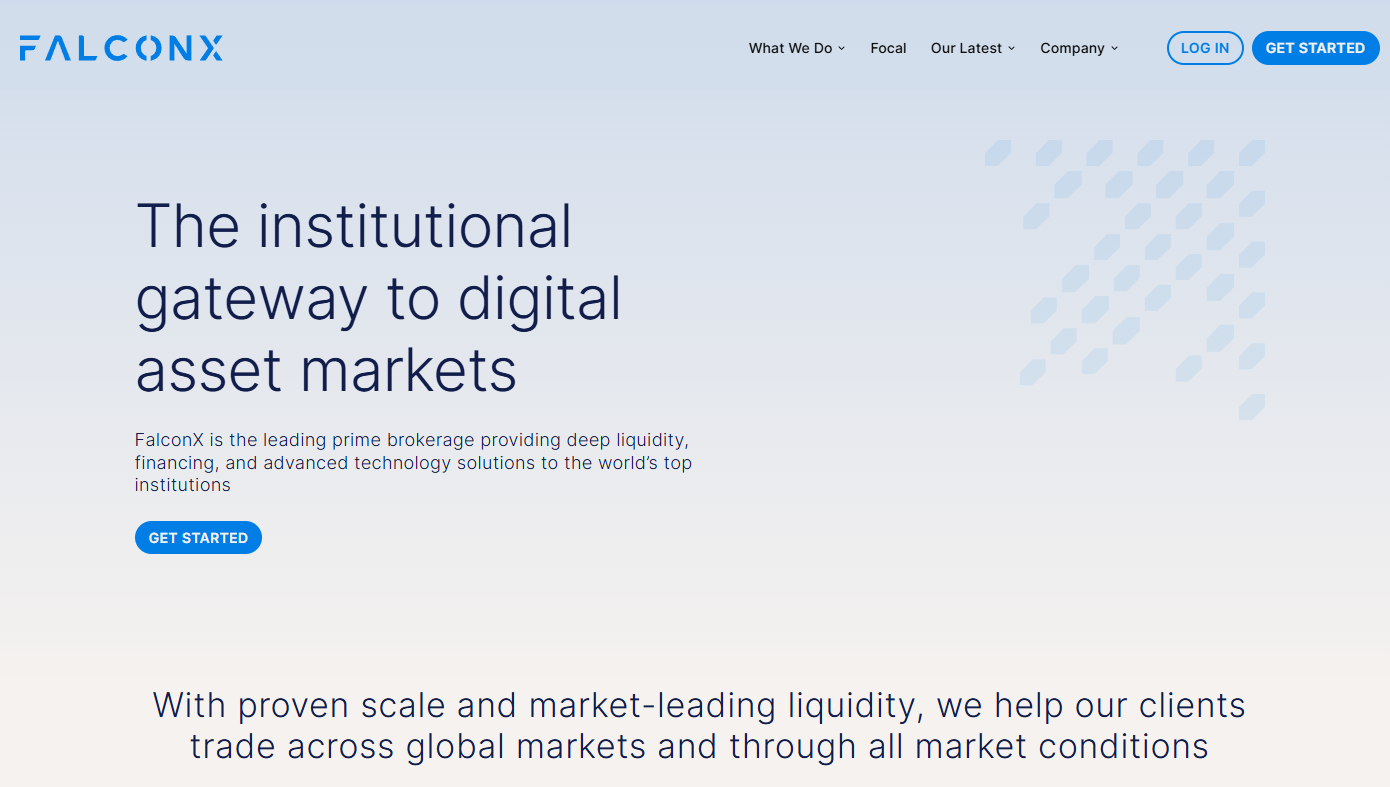
Overview. Anchorage Digital Prime delivers trading (13+ order types), derivatives, margin, and settlement built on Anchorage Digital Bank N.A. custody. A single interface and 24/7 trading desk support complex orders. (anchorage.com)
Ideal For. US-regulated custody requirements, governance-active institutions, corporates.
Standout Features. Bank-regulated custody; derivatives access; Atlas settlement; desk + API execution. (anchorage.com)
Pricing. Negotiated; service-by-entity.
Availability. US bank entity with global affiliates; services provided by specific Anchorage entities (see legal). (anchorage.com)
Worth Noting. Trading provided by separate non-bank entities; read entity-level disclosures. (anchorage.com)
Alternatives to Consider. BitGo Prime, Coinbase Prime. (The Digital Asset Infrastructure Company)  


Kraken Prime — Multi-venue liquidity with institutional fee tiers

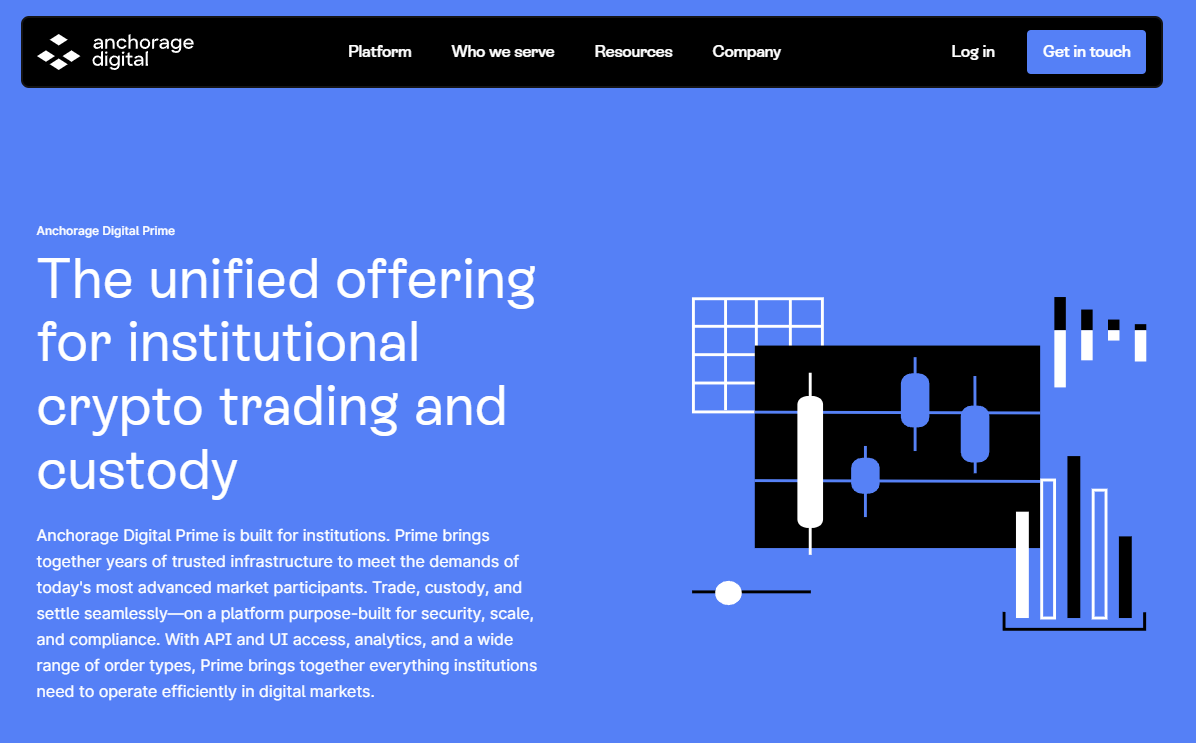
Overview. Kraken Prime aggregates 20+ liquidity providers and offers smart order routing, OTC spot and OTC derivatives (options/structures), plus custody integrations. Institutional fee perks are published for high-volume clients. (Kraken)
Ideal For. Funds seeking published fee schedules, multi-venue execution, and OTC coverage.
Standout Features. Multi-venue liquidity; FIX 4.4 and WebSockets APIs; OTC desk; institutional taker tiers. (Kraken)
Pricing. Maker/taker schedule with institutional perks at very high volumes. (Kraken)
Availability. Global, entity-dependent.
Worth Noting. Some advanced services require qualification and separate onboarding.
Alternatives to Consider. sFOX, Coinbase Prime. (sFOX)


BitGo Prime — Prime services from qualified custody

Overview. BitGo integrates trading, financing, and settlement directly from custody, with segregated, bankruptcy-remote accounts and published insurance coverage details. (The Digital Asset Infrastructure Company)
Ideal For. Institutions prioritizing segregation and custody-first workflows.
Standout Features. Segregated accounts; insurance disclosures; custody-integrated prime trading. (The Digital Asset Infrastructure Company)
Pricing. Negotiated; custody/prime fees depend on assets and activity.
Availability. Global entities with varying regulatory regimes.
Worth Noting. Derivatives access varies by entity/partner networks.
Alternatives to Consider. Anchorage Digital Prime, Copper ClearLoop. (anchorage.com)


sFOX (Prime Services) — Agency SOR across 80+ markets with institutional tooling

Overview. sFOX acts as an agnostic agent routing across 80+ markets for best execution, with net-price routing and institutional reporting. The platform positions itself as a full-service prime dealer for institutions. (sFOX)
Ideal For. Systematic strategies, RIAs/allocators, corporates seeking agency execution.
Standout Features. SOR across venues; platform-level price improvement; custody options. (sFOX)
Pricing. Tiered/negotiated; historical content points to fee optimization via routing. (sFOX)
Availability. US/global entities; enterprise onboarding.
Worth Noting. Product scope (derivatives, margin) varies; confirm coverage.
Alternatives to Consider. Kraken Prime, Coinbase Prime. (Kraken)


Ripple Prime — Multi-asset prime brokerage under Ripple

Overview. Following the acquisition and subsequent close of Hidden Road, Ripple Prime offers U.S. spot OTC execution and positions Ripple as the first crypto company to own and operate a global, multi-asset prime broker; custody capabilities expanded further in late 2025. (Ripple)
Ideal For. Institutions seeking an integrated multi-asset prime platform with digital asset rails.
Standout Features. OTC spot execution (U.S.); multi-asset coverage; financing/clearing. (Ripple)
Pricing. Negotiated.
Availability. U.S. launch and global expansion via Ripple entities. (Ripple)
Worth Noting. Product availability differs by jurisdiction and entity.
Alternatives to Consider. FalconX, Coinbase Prime. (falconx.io)


Binance VIP & Institutional — Exchange liquidity, OTC & programmatic access

Overview. Binance’s institutional suite spans exchange, OTC RFQ, algos, and programmatic connectivity with VIP tiers. Coverage and eligibility depend on jurisdiction; Binance.US operates separately for U.S. clients. (binance.com)
Ideal For. Non-US teams wanting direct exchange liquidity with OTC tools.
Standout Features. VIP tiers, proof-of-reserves, OTC block trading. (binance.com)
Pricing. Exchange/VIP schedules; negotiated OTC.
Availability. Region-dependent; check supported regions. (binance.com)
Worth Noting. U.S. availability/routes differ; compliance and onboarding vary by entity.
Alternatives to Consider. OKX Institutional, OSL. (OKX)


OKX Institutional — Scale, instruments, and U.S. presence via OKX US

Overview. OKX highlights high uptime, 900+ instruments, and institutional connectivity. U.S. availability exists through OKX US with scope/policies noted in compliance disclosures. (OKX)
Ideal For. Proprietary firms and funds trading a broad instrument set with API access.
Standout Features. Nitro Spreads, derivatives suite, institutional support. (OKX)
Pricing. Exchange schedule + VIP; negotiated for blocks.
Availability. Global; US services via OKX US (scope varies). (OKX)
Worth Noting. Product availability and licensing differ by region.
Alternatives to Consider. Binance Institutional, Kraken Prime. (binance.com)


OSL — HK SFC-licensed exchange, custody & OTC

Overview. OSL provides a licensed Hong Kong platform spanning custody, exchange, and OTC brokerage for institutions, with dedicated coverage in the region. (osl.com)
Ideal For. APAC institutions needing SFC-regulated venue/custody.
Standout Features. SFC-licensed exchange; institutional API; custody with insurance positioning. (sfc.hk)
Pricing. Schedule/negotiated.
Availability. Hong Kong and supported regions; institutional focus.
Worth Noting. Product availability differs by license and region.
Alternatives to Consider. Zodia Markets, Coinbase Prime. (Zodia Markets)


Copper ClearLoop — Off-exchange settlement network (multi-custodial)

Overview. ClearLoop enables instant delegation to connected exchanges while assets remain in segregated custody—now supporting third-party custodians like BitGo and Komainu. (Copper)
Ideal For. Institutions prioritizing venue risk reduction and capital efficiency.
Standout Features. Multi-custodial support; instant asset delegation; network of venues/prime brokers. (Copper)
Pricing. Varies by participants and volumes.
Availability. Global network; coverage depends on participating venues/custodians.
Worth Noting. Not a full prime broker by itself; pairs well with custody/venues.
Alternatives to Consider. Zodia Interchange, Komainu Connect. (zodia-custody.com)


Zodia Markets + Zodia Custody Interchange — Non-custodial brokerage + off-venue settlement

Overview. Zodia Markets offers institutional brokerage/exchange with non-custodial design, while Zodia Custody’s Interchange provides off-venue settlement (OVS)—trade while assets remain in custody. Registrations span UK, Ireland, ADGM. (Zodia Markets)
Ideal For. Institutions wanting bank-backed governance and segregated settlement flows.
Standout Features. Non-custodial brokerage; Interchange OVS network; institutional registrations. (Zodia Markets)
Pricing. Negotiated.
Availability. UK/EU/MENA institutional coverage (entity-specific). (Zodia Markets)
Worth Noting. Product scope varies by entity and venue integrations.
Alternatives to Consider. OSL, Copper ClearLoop. (osl.com)


Choosing the Right Prime Broker: A Framework

  • Regulatory posture needed? If you require US bank-regulated custody, start with Anchorage Digital Prime. For Hong Kong, OSL’s SFC licensing is key. For UK/EU bank-backed governance with off-venue settlement, consider Zodia. (anchorage.com)
  • Execution style. For multi-venue aggregation and published fee tiers, Kraken Prime is strong; for RFQ/streaming with electronic options, FalconX leads. sFOX suits agency SOR across many markets. (Kraken)
  • Integrated custody + trading. Coinbase Prime and BitGo Prime minimize operational friction by tying trading to qualified custody. (Coinbase)
  • Venue-risk reduction. If you want to trade while assets remain in custody, evaluate Copper ClearLoop or Zodia Interchange (and Komainu Connect as a related model). (Copper)
  • Instrument breadth and scale. For vast exchange liquidity and institutional programs, Binance Institutional and OKX Institutional are at-scale options (region permitting). (binance.com)

Integrating Token Metrics Intelligence

  • Research phase: Use Token Metrics screeners and on-chain/technical indicators to identify pairs suitable for your mandate (beta targets, breadth, liquidity screens).
  • Execution phase: Route orders via your prime broker’s APIs (e.g., FIX/WebSocket) selected above, while TM signals inform aggression/passivity and time-of-day tactics. (Kraken)
  • Monitoring: Feed fills, slippage, and borrow/financing into TM analytics to assess venue performance and adjust routing.
  • Optimization: Combine TM factor views with prime-broker borrow/financing and settlement options (e.g., off-exchange) to lower VaR and operational risk.

Start a Token Metrics trial to bring quantitative screening and scenario analysis into your institutional workflow.  


Security & Compliance Guidelines

  • Prefer segregated, bankruptcy-remote custody and confirm insurance disclosures where published. (The Digital Asset Infrastructure Company)
  • If you need a US bank custodian, validate services by legal entity and read the provider’s disclosures. (anchorage.com)
  • Use off-exchange settlement networks to reduce exchange exposure during execution. (Copper)
  • Confirm derivatives eligibility, margin terms, and cross-margin/netting treatment by entity/venue. (Kraken)
  • Require API keys/roles with least-privilege, HSM custody, and mandatory allow-listing.
  • Maintain jurisdictional watchlists and restrict activity accordingly (e.g., US vs non-US entities for global exchanges). (OKX)

Compliance note: This article is for research/education, not financial advice.


Avoiding Common Mistakes

  • Treating “prime” as one product—coverage and legal entities differ by service.
  • Assuming off-exchange settlement is automatic—confirm network membership and supported venues. (Copper)
  • Onboarding to the wrong entity—read the jurisdictional disclosures. (anchorage.com)
  • Ignoring negotiated fees—request All-In vs Cost-Plus quotes. (docs.cdp.coinbase.com)
  • Skipping disaster-recovery testing—simulate exchange outage + settlement failover.
  • Under-documenting OMS/EMS changes—keep audit-ready change logs.

Frequently Asked Questions

What is a crypto prime broker?
 A provider that consolidates institutional trading, financing, custody, and settlement, often with multi-venue access and risk controls. Modern variants add off-exchange settlement so assets remain in custody during execution. (zodia-custody.com)

Do prime brokers publish fees?
 Often no—fees are negotiated based on volumes, products, and relationship tier. Some venues publish maker/taker schedules with institutional perks. (docs.cdp.coinbase.com)

How does off-exchange settlement work?
 Networks like ClearLoop and Interchange let you delegate assets to venues for trading while keeping them in segregated custody, reducing counterparty risk. (Copper)

Which providers are strongest for regulated custody?
 Anchorage Digital Prime (US bank custody), BitGo (qualified custody), OSL (HK SFC-licensed custody/exchange), and Zodia (bank-backed with EU/UK registrations). (anchorage.com)

Can U.S. institutions use OKX or Binance?
 Access is region-dependent and varies by entity (e.g., OKX US scope). U.S. clients typically cannot use Binance.com and instead must evaluate Binance.US or other U.S.-eligible routes. Always check official disclosures. (OKX)


Final Recommendations

For most global institutions, a two-stack works best: (1) an integrated prime broker with qualified custody (Coinbase Prime, Anchorage Digital Prime, or BitGo Prime) and (2) a venue-risk mitigator like Copper ClearLoop or Zodia Interchange. Execution-heavy funds should add FalconX or Kraken Prime for multi-venue and OTC derivatives coverage, while OSL anchors APAC/HK mandates and OKX/Binance expand exchange reach where eligible. (Coinbase)

Related Resources:

Research

Best Yield Marketplaces for Real-World Assets (RWAs) in 2025

Token Metrics Team
29 min read
  • What this guide covers: A comprehensive evaluation of 10 leading platforms that enable tokenized real-world asset trading and yield generation across private credit, treasuries, real estate, and structured finance
  • Quick verdict: Ondo Finance for institutional-grade treasury exposure at ~5% APY, Maple Finance for crypto-collateralized credit facilities delivering 9-12% net yields, Goldfinch Prime for diversified access to private credit funds from Apollo and Ares
  • One key limitation to know: Many RWA platforms enforce strict accreditation requirements (minimum $50K-200K) and geographic restrictions, particularly excluding US investors from certain products due to securities regulations

Why Yield Marketplaces for RWAs Matter in January 2025

The real-world asset tokenization market has experienced explosive growth, surging from $85 million in April 2020 to over $25 billion by mid-2025—representing a staggering 245-fold increase driven primarily by institutional demand for yield, transparency, and regulatory clarity. Private credit dominates at approximately 61% of total tokenized assets, followed by treasuries at 30%, with major asset managers like BlackRock, Apollo, and Franklin Templeton now actively tokenizing institutional-grade products.

The convergence of traditional finance and decentralized infrastructure has created unprecedented opportunities for investors seeking stable, real-world yields without exposure to cryptocurrency volatility. The tokenized RWA market is projected to reach between $9.43 trillion and $18.9 trillion by 2030, with regulatory frameworks in Singapore, Hong Kong, and Dubai providing clear pathways for compliant innovation.

For crypto-native investors, RWA yield marketplaces offer a critical bridge to sustainable income streams backed by productive assets rather than purely speculative token emissions. Traditional allocators gain 24/7 access to fractional ownership, instant settlement, and programmable compliance—advantages impossible in legacy financial infrastructure.


How We Evaluated These Providers

We assessed platforms across six weighted criteria totaling 100 points:

  • Yield Quality & Sustainability (30%): Consistency of returns, asset backing, historical performance, and correlation to traditional markets
  • Security & Risk Management (25%): Custody solutions, audit history, legal recourse, collateralization ratios, and default handling protocols
  • Asset Coverage & Diversity (15%): Range of underlying assets, tranching options, and exposure across credit curves
  • Accessibility & Costs (15%): Minimum investments, fee structures, geographic availability, and KYC requirements
  • Liquidity & Redemption (10%): Secondary market depth, withdrawal timelines, and tokenization standards
  • Infrastructure & Compliance (5%): Regulatory licenses, blockchain integrations, and institutional partnerships

Data sources: Official platform documentation, on-chain analytics from RWA.xyz and DeFiLlama, third-party audits, and regulatory filings. Research conducted October 2024-January 2025.

Verification approach: Every fee structure, yield figure, and regional restriction cited was verified on official platform pages or regulatory disclosures. Unverifiable claims were excluded.


The Contenders: Quick Comparison  

Provider Reviews by Use Case

For Treasury-Backed Stability (4-5% Yield)

Top Pick: Ondo Finance — Institutional Treasury Tokenization Pioneer

Overview
 Ondo Finance manages over $1.6 billion in tokenized assets, offering institutional-grade access to US Treasury exposure through OUSG (backed by BlackRock's BUIDL fund) and USDY (a yield-bearing stablecoin). The platform bridges TradFi stability with DeFi composability through multi-chain deployment across Ethereum, Solana, Base, and XRP Ledger.

Ideal For

  • Institutional allocators seeking low-volatility dollar exposure
  • DeFi protocols requiring yield-bearing collateral
  • Treasuries managing idle stablecoin holdings
  • Investors prioritizing regulatory compliance and brand-name backing

Standout Features

  • Approximately 5% APY from short-term US Treasuries with daily interest payouts via rebasing mechanism
  • Integration with Ripple's RLUSD stablecoin for instant minting and redemption 24/7
  • Comprehensive SEC-registered infrastructure through acquisition of Oasis Pro, including broker-dealer, ATS, and transfer agent licenses
  • Strategic partnerships including anchor position in Fidelity's FDIT tokenized money market fund and launch of Ondo Global Markets for tokenized equities

Pricing
 Management fees embedded in net yield; typical 0.15-0.30% annual fee depending on product. OUSG requires $100K minimum; USDY accessible at lower thresholds with 4.29% APY.

Availability
 Global except US persons for certain products. Ethereum, Solana, Polygon, Aptos, Sei, Base, XRP Ledger, and Sui supported.

Worth Noting
 OUSG designed for qualified purchasers with extended lockup periods; less suitable for retail or high-frequency traders. Platform prioritizes institutional relationships over retail accessibility.

Alternatives to Consider: Franklin Templeton BENJI, OpenEden TBILL  


Runner-Up: Franklin Templeton BENJI — Legacy Asset Manager Innovation

Overview
 Franklin Templeton's $775 million Franklin OnChain U.S. Government Money Fund (BENJI) pioneered tokenized mutual funds in 2021, offering exposure to US government securities across eight blockchains with patent-pending intraday yield calculation.

Ideal For

  • Investors seeking regulated 40 Act fund structure
  • Collateral managers requiring second-by-second yield accrual
  • Multi-chain strategies needing broad blockchain compatibility
  • Users prioritizing traditional asset manager credibility

Standout Features

  • Intraday yield tracking down to the second, enabling proportional earnings even for partial-day holdings
  • Direct stablecoin purchases and redemptions with wallet-to-wallet transfer capability
  • 63% of AUM deployed on Stellar Network for optimal cost efficiency
  • Integrated with DeFi protocols for collateral and leverage applications

Pricing
 7-day current yield approximately 4.5-5.5% gross; 0.25% management fee. No minimum investment restrictions beyond standard mutual fund requirements.

Availability
 Global availability with specific KYC requirements. Active on Stellar, Ethereum, Arbitrum, Base, Avalanche, Polygon, Aptos, Solana, BNB Chain.

Worth Noting
 Traditional mutual fund constraints apply including daily NAV calculations and potential redemption delays during market stress.

Alternatives to Consider: Backed bIB01, Superstate Short Duration Government Securities  
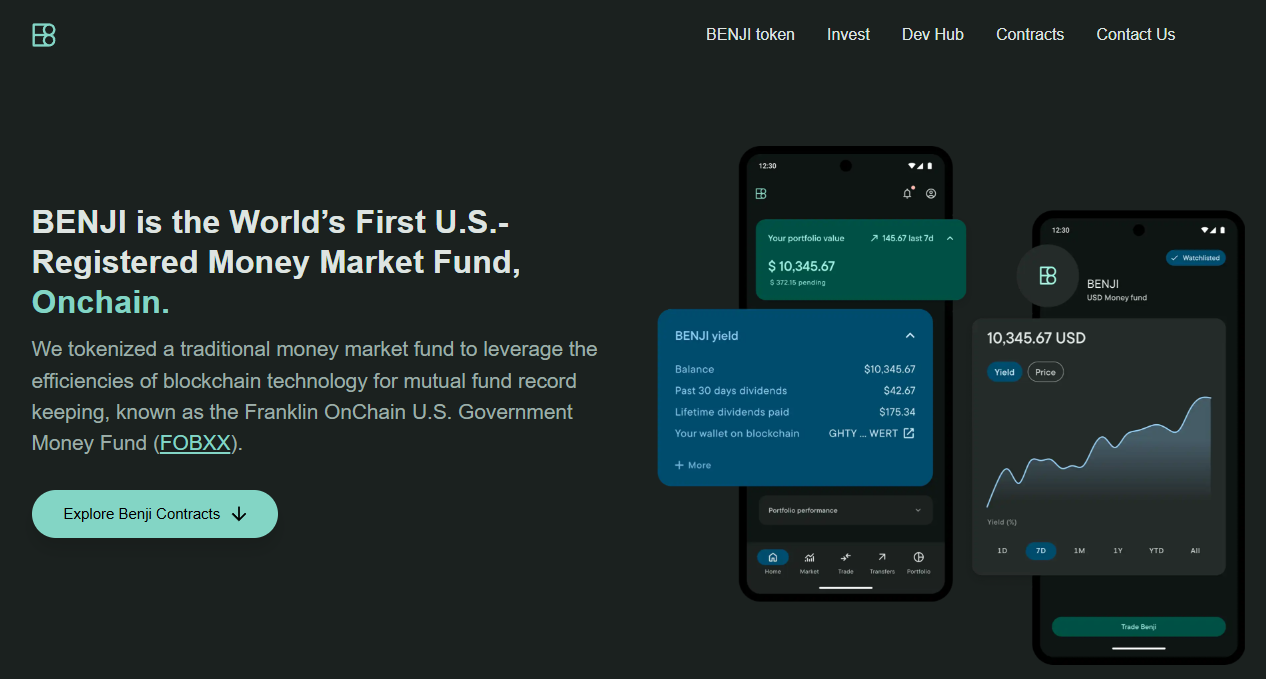

For Institutional Credit Exposure (8-12% Yield)

Top Pick: Maple Finance — Premier Crypto-Collateralized Lending

Overview
 Maple Finance manages over $4 billion in assets, specializing in institutional over-collateralized lending backed by Bitcoin, Ethereum, Solana, and XRP, targeting $100 billion in annual loan volume by 2030. The platform introduced SyrupUSDC for permissionless retail access alongside KYC-gated institutional pools.

Ideal For

  • Institutional lenders seeking exposure to cryptocurrency-backed credit
  • Liquidity providers comfortable with smart contract risk
  • Allocators targeting floating-rate, senior-secured structures
  • Investors seeking alternatives to traditional stablecoin farming

Standout Features

  • Consistent 9-12% net yields through undercollateralized institutional facilities and structured credit products
  • Strategic integration with Aave's $40 billion protocol bringing syrupUSDT to Plasma instance and syrupUSDC to core markets
  • Partnerships with Bitwise, Lido Finance (stETH-backed credit lines), and EtherFi (weETH collateral) expanding institutional adoption
  • Robust risk management combining decades of TradFi expertise with real-time on-chain monitoring

Pricing
 Variable by pool; typical effective yields 9-12% after protocol fees. Minimum investments pool-dependent, generally $10K-$50K for retail syrup products.

Availability
 Global with KYC requirements for lending. Institutional Maple requires accreditation; Syrup.fi open to broader participants.

Worth Noting
 Platform transitioned from uncollateralized to over-collateralized model after 2022 market turmoil. Historical defaults impacted certain pools; robust recovery mechanisms now in place.

Alternatives to Consider: Credix (emerging markets), TrueFi (uncollateralized DeFi)  
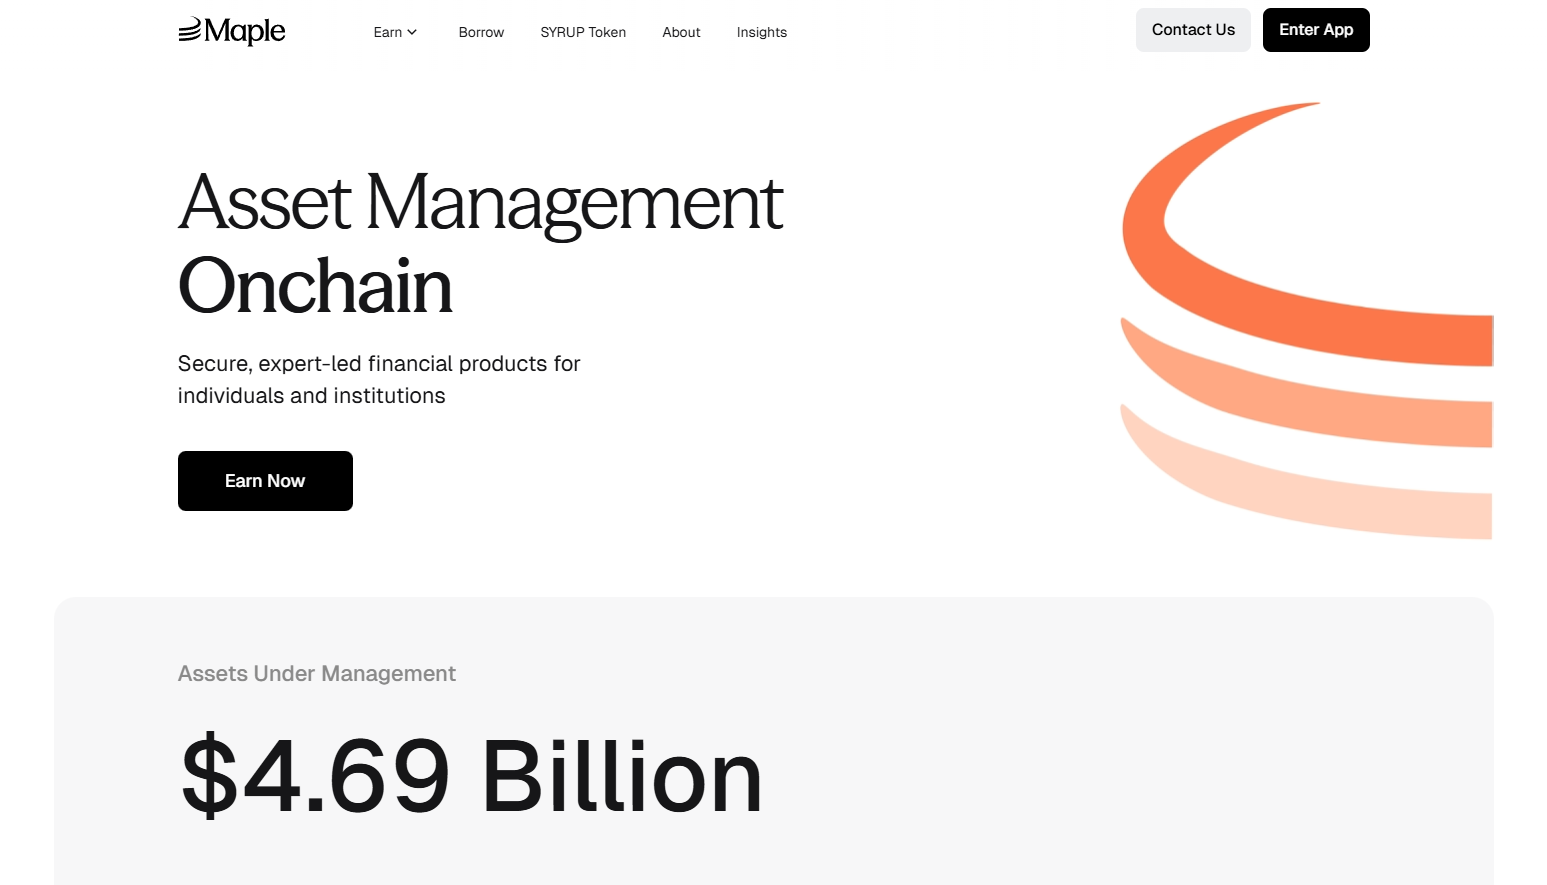

Runner-Up: Goldfinch Prime — Institutional Private Credit Access

Overview
 Goldfinch Prime aggregates exposure to multi-billion dollar private credit funds from Ares, Apollo, Golub Capital, and KKR, providing on-chain access to institutional-grade senior secured loans with over $1 trillion in collective AUM.

Ideal For

  • Non-US investors seeking diversified private credit exposure
  • Allocators targeting institutional fund performance without direct fund access
  • Participants seeking uncorrelated yield to crypto markets
  • Investors comfortable with longer lockup periods

Standout Features

  • Exposure to 1000+ senior secured loans across industries through vetted fund managers with 10+ years experience
  • Target returns of 9-12% net of fees with strict eligibility criteria including >90% senior secured portfolios and <0.75% target non-accrual rates
  • Heron Finance manages fund selection and vetting while fund managers handle all underwriting and default resolution
  • USDC-based deposits converted to proportional GPRIME tokens for continuous offering structure

Pricing
 Net yields 9-12% after embedded management fees and profit sharing. Minimum investments vary by pool structure; typically institutional minimums apply.

Availability
 Non-US persons only due to regulatory structure. KYC and accreditation verification required.

Worth Noting
 Exposure is indirect through fund shares rather than direct loan origination; fund managers absorb individual borrower default risk into aggregate yields. Liquidity limited compared to Treasury products.

Alternatives to Consider: Centrifuge private credit pools, Credix fintech lending


For Real Estate & Diversified Assets (6-10% Yield)

Top Pick: Centrifuge — Multi-Asset Tokenization Infrastructure

Overview
 Centrifuge operates as a multichain infrastructure platform enabling asset managers to tokenize real estate, trade finance, carbon credits, and structured credit with $1.2 billion TVL and recent 10x growth driven by the first on-chain CLO and tokenized S&P 500 index fund.

Ideal For

  • Investors seeking exposure to asset-backed securities beyond treasuries
  • Allocators comfortable evaluating tranched credit structures
  • Participants prioritizing transparency and on-chain asset verification
  • Portfolio managers wanting diversification across real-world credit types

Standout Features

  • Asset-agnostic architecture supporting structured credit, real estate mortgages, US treasuries, carbon credits, and consumer finance with full collateralization and legal recourse for investors
  • V3 platform enables cross-chain interoperability across Ethereum, Base, Arbitrum, Avalanche, BNB Chain, and Plume with integrated KYC and compliance-as-a-feature
  • Senior/junior tranche structures allowing risk-return customization
  • Partnership with Chronicle Labs for real-time price feeds and integration with Circle for USDC on/off-ramping

Pricing
 Yields vary by pool and tranche: typically 6-8% for senior tranches, 10-14% for junior tranches. Management fees embedded; pool-specific minimums apply.

Availability
 Global with KYC requirements. Pools may have additional jurisdictional restrictions based on underlying asset location.

Worth Noting
 Platform complexity requires understanding of tranched structures and asset-specific risks. Less liquid credit instruments offer less frequent pricing updates than treasury products.

Alternatives to Consider: RealT (US residential real estate focus), Republic (equity crowdfunding)


For Emerging Market Credit (12-18% Yield)

Top Pick: Credix — Latin American Fintech Lending

Overview
 Credix specializes in providing credit facilities to fintech lenders in Latin America, offering high-yield exposure to underserved credit markets with institutional-grade underwriting and local market expertise.

Ideal For

  • Sophisticated investors seeking higher risk-adjusted returns
  • Allocators comfortable with emerging market credit risk
  • Participants with extended investment horizons (12-24 months typical)
  • Investors seeking geographic diversification from US/EU markets

Standout Features

  • Target yields 12-18% reflecting emerging market risk premiums
  • Focus on fintech infrastructure enabling financial inclusion
  • Partnerships with established Latin American credit originators
  • Robust due diligence and monitoring of borrower networks

Pricing
 Pool-dependent yields typically 12-18% gross with management fees of 1-2%. Minimum investments generally $50K+ for accredited investors.

Availability
 Non-US persons primarily; requires accreditation verification and enhanced KYC given emerging market exposure.

Worth Noting
 Higher yields reflect higher credit and currency risk. Platform experienced challenges during regional economic volatility; enhanced risk controls now implemented.

Alternatives to Consider: Goldfinch V1 pools (emerging market focus), TrueFi uncollateralized pools


For Tokenization Infrastructure (Platform Providers)

Top Pick: Securitize — Industry-Leading Issuance Platform

Overview
 Securitize has tokenized over $4.5 billion in assets for 1.2 million investors across 3,000+ clients, operating as an SEC-registered transfer agent with integrated ATS for secondary trading. The platform powers major offerings including BlackRock's BUIDL fund.

Ideal For

  • Asset managers seeking turnkey tokenization solutions
  • Issuers requiring SEC-compliant digital security infrastructure
  • Institutional clients needing integrated custody and compliance
  • Projects prioritizing regulatory alignment and brand credibility

Standout Features

  • DS Protocol automates token issuance, transfer agent functions, and regulated secondary trading with $47 million funding led by BlackRock
  • Recent launch of STAC tokenized AAA CLO fund with BNY custody demonstrating institutional adoption trajectory
  • Comprehensive investor onboarding, KYC/AML, and reporting infrastructure
  • Partnerships with major asset managers and integration with Zero Hash for fiat conversion

Pricing
 Platform fees vary by issuance size and complexity; typically 0.5-2% of AUM plus basis point fees on transactions. White-label solutions available for enterprise clients.

Availability
 Global operations with jurisdiction-specific compliance modules. Primary focus on US, EU, and APAC institutional markets.

Worth Noting
 Securitize is an issuance platform rather than direct investment product; investors access opportunities through partner funds and offerings launched on the infrastructure.

Alternatives to Consider: Tokeny (EU-focused), Polymath/Polymesh (security token specialists)


Complete Provider Directory

  • Backed Finance: European MiCA-compliant tokenization platform offering bIB01 (Swiss government bond exposure) and bC3M (commodity basket). Strong focus on regulatory alignment with modest 3-5% yields and low entry barriers.
  • Swarm Markets: Decentralized platform enabling fractional ownership of real estate and private credit with $1K-$50K minimums. Emphasizes accessibility while maintaining compliance through distributed infrastructure.
  • TrueFi: Uncollateralized lending protocol using on-chain credit scoring and portfolio diversification. Higher risk-return profile (8-15% targets) with full transparency of borrower pools and performance metrics.
  • Archax: UK FCA-regulated platform for institutional tokenization of bonds, funds, and money markets. Focus on traditional finance compatibility with stringent accreditation requirements.

Making Your Selection: Key Questions

  • What yield stability do you require?
     Treasury-backed platforms (Ondo, Franklin Templeton) offer predictable 4-5% returns with minimal volatility. Credit-focused platforms (Maple, Goldfinch) target 9-12% but introduce credit risk and performance variability.
  • What is your risk tolerance for underlying collateral?
     Government securities provide lowest risk; over-collateralized crypto loans add smart contract and liquidation risks; uncollateralized emerging market credit carries highest default potential.
  • Do you meet accreditation and minimum investment thresholds?
     Many institutional products require $50K-$200K minimums and qualified purchaser status. Retail-accessible options like USDY and syrupUSDC lower barriers but may sacrifice yield.
  • What liquidity do you need?
     Treasury tokens generally offer daily liquidity; private credit pools may have quarterly redemption windows; real estate tokenization can involve 12-24 month lockups.
  • How important is regulatory compliance?
     Platforms like Ondo, Franklin Templeton, and Securitize prioritize SEC registration and traditional fund structures. Purely DeFi-native protocols offer less regulatory clarity but greater composability.
  • What blockchain ecosystems do you operate in?
     Multi-chain deployment (Ondo, Centrifuge) provides flexibility; single-chain specialization (some Maple pools) may offer optimization but limits interoperability.
  • Do you have geographic restrictions?
     US persons often excluded from highest-yield opportunities due to securities laws. European investors benefit from MiCA framework; APAC sees growing regulatory clarity.
  • What level of transparency do you require?
     On-chain native protocols offer real-time asset verification; hybrid models may rely on periodic attestations and third-party audits.
  • Are you seeking passive income or active yield strategies?
     Treasury staking provides set-and-forget returns; DeFi integrations enable leverage, collateral strategies, and yield optimization requiring active management.
  • How much operational complexity can you handle?
     Single-platform solutions simplify but limit optionality; multi-protocol strategies maximize returns but require gas management, tax tracking, and security across multiple platforms.

Maximizing Your Setup with Token Metrics

Token Metrics provides critical intelligence for navigating RWA yield opportunities through data-driven analysis and market insights.

Research Phase: Leverage Token Metrics' fundamental analysis to evaluate tokenized asset protocols, comparing on-chain metrics, TVL trends, and yield sustainability indicators. Our RWA sector reports identify emerging platforms and highlight regulatory developments across jurisdictions.

Portfolio Construction: Use quantitative scoring to allocate across risk tiers—balancing stable treasury exposure with higher-yield credit products. Token Metrics' portfolio tools help optimize diversification while monitoring correlation to traditional crypto markets.

Ongoing Monitoring: Real-time alerts notify you of yield changes, protocol upgrades, and risk events. Our dashboard aggregates performance across multiple RWA platforms, tracking your yield-bearing positions alongside broader cryptocurrency holdings.

Risk Management: Token Metrics' risk analytics assess smart contract security, custody arrangements, and counterparty exposure. Our reports flag platforms with concerning yield sustainability metrics or operational red flags before they impact your capital.

Start your Token Metrics free trial to access institutional-grade RWA research and optimize your real-world asset allocation.  


Essential Security Practices

  • Custody Verification: Confirm that platforms use institutional-grade custodians (Coinbase Custody, BitGo, Fireblocks) for underlying assets. Verify proof-of-reserve attestations and third-party audits.
  • Smart Contract Risk: Review audit reports from reputable firms (Trail of Bits, OpenZeppelin, Certora). Understand upgrade mechanisms and timelock protections on protocol contracts.
  • Legal Structure Assessment: Examine SPV formation, bankruptcy remoteness, and investor recourse mechanisms. Ensure tokenization structure provides actual legal claim on underlying assets, not just economic exposure.
  • Regulatory Compliance: Verify platforms maintain necessary licenses (broker-dealer, transfer agent, ATS) in relevant jurisdictions. Confirm offerings comply with securities laws in your domicile.
  • Counterparty Risk: Understand who services loans, manages defaults, and handles liquidations. Evaluate track records of asset originators and credit underwriters.
  • Liquidity Risk Management: Never allocate more than you can afford to lock up for stated redemption periods. Maintain buffer capital for market volatility and potential redemption delays.
  • Tax Implications: Consult tax professionals on treatment of tokenized yield—may be classified as interest income, dividends, or capital gains depending on structure and jurisdiction.
  • Geographic Restrictions: Verify you're eligible to participate based on residency. Using VPNs or misrepresenting location can result in frozen funds and legal liability.
  • Platform Concentration: Diversify across multiple RWA providers to reduce single-point-of-failure risk. No single platform should represent majority of yield allocation.
  • Documentation: Maintain records of all transactions, yield distributions, and platform communications for tax reporting and potential disputes.

This article is for research and educational purposes, not financial advice. RWA investments carry risks including loss of principal.


What to Avoid

  • Ignoring minimum holding periods: Many RWA products enforce lockups or redemption windows. Treating them as liquid positions can leave you unable to access capital when needed.
  • Chasing unsustainably high yields: Promised returns significantly above market rates often indicate excessive risk. Verify underlying asset performance and historical consistency before committing capital.
  • Overlooking platform liquidity: Token existence on-chain doesn't guarantee exit liquidity. Check secondary market depth and historical spread between minting and redemption prices.
  • Neglecting jurisdictional compliance: Accessing platforms not available in your region can result in frozen accounts and regulatory penalties. Always verify eligibility before depositing funds.
  • Underestimating smart contract risk: Even well-audited protocols face exploitation risk. Size positions appropriately and monitor security incident disclosures across the ecosystem.
  • Failing to verify asset backing: Don't rely on marketing claims. Demand proof-of-reserve, third-party attestations, and transparent reporting on underlying collateral.
  • Concentrating in single asset class: Over-allocating to one RWA category (e.g., all private credit) eliminates diversification benefits. Balance across treasuries, credit, and real estate where possible.
  • Ignoring fee structures: Management fees, performance fees, and transaction costs compound over time. Calculate net yields after all costs when comparing platforms.

Reader Questions Answered

What's the difference between tokenized treasuries and yield-bearing stablecoins?

 Tokenized treasuries (like OUSG) represent direct ownership of US Treasury securities with yield passed through to holders. Yield-bearing stablecoins (like USDY) maintain $1 peg while distributing treasury yields via rebasing or airdrops. Treasuries may fluctuate slightly with NAV; yield stablecoins prioritize price stability.

Are RWA yields taxable differently than crypto staking rewards?

 Likely yes, though tax treatment varies by jurisdiction. RWA yields from treasuries or credit facilities often classified as interest income taxed at ordinary rates. Crypto staking may be treated as income at receipt or capital gains at sale depending on location. Consult tax professionals for specific guidance.

Can I use tokenized RWAs as collateral in DeFi protocols?

 Increasingly yes. Platforms like Maple, Ondo (via Flux Finance), and Centrifuge enable using tokenized assets as DeFi collateral. However, support varies by protocol and asset—USDY and OUSG see broader integration than niche real estate tokens. Liquidation risks apply if collateral value drops.

What happens if the platform goes bankrupt?

 Properly structured tokenization isolates assets in bankruptcy-remote SPVs, protecting investor claims even if platform operator fails. However, redemption processes may be delayed and require legal navigation. This is why verifying legal structure and custodial arrangements is critical.

How liquid are RWA tokens compared to stablecoins?

 Significantly less liquid. While stablecoins have billions in daily DEX volume, most RWA tokens trade thinly or only through platform-controlled redemption mechanisms. Treasury tokens offer better liquidity than private credit or real estate, but all lag traditional stablecoins substantially.

Do I need to be an accredited investor?

 Depends on the platform and your location. US-based offerings often require accreditation; international platforms may have lower barriers. Products like USDY, syrupUSDC, and BENJI target broader accessibility, while institutional credit pools restrict to qualified purchasers.

What are the main risks that could cause loss of principal?

 (1) Underlying asset default (credit risk), (2) smart contract exploitation, (3) platform insolvency without proper asset segregation, (4) regulatory action freezing operations, (5) stablecoin de-pegging for yield products denominated in USDC/USDT, (6) liquidation cascades in collateralized structures.

How do yields compare to traditional finance alternatives?

 Tokenized treasuries (4-5%) match conventional money market funds but with 24/7 access. Private credit RWAs (9-12%) offer premiums over corporate bonds due to illiquidity and platform novelty. Emerging market RWA yields (12-18%) comparable to EM debt funds with added smart contract risk.


Bottom Line

Real-world asset yield marketplaces represent the maturation of blockchain infrastructure beyond speculation into productive finance. For investors seeking stable, asset-backed returns uncorrelated to cryptocurrency volatility, platforms like Ondo Finance and Franklin Templeton deliver institutional-grade treasury exposure with DeFi composability. Those comfortable with credit risk can access superior yields through Maple Finance's collateralized institutional lending or Goldfinch Prime's diversified private credit exposure.

The key to success: match platform selection to your specific risk tolerance, liquidity needs, and regulatory constraints. Treasury products suit conservative allocators prioritizing capital preservation; credit platforms reward investors accepting higher risk for enhanced returns; multi-asset infrastructure like Centrifuge offers diversification across real-world credit types.

Start with smaller allocations to understand platform mechanics, redemption processes, and yield consistency before committing substantial capital. The RWA sector's rapid growth will continue creating opportunities, but also attracting lower-quality offerings—due diligence remains paramount.

Related Resources:


About This Research

Methodology: This guide evaluated 20+ RWA platforms through analysis of official documentation, on-chain data, regulatory filings, and third-party audits. Platforms selected represent meaningful TVL (>$100M), regulatory compliance, and operational track record. Final selection prioritized diversity across asset classes and investor accessibility tiers.

Research Sources:

  • Ondo Finance: Product documentation, tokenomics, OUSG/USDY specifications, Oasis Pro acquisition disclosure
  • Maple Finance: Platform whitepaper, syrupUSDC mechanics, Aave integration announcement, CEO interviews
  • Centrifuge: V3 technical documentation, pool analytics, Republic partnership details
  • Goldfinch: Prime pool specifications, fund manager criteria, Heron Finance structure
  • Franklin Templeton: BENJI platform technical details, intraday yield patent documentation, multi-chain deployment
  • Securitize: DS Protocol documentation, STAC fund launch details, BlackRock partnership announcements
  • RWA.xyz: Platform TVL data, tokenization metrics, market growth analysis
  • DeFiLlama: Protocol TVL tracking, historical performance data
  • BCG/Ripple: RWA market projections and industry research
  • VanEck, Coinbase, Binance: Sector research reports on RWA growth trajectories

All data current as of January 2025. Platform features and yields subject to change; verify current terms on official websites before investing.

Research

Top Gold & Commodity-Backed Tokens (2025)

Token Metrics Team
12 min read

Who this guide is for. Crypto investors and treasurers comparing gold-backed tokens and other commodity-backed assets that can be audited and, in many cases, redeemed for metal.
Top three picks. PAX Gold (PAXG) for regulated, bar-linked redemption; Tether Gold (XAUt) for broad awareness and simple fees; Kinesis (KAU/KAG) for spend-and-yield use cases.
Key caveat. Redemption minimums, custody locations, and fees vary by issuer; always confirm regional eligibility and schedules on the official pages.


Introduction: Why Commodity-Backed Tokens Matter in 2025

Gold-backed tokens give on-chain ownership exposure to vaulted bullion with transparent allocation and, often, physical redemption, blending the inflation hedge of metals with crypto liquidity. In 2025, they’re used for hedging, collateral, cross-border settlement, and “digital cash” backed by tangible assets. A commodity-backed token is a blockchain token that represents title to a specific quantity of a real-world commodity (for example, 1 troy ounce or 1 gram of gold) held by a custodian, typically with published fees, vault locations, and redemption rules. Our picks prioritize liquidity, security controls, breadth of metals, cost transparency, and global accessibility.


Best Commodity-Backed Tokens in November 2025 (Comparison Table)


We excluded defunct or sunset projects (e.g., PMGT; CACHE Gold ceased backing CGT on Sept 30, 2025). (perthmint.com)


Top 10 Gold & Commodity-Backed Tokens in November 2025

1) PAX Gold (PAXG) — Best for bar-linked redemption & regulatory posture

Why Use It. PAXG links each token to specific LBMA Good Delivery bars stored in London, offering direct bar redemption (institutional minimums apply) or USD redemption at spot. Paxos publishes fee schedules and notes no storage fee charged to customers at this time. (paxos.com)
Best For. Institutions; HNW hedgers; DeFi users needing reputable collateral.
Notable Features. LBMA bars; serial-number linkage; custodied in London; fiat redemption option. (paxos.com)
Fees Notes. Creation/destruction fees; no storage fee currently per issuer help center. (help.paxos.com)
Regions. Global (issuer KYC).
Consider If. You can meet bar redemption minimums and UK vault logistics. (help.paxos.com)
Alternatives. Tether Gold (XAUt); VNX Gold (VNXAU).  


2) Tether Gold (XAUt) — Best for simple pricing & broad availability

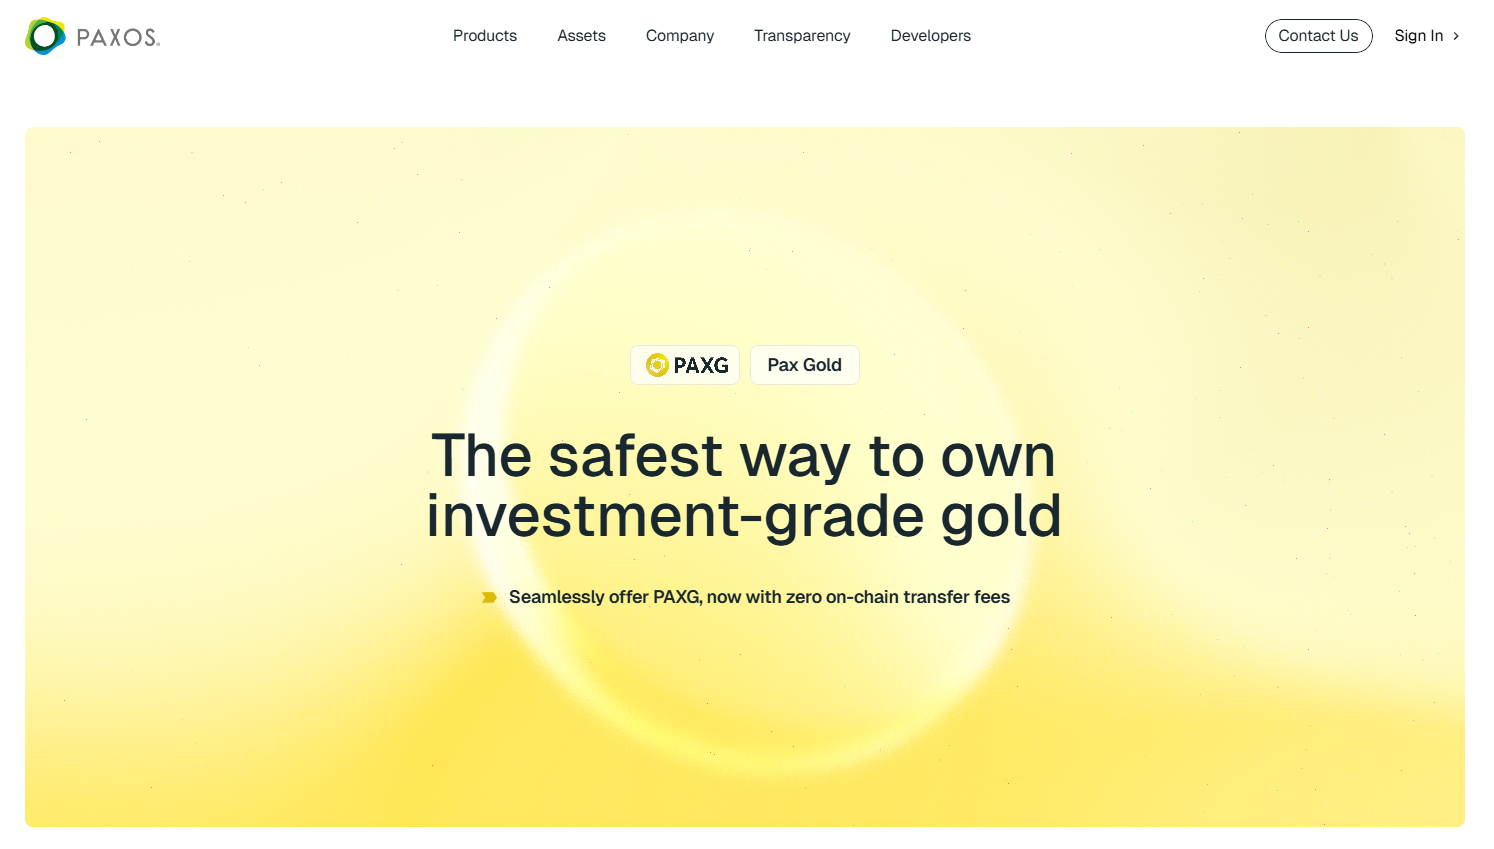
Why Use It. XAUt represents allocated gold and can be redeemed for physical gold or USD; Tether publishes a straightforward 0.25% creation/redemption fee and a one-time verification fee for onboarding. FAQs outline redemption mechanics and bar specifics. (Tether)
Best For. Traders seeking brand familiarity; cross-chain users (ETH/TRON).
Notable Features. Bar metadata; physical or USD redemption; no custody fee disclosed beyond the transaction fee. (Tether)
Fees Notes. 25 bps create/redeem; separate KYC verification fee. (Tether)
Regions. Global (issuer KYC).
Consider If. You need clear fee math but don’t require bar-specific allocation like PAXG.
Alternatives. PAX Gold (PAXG); Kinesis (KAU).  


3) Kinesis KAU (Gold) / KAG (Silver) — Best for spend-and-yield utility

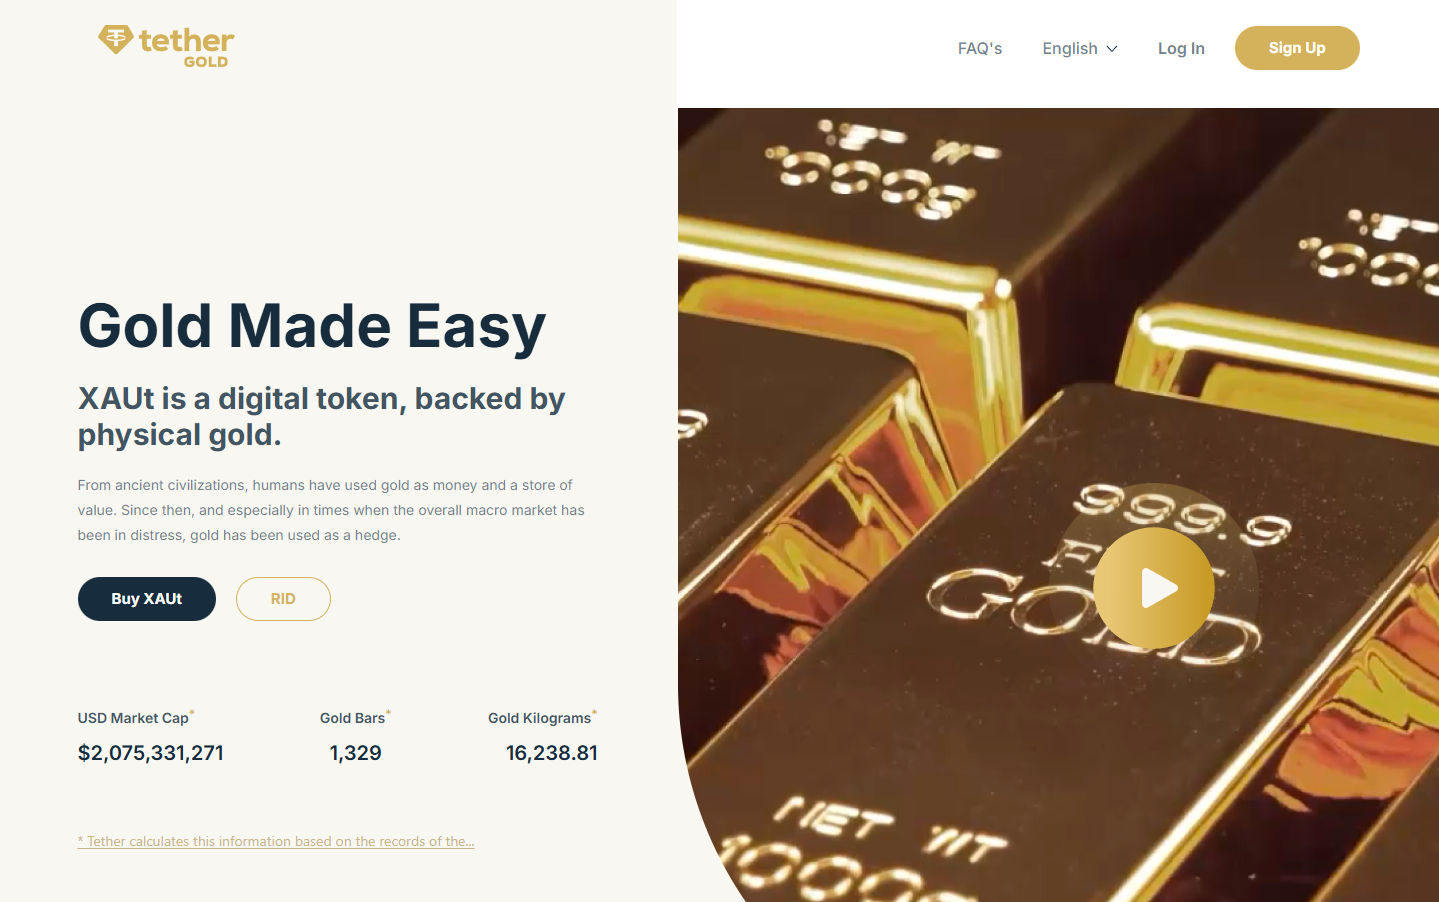
Why Use It. Kinesis combines metal-backed tokens with an exchange, cards, and yields funded from platform fees (published yield-share). Trading and precious metals transactions show ~0.22% execution fees on official schedules. (Kinesis)
Best For. Users wanting to spend gold/silver, earn monthly yields, and keep fees predictable.
Notable Features. Fee-share yield (published); exchange, card rails; gold & silver pairs. (Kinesis)
Fees Notes. ~0.22% buy/sell/trade; other fees per schedule. (Kinesis)
Regions. Global (platform KYC/availability).
Consider If. You prefer an integrated platform over a standalone token.
Alternatives. VNX (VNXAU/VNXAG); Aurus (tXAU/tXAG).  


4) Comtech Gold (CGO) — Best for XDC ecosystem & Shariah-compliant framework

Why Use It. CGO tokenizes 1g gold units on the XDC (XRC-20) network, with a published fee structure for mint/redeem (0.50%), transfers (0.50%), and custody notes in FAQs. Documentation details creation/redemption and delivery fees. (comtechgold.com)
Best For. XDC builders; users needing Shariah-compliant structuring.
Notable Features. On-chain proofing; fee schedule; vault delivery options. (comtechgold.com)
Fees Notes. 0.50% mint/redeem; 0.50% transfer; custody terms disclosed. (comtechgold.com)
Regions. Global (issuer terms apply).
Consider If. You’re comfortable with XDC rails and issuer fee model.
Alternatives. PAXG; VNXAU.


5) VNX Gold (VNXAU) — Best for EEA vaulting & multi-chain issuance

Why Use It. VNXAU gives direct ownership of allocated bars stored in Liechtenstein with a public allocation lookup tool. VNX runs on Ethereum, Polygon, Q, and Solana, and has communications on redemption and delivery. (VNX)
Best For. EEA users; diversification across chains.
Notable Features. Allocation lookup by serial; segregated AAA-jurisdiction vault; multi-chain. (VNX)
Fees Notes. See VNX pricing and product pages for current schedules.
Regions. EEA emphasis; global availability varies by KYC.
Consider If. You want EEA custody and serial-level transparency.
Alternatives. PAXG; XAUt.


6) Aurus tGOLD (tXAU) / tSILVER (tXAG) — Best for gram-denominated multi-metal exposure

Why Use It. Aurus issues 1-gram tokens backed by vaulted gold and silver with insured, audited storage. tGOLD and tSILVER support multi-chain DeFi integrations and a mobile app, with ecosystem partners for mint/redeem. (AURUS)
Best For. DeFi users; small-denomination accumulation; multi-metal portfolios (includes platinum via tXPT).
Notable Features. 1g units; insured vaulted metals; app & dashboard; partner network. (AURUS)
Fees Notes. Exchange/network fees; issuer/partner fees may apply.
Regions. Global (partner KYC where required).
Consider If. You want gram-level flexibility and cross-chain access.
Alternatives. Kinesis; VNX.


7) Gold Silver Standard (AUS/AGS) — Best for Australia-based custody & simple redemption

Why Use It. Tokens AUS (gold) and AGS (silver) are backed by allocated bullion held in Australian high-security vaults with $0 storage and transfer at the issuer level and partner-facilitated redemptions. (goldsilverstandard.com)
Best For. AUD-centric investors; straightforward physical pickup/delivery via partners.
Notable Features. 1g linkage; local redemption via Ainslie partners; Australia-first focus. (goldsilverstandard.com)
Fees Notes. Issuer lists $0 storage/transfer; exchange and redemption partner fees may apply. (goldsilverstandard.com)
Regions. Australia focus; global varies.
Consider If. You need straightforward redemption in Australia.
Alternatives. PAXG; VNXAU.


8) VNX Silver (VNXAG) — Best for EEA silver allocation & transparency tools

Why Use It. VNXAG mirrors the VNXAU model for silver, backed by allocated metal with the same allocation lookup tooling and multi-chain issuance. (VNX)
Best For. EEA investors prioritizing silver in segregated storage.
Notable Features. Allocation lookup; EEA custody; multi-chain support. (VNX)
Fees Notes. See VNX site for current schedules.
Regions. EEA emphasis; global varies.
Consider If. You want EEA-vaulted silver with serial-level transparency.
Alternatives. KAG; tXAG.


9) VeraOne (VRO) — Best for euro-area buyers wanting 1-gram ERC-20

Why Use It. VRO is an ERC-20 token pegged to 1 gram of LBMA-standard gold, issued by a long-standing French precious-metal group; materials describe secured storage and regular audits. (VeraOne)
Best For. EU users; gram-based savings; euro on-ramps.
Notable Features. 1g linkage; audited storage; EU presence. (VeraOne)
Fees Notes. Issuer materials outline model; confirm current fees on site.
Regions. EU focus; global access varies.
Consider If. You want EU branding and ERC-20 simplicity.
Alternatives. PAXG; VNXAU.


10) AgAu — Best for Swiss custody & peer-to-peer design

Why Use It. AgAu outlines 1:1 backed gold and silver tokens with Swiss custody and a peer-to-peer payment focus; docs and reports describe convertibility and audited reserves. (agau.io)
Best For. Users seeking Swiss jurisdiction and payments-style UX.
Notable Features. Swiss issuer; P2P spend; audit & documents hub. (agau.io)
Fees Notes. See issuer documentation for fees and redemption steps.
Regions. Global (jurisdictional checks apply).
Consider If. You want Swiss custody with payments emphasis.
Alternatives. VNXAU; AUS.


Decision Guide: Best by Use Case

  • Regulated, bar-specific redemption: PAX Gold (PAXG). (paxos.com)
  • Simple fee schedule & brand familiarity: Tether Gold (XAUt). (Tether)
  • Spend metals + monthly fee-share yield: Kinesis (KAU/KAG). (Kinesis)
  • XDC network users: Comtech Gold (CGO). (comtechgold.com)
  • EEA custody & allocation lookup: VNX (VNXAU/VNXAG). (VNX)
  • Gram-based, multi-metal DeFi: Aurus (tXAU/tXAG). (AURUS)
  • Australia-centric custody & pickup: Gold Silver Standard (AUS/AGS). (goldsilverstandard.com)
  • EU 1-gram ERC-20: VeraOne (VRO). (VeraOne)
  • Swiss custody & P2P payments: AgAu. (agau.io)

How to Choose the Right Commodity-Backed Token (Checklist)

  • ☐ Region eligibility and KYC match your profile.
  • ☐ Underlying metal type and unit (ounce vs gram).
  • Redemption rules: minimums, delivery locations, timelines.
  • Custody: vault jurisdiction, insurer, LBMA accreditation.
  • Fee transparency: creation, redemption, storage, transfer, network.
  • Audit/attestation cadence and allocation lookup tools.
  • Chains supported and DeFi integration needs.
  • ☐ Support channels and documentation depth.
    Red flags: vague custody details, unclear redemption, or discontinued programs.

Use Token Metrics With Any Commodity-Backed Token

  • AI Ratings to screen metal-linked assets and related ecosystem tokens.


  • Narrative Detection to spot inflows to on-chain RWAs.
  • Portfolio Optimization to size metal exposure vs. crypto beta.
  • Alerts & Signals to time entries/exits around macro prints.
    Workflow: Research → Select issuer → Execute on-chain or via platform → Monitor with alerts.


CTA: Start free trial to screen assets and time entries with AI.  


Security & Compliance Tips

  • Use official issuer URLs only; beware look-alikes.
  • Confirm fee schedules and redemption procedures before buying. (Tether)
  • Verify vaulting jurisdiction and any bar-serial lookup tools. (VNX)
  • Mind network fees, bridge risks, and exchange withdrawal rules.
  • Keep custody keys secure; whitelist issuer addresses.
  • If staking or yielding, confirm source of yield and counterparty exposure. (Kinesis)
    This article is for research/education, not financial advice.

Beginner Mistakes to Avoid

  • Treating all metal tokens as equal—redemption and custody differ widely.
  • Ignoring region and KYC limits until you try to redeem.
  • Overlooking minimums (e.g., full LBMA bars vs. gram redemptions). (help.paxos.com)
  • Confusing defunct tokens with active ones (e.g., PMGT sunset; CGT backing ceased). (perthmint.com)
  • Forgetting network/transfer fees when arbitraging across chains.
  • Using unofficial contracts on the wrong chain.

How We Picked (Methodology & Scoring)

  • Liquidity — 30%. Exchange presence, on-chain activity, practical tradability.
  • Security — 25%. Custody details, audits/attestations, LBMA alignment, redemption design.
  • Coverage — 15%. Metals (gold/silver/platinum), chains, tooling.
  • Costs — 15%. Creation/redemption/storage/transfer and transparency of schedules.
  • UX — 10%. Apps, dashboards, redemption flows.
  • Support — 5%. Docs, status pages, human support.
    We relied on official product, docs, fees, FAQ, and disclosure pages, cross-checking market datasets only for context. Last updated November 2025.

FAQs

What are gold-backed tokens?
 They are blockchain tokens that represent ownership of a specific quantity of vaulted, insured gold, typically with published fees and, in some cases, physical redemption options.

Are gold-backed tokens safer than stablecoins?
 They can diversify away from fiat risk, but introduce custody and redemption dependencies. Safety depends on the issuer’s vaulting, audits, legal structure, and your ability to redeem.

What fees should I expect?
 Common fees include creation/redemption, possible storage, transfer, and network fees. Examples: XAUt lists 0.25% create/redeem; Paxos publishes creation/destruction fees and notes no storage fee currently. Always check the live schedules. (Tether)

Can I redeem tokens for a real gold bar?
 Some issuers support bar redemption with minimum sizes and location constraints (e.g., LBMA bar logistics in London for PAXG). Others support gram-level redemption via partners. (help.paxos.com)

Which chains are supported?
 Varies: PAXG (Ethereum), XAUt (Ethereum/TRON), VNX (Ethereum/Polygon/Q/Solana), Aurus (multi-chain), CGO (XDC), Kinesis (native + exchange listings). (paxos.com)

Are there discontinued tokens I should avoid?
 Yes. PMGT has been discontinued; CACHE Gold (CGT) ceased backing as of Sept 30, 2025. Verify project status before buying. (perthmint.com)


Conclusion + Related Reads

Choose PAXG for bar-linked redemption and strong disclosures, XAUt for simple fees and brand reach, or Kinesis if you want to spend metals and earn fee-share yields. For EEA vaulting with allocation lookup, VNX is compelling; for gram-based DeFi exposure, Aurus is versatile.

Related Reads:

Recent Posts

No Item Found
Research

How to Use x402 with Token Metrics: Composer Walkthrough + Copy-Paste Axios/HTTPX Clients

Token Metrics Team
9 min read

What You Will Learn — Two-Paragraph Opener

This tutorial shows you how to use x402 with Token Metrics in two ways. First, we will walk through x402 Composer, where you can run Token Metrics agents, ask questions, and see pay-per-request tool calls stream into a live Feed with zero code. Second, we will give you copy-paste Axios and HTTPX clients that handle the full x402 flow (402 challenge, wallet payment, automatic retry) so you can integrate Token Metrics into your own apps.

Whether you are exploring x402 for the first time or building production agent workflows, this guide has you covered. By the end, you will understand how x402 payments work under the hood and have working code you can ship today. Let's start with the no-code option in Composer.

Start using Token Metrics X402 integration here. https://www.x402scan.com/server/244415a1-d172-4867-ac30-6af563fd4d25 

Part 1: Try x402 + Token Metrics in Composer (No Code Required)

x402 Composer is a playground for AI agents that pay per tool call. You can test Token Metrics endpoints, see live payment settlements, and understand the x402 flow before writing any code.

What Is Composer?

Composer is x402scan's hosted environment for building and using AI agents that pay for external resources via x402. It provides a chat interface, an agent directory, and a real-time Feed showing every tool call and payment across the ecosystem. Token Metrics endpoints are available as tools that agents can call on demand.

Explore Composer: https://x402scan.com/composer

Step-by-Step Walkthrough

Follow these steps to run a Token Metrics query and watch the payment happen in real time.

  1. Open the Composer agents directory: Go to https://x402scan.com/composer/agents and browse available agents. Look for agents tagged with "Token Metrics" or "crypto analytics." Or check our our integration here. https://www.x402scan.com/server/244415a1-d172-4867-ac30-6af563fd4d25 
  2. Select an agent: Click into an agent that uses Token Metrics endpoints (for example, a trading signals agent or market intelligence agent). You will see the agent's description, configured tools, and recent activity.
  3. Click "Use Agent": This opens a chat interface where you can run prompts against the agent's configured tools.
  4. Run a query: Type a question that requires calling a Token Metrics endpoint, for example "Give me the latest TM Grade for Ethereum" or "What are the top 5 moonshot tokens right now?" and hit send.
  5. Watch the Feed: As the agent processes your request, it will call the relevant Token Metrics endpoint. Open the Composer Feed (https://x402scan.com/composer/feed) in a new tab to see the tool call appear in real time with payment details (USDC or TMAI amount, timestamp, status).


Composer agents directory: Composer Agents page: Each agent shows tool stack, messages, and recent activity.


Individual agent page: Agent detail page: View tools, description, and click "Use Agent" to start.

[INSERT SCREENSHOT: Chat interface]

Chat interface: Chat UI: Ask a question like "What are the top trading signals for BTC today?"

[INSERT SCREENSHOT: Composer Feed]

Composer Feed: Live Feed: Each tool call shows the endpoint, payment token, amount, and settlement status.

That is the x402 flow in action. The agent's wallet paid for the API call automatically, the server verified payment, and the data came back. No API keys, no monthly bills, just pay-per-use access.

Key Observations from Composer

  • Tool calls show the exact endpoint called (like /v2/tm-grade or /v2/moonshot-tokens)
  • Payments display in USDC or TMAI with the per-call cost
  • The Feed updates in real time, you can see other agents making calls across the ecosystem
  • You can trace each call back to the agent and message that triggered it
  • This is how agentic commerce works: agents autonomously pay for resources as needed

Part 2: Build Your Own x402 Client (Axios + HTTPX)

Now that you have seen x402 in action, let's build your own client that can call Token Metrics endpoints with automatic payment handling.

How x402 Works (Quick Refresher)

When you make a request with the x-coinbase-402 header, the Token Metrics API returns a 402 Payment Required response with payment instructions (recipient address, amount, chain). Your x402 client reads this challenge, signs a payment transaction with your wallet, submits it to the blockchain, and then retries the original request with proof of payment. The server verifies the settlement and returns the data. The x402-axios and x402 Python libraries handle this flow automatically.

Prerequisites

  • A wallet with a private key (use a testnet wallet for development on Base Sepolia, or a mainnet wallet for production on Base)
  • USDC or TMAI in your wallet (testnet USDC for testing, mainnet tokens for production)
  • Node.js 18+ and npm (for Axios example) or Python 3.9+ (for HTTPX example)
  • Basic familiarity with async/await patterns

Recommended Token Metrics Endpoints for x402

These endpoints are commonly used by agents and developers building on x402. All are pay-per-call with transparent pricing.

Full endpoint list and docs: https://developers.tokenmetrics.com 

Common Errors and How to Fix Them

Here are the most common issues developers encounter with x402 and their solutions.

Error: Payment Failed (402 Still Returned After Retry)

This usually means your wallet does not have enough USDC or TMAI to cover the call, or the payment transaction failed on-chain.

  • Check your wallet balance on Base (use a block explorer or your wallet app)
  • Make sure you are on the correct network (Base mainnet for production, Base Sepolia for testnet)
  • Verify your private key has permission to spend the token (no allowance issues for most x402 flows, but check if using a smart contract wallet)
  • Try a smaller request or switch to a cheaper endpoint to test

Error: Network Timeout

x402 requests take longer than standard API calls because they include a payment transaction. If you see timeouts, increase your client timeout.

  • Set timeout to at least 30 seconds (30000ms in Axios, 30.0 in HTTPX)
  • Check your RPC endpoint is responsive (viem/eth-account uses public RPCs by default, which can be slow)
  • Consider using a dedicated RPC provider (Alchemy, Infura, QuickNode) for faster settlement

Error: 429 Rate Limit Exceeded

Even with pay-per-call, Token Metrics enforces rate limits to prevent abuse. If you hit a 429, back off and retry.

  • Implement exponential backoff (wait 1s, 2s, 4s, etc. between retries)
  • Spread requests over time instead of bursting
  • For high-volume use cases, contact Token Metrics to discuss rate limit increases

Error: Invalid Header or Missing x-coinbase-402

If you forget the x-coinbase-402: true header, the server will treat your request as a standard API call and may return a 401 Unauthorized if no API key is present.

  • Always include x-coinbase-402: true in headers for x402 requests
  • Do not send x-api-key when using x402 (the header is mutually exclusive)
  • Double-check header spelling (it is x-coinbase-402, not x-402 or x-coinbase-payment)

Production Tips

  • Use environment variables for private keys, never hardcode them
  • Set reasonable max_payment limits to avoid overspending (especially with TMAI)
  • Log payment transactions for accounting and debugging
  • Monitor your wallet balance and set up alerts for low funds
  • Test thoroughly on Base Sepolia testnet before going to mainnet
  • Use TMAI for production to get the 10% discount on every call
  • Cache responses when possible to reduce redundant paid calls
  • Implement retry logic with exponential backoff for transient errors

Why This Matters for Agents

Traditional APIs force agents to carry API keys, which creates security risks and requires human intervention for key rotation and billing. With x402, agents can pay for themselves using wallet funds, making them truly autonomous. This unlocks agentic commerce where AI systems compose services on the fly, paying only for what they need without upfront subscriptions or complex auth flows.

For Token Metrics specifically, x402 means agents can pull real-time crypto intelligence (signals, grades, predictions, research) as part of their decision loops. They can chain our endpoints with other x402-enabled tools like Heurist Mesh (on-chain data), Tavily (web search), and Firecrawl (content extraction) to build sophisticated, multi-source analysis workflows. It is HTTP-native payments meeting real-world agent use cases.

FAQs

Can I use the same wallet for multiple agents?

Yes. Each agent (or client instance) can use the same wallet, but be aware of nonce management if making concurrent requests. The x402 libraries handle this automatically.

Do I need to approve token spending before using x402?

No. The x402 payment flow uses direct transfers, not approvals. Your wallet just needs sufficient balance.

Can I see my payment history?

Yes. Check x402scan (https://x402scan.com/composer/feed) for a live feed of all x402 transactions, or view your wallet's transaction history on a Base block explorer.

What if I want to use a different payment token?

Currently x402 with Token Metrics supports USDC and TMAI on Base. To request support for additional tokens, contact Token Metrics.

How do I switch from testnet to mainnet?

Change your viem chain from baseSepolia to base (in Node.js) or update your RPC URL (in Python). Make sure your wallet has mainnet USDC or TMAI.

Can I use x402 in browser-based apps?

Yes, but you will need a browser wallet extension (like MetaMask or Coinbase Wallet) and a frontend-compatible x402 library. The current x402-axios and x402-python libraries are designed for server-side or Node.js environments.

Next Steps

Disclosure

Educational and informational purposes only. x402 involves crypto payments on public blockchains. Understand the risks, secure your private keys, and test thoroughly before production use. Token Metrics does not provide financial advice.

Quick Links

About Token Metrics

Token Metrics provides powerful crypto analytics, signals, and AI-driven tools to help you make smarter trading and investment decisions. Start exploring Token Metrics ratings and APIs today for data-driven success.

Research

Our x402 Integration Is Live: Pay-Per-Call Access to Token Metrics—No API Key Required

Token Metrics Team
7 min read

Developers are already shipping with x402 at scale: 450,000+ weekly transactions, 700+ projects. This momentum is why our Token Metrics x402 integration matters for agents and apps that need real crypto intelligence on demand. You can now pay per API call using HTTP 402 and the x-coinbase-402 header, no API key required.

   _ 

Summary: Pay per API call to Token Metrics with x402 on Base using USDC or TMAI, set x-coinbase-402: true, and get instant access to trading signals, grades, and AI reports.

Check out the x402 ecosystem on Coingecko.


What You Get

Token Metrics now supports x402, the HTTP-native payment protocol from Coinbase. Users can call any public endpoint by paying per request with a wallet, eliminating API key management and upfront subscriptions. This makes Token Metrics data instantly accessible to AI agents, researchers, and developers who want on-demand crypto intelligence.

x402 enables truly flexible access where you pay only for what you use, with transparent per-call pricing in USDC or TMAI. The integration is live now across all Token Metrics public endpoints, from trading signals to AI reports. Here's everything you need to start calling Token Metrics with x402 today.

Quick Start

Get started with x402 + Token Metrics in three steps.

  1. Create a wallet client: Follow the x402 Quickstart for Buyers to set up a wallet client (Node.js with viem or Python with eth-account). Link: https://docs.cdp.coinbase.com/x402/docs/quickstart-buyers
  2. Set required headers: Add x-coinbase-402: true to any Token Metrics request. Optionally set x-payment-token: tmai for a 10% discount (defaults to usdc). Do not send x-api-key when using x402.
  3. Call any endpoint: Make a request to https://api.tokenmetrics.com/v2/[endpoint] with your wallet client. Payment happens automatically via x402 settlement.

That is it. Your wallet pays per call, and you get instant access to Token Metrics data with no subscription overhead.

Required Headers


Endpoint Pricing

Transparent per-call pricing across all Token Metrics public endpoints. Pay in USDC or get 10% off with TMAI.


All prices are per single call. Paying with TMAI automatically applies a 10% discount.

Try It on x402 Composer

If you want to see x402 + Token Metrics in action without writing code, head to x402 Composer. Composer is x402scan's playground for AI agents that pay per tool call. You can open a Token Metrics agent, chat with it, and watch real tool calls and USDC/TMAI settlements stream into the live Feed.

Composer surfaces active agents using Token Metrics endpoints like trading signals, price predictions, and AI reports. It is a great way to explore what is possible before you build your own integration. Link: https://x402scan.com/composer

Why x402 Changes the Game

Traditional API access requires upfront subscriptions, fixed rate limits, and key management overhead. x402 flips that model by letting you pay per call with a crypto wallet, with no API keys or monthly commitments. This is especially powerful for AI agents, which need flexible, on-demand access to external data without human intervention.

For Token Metrics, x402 unlocks agentic commerce where agents can autonomously pull crypto intelligence, pay only for what they use, and compose our endpoints with other x402-enabled tools like Heurist Mesh, Tavily, and Firecrawl. It is HTTP-native payments meeting real-world agent workflows.

What is x402?

x402 is an open-source HTTP-native payment protocol developed by Coinbase. It uses the HTTP 402 status code (Payment Required) to enable pay-per-request access to APIs and services. When you make a request with the x-coinbase-402 header, the server returns a payment challenge, your wallet signs and submits payment, and the server fulfills the request once settlement is verified.

The protocol runs on Base and Solana, with USDC and TMAI as the primary payment tokens. x402 is designed for composability, agents can chain multiple paid calls across different providers in a single workflow, paying each service directly without intermediaries. Learn more at the x402 Quickstart for Buyers: https://docs.cdp.coinbase.com/x402/docs/quickstart-buyers

FAQs

Do I need an API key to use x402 with Token Metrics?

No. When you set x-coinbase-402: true, your wallet signature replaces API key authentication. Do not send x-api-key in your requests.

Can I use x402 with a free trial or test wallet?

Yes, but you will need testnet USDC or TMAI on Base Sepolia (testnet) for development. Production calls require mainnet tokens.

How do I see my payment history?

Check x402scan for transaction logs and tool call history. Your wallet will also show outgoing USDC/TMAI transactions. Visit https://www.x402scan.com.

What happens if my wallet balance is too low?

The x402 client will return a payment failure before making the API call. Top up your wallet and retry.

Can I use x402 in production apps?

Yes. x402 is live on Base mainnet. Set appropriate spend limits and handle payment errors gracefully in your code.

Next Steps

Disclosure

Educational and informational purposes only. x402 involves crypto payments on public blockchains. Understand the risks, manage your wallet security, and test thoroughly before production use. Token Metrics does not provide financial advice.

Powered by Token Metrics

Your AI-powered crypto research experience is made possible by Token Metrics. Discover data-driven insights and advanced analytics on your favorite coins and tokens.

Research

Uniswap Price Prediction 2027: $13.50-$43 Target Analysis

Token Metrics Team
8 min read

Uniswap Price Prediction: Market Context for UNI in the 2027 Case

DeFi protocols are maturing beyond early ponzi dynamics toward sustainable revenue models. Uniswap operates in this evolving landscape where real yield and proven product market fit increasingly drive valuations rather than speculation alone. Growing regulatory pressure on centralized platforms creates tailwinds for decentralized alternatives.

The price prediction scenario bands below reflect how UNI might perform across different total crypto market cap environments. Each tier represents a distinct liquidity regime, from bear conditions with muted DeFi activity to moon price prediction scenarios where decentralized infrastructure captures significant value from traditional finance.


Disclosure

Educational purposes only, not financial advice. Crypto is volatile, do your own research and manage risk.

How to read this price prediction:

Each band blends cycle analogues and market cap share math with TA guardrails. Base assumes steady adoption and neutral or positive macro. Moon layers in a liquidity boom. Bear assumes muted flows and tighter liquidity.

TM Agent baseline:

Token Metrics TM Grade is 69%, Buy, and the trading signal is bullish. Price prediction scenarios cluster roughly between $6.50 and $28, with a base case price target near $13.50.

Live details: Uniswap Token Details 

Affiliate Disclosure: We may earn a commission from qualifying purchases made via this link, at no extra cost to you.

Key Takeaways

  • Scenario driven, outcomes hinge on total crypto market cap, higher liquidity and adoption lift the bands.
  • Fundamentals: Fundamental Grade 79.88% (Community 77%, Tokenomics 100%, Exchange 100%, VC 66%, DeFi Scanner 62%).
  • Technology: Technology Grade 86.88% (Activity 72%, Repository 72%, Collaboration 100%, Security N/A, DeFi Scanner 62%).
  • TM Agent gist: bullish bias with a base case near $13.50 and a broad range between $6.50 and $28.
  • Education only, not financial advice.

Uniswap Price Prediction: Scenario Analysis

Token Metrics price prediction scenarios span four market cap tiers, each representing different levels of crypto market maturity and liquidity:

8T Market Cap Price Prediction:

At an 8 trillion dollar total crypto market cap, UNI price prediction projects to $8.94 in bear conditions, $10.31 in the base case, and $11.68 in bullish scenarios.

16T Market Cap Price Prediction:

Doubling the market to 16 trillion expands the price prediction range to $14.17 (bear), $18.29 (base), and $22.41 (moon).

23T Market Cap Price Prediction:

At 23 trillion, the price forecast scenarios show $19.41, $26.27, and $33.14 respectively.

31T Market Cap Price Prediction:

In the maximum liquidity scenario of 31 trillion, UNI price prediction could reach $24.64 (bear), $34.25 (base), or $43.86 (moon).

Each tier assumes progressively stronger market conditions, with the base case price prediction reflecting steady growth and the moon case requiring sustained bull market dynamics.

Why Consider the Indices with Top-100 Exposure

Uniswap represents one opportunity among hundreds in crypto markets. Token Metrics Indices bundle UNI with top one hundred assets for systematic exposure to the strongest projects. Single tokens face idiosyncratic risks that diversified baskets mitigate.

Historical index performance demonstrates the value of systematic diversification versus concentrated positions.

Join the early access list

What Is Uniswap?

Uniswap is a decentralized exchange protocol built on Ethereum that enables token swaps using automated market makers instead of order books. It aims to provide open access to liquidity for traders, developers, and applications through transparent smart contracts.

UNI is the governance token that lets holders vote on protocol upgrades and parameters, aligning incentives across the ecosystem. The protocol is a market leader in decentralized exchange activity with broad integration across wallets and DeFi apps.

Token Metrics AI Analysis for Price Prediction

Token Metrics AI provides comprehensive context on Uniswap's positioning and challenges that inform our price prediction models.

Vision: Uniswap aims to create a fully decentralized and permissionless financial market where anyone can trade or provide liquidity without relying on centralized intermediaries. Its vision emphasizes open access, censorship resistance, and community driven governance.

Problem: Traditional exchanges require trusted intermediaries to match buyers and sellers, creating barriers to access, custody risks, and potential for censorship. In DeFi, the lack of efficient, trustless mechanisms for token swaps limits interoperability and liquidity across applications.

Solution: Uniswap solves this by using smart contracts to create liquidity pools funded by users who earn trading fees in return. The protocol automatically prices assets using a constant product formula, enabling seamless swaps. UNI token holders can participate in governance, influencing parameters like fee structures and protocol upgrades.

Market Analysis: Uniswap operates within the broader DeFi and Ethereum ecosystems, competing with other decentralized exchanges like SushiSwap, Curve, and Balancer. It is a market leader in terms of cumulative trading volume and liquidity depth. Adoption is strengthened by strong developer activity, widespread integration across wallets and dApps, and a large user base.

Fundamental and Technology Snapshot from Token Metrics

Fundamental Grade: 79.88% (Community 77%, Tokenomics 100%, Exchange 100%, VC 66%, DeFi Scanner 62%).


Technology Grade: 86.88% (Activity 72%, Repository 72%, Collaboration 100%, Security N/A, DeFi Scanner 62%).

Catalysts That Skew Bullish for Price Prediction

  • Institutional and retail access expands with ETFs, listings, and integrations
  • Macro tailwinds from lower real rates and improving liquidity
  • Product or roadmap milestones such as upgrades, scaling, or partnerships
  • These factors could push UNI toward higher price prediction targets

Risks That Skew Bearish for Price Prediction

  • Macro risk off from tightening or liquidity shocks
  • Regulatory actions or infrastructure outages
  • Competitive displacement across DEXs or changes to validator and liquidity incentives
  • These factors could push UNI toward lower price prediction scenarios

FAQs: Uniswap Price Prediction

Will UNI hit $20 by 2027 according to price predictions?

The 16T price prediction scenario shows UNI at $18.29 in the base case, which does not exceed $20. However, the 23T base case shows $26.27, surpassing the $20 target. Price prediction outcome depends on total crypto market cap growth and Uniswap maintaining market share. Not financial advice.

Can UNI 10x from current levels based on price predictions?

At current price of $6.30, a 10x would reach $63.00. This falls within none of the listed price prediction scenarios, which top out at $43.86 in the 31T moon case. Bear in mind that 10x returns require substantial market cap expansion beyond our modeled scenarios. Not financial advice.

What price could UNI reach in the moon case price prediction?

Moon case price predictions range from $11.68 at 8T to $43.86 at 31T total crypto market cap. These price prediction scenarios assume maximum liquidity expansion and strong Uniswap adoption. Not financial advice.

What is the 2027 Uniswap price prediction?

Based on Token Metrics analysis, the 2027 price prediction for Uniswap centers around $13.50 in the base case under current market conditions, with a range between $6.50 and $28 depending on market scenarios. Bullish price predictions with strong market conditions range from $10.31 to $43.86 across different total crypto market cap environments.

What drives UNI price predictions?

UNI price predictions are driven by DEX trading volume, liquidity provider activity, governance participation, protocol fee revenue, and competition from other decentralized exchanges. The strong technology grade (86.88%) and bullish signal support upward price potential. DeFi adoption rates and regulatory clarity around decentralized exchanges remain primary drivers for reaching upper price prediction targets.

Can UNI reach $30-$40 by 2027?

According to our price prediction models, UNI could reach $30-$40 in the 23T moon case ($33.14) and in the 31T scenarios where the base case is $34.25 and the moon case is $43.86. These price prediction outcomes require significant crypto market expansion and Uniswap maintaining DEX market leadership. Not financial advice.


Next Steps

Disclosure

Educational purposes only, not financial advice. Crypto is volatile, do your own research and manage risk.

Why Use Token Metrics for Uniswap Research?

  • Get on-chain ratings, AI-powered scenario projections, backtested indices, and exclusive insights for Uniswap and other top-100 crypto assets.
  • Spot emerging trends before the crowd and manage risk with our transparent AI grades.
  • Token Metrics helps you save time, avoid hidden pitfalls, and discover data-driven opportunities in DeFi.
Research

Bittensor Price Prediction 2025-2027 | TAO Forecast & Analysis

Token Metrics Team
7 min read

Understanding Bittensor's Speculative Nature

Bittensor operates as a community-driven token where price action stems primarily from social sentiment, attention cycles, and speculative trading rather than fundamental value drivers. TAO exhibits extreme volatility with no defensive characteristics or revenue-generating mechanisms typical of utility tokens. Token Metrics price prediction scenarios below provide technical forecasts across different market cap environments, though meme and speculative tokens correlate more strongly with viral trends and community engagement than systematic market cap models. Positions in TAO should be sized as high-risk speculative bets with potential for total loss.


Disclosure
Educational purposes only, not financial advice. Crypto is volatile, do your own research and manage risk.

How to read our price prediction methodology: Each band blends cycle analogues and market-cap share math with TA guardrails. Base assumes steady adoption and neutral or positive macro. Moon layers in a liquidity boom. Bear assumes muted flows and tighter liquidity. For speculative tokens, actual price prediction outcomes depend heavily on social trends and community momentum beyond what market cap models capture.

Bittensor (TAO) Price Prediction: TM Agent Baseline

Token Metrics long term price prediction view for Bittensor, cashtag $TAO. Lead metric first, Token Metrics TM Grade is 62%, Hold, and the trading signal is bullish, indicating modest project fundamentals and short-term upward momentum. Market context, Bitcoin direction and appetite for AI and research-oriented crypto projects determine capital flows into niche tokens like $TAO, so broader risk-on conditions would help sustained gains.

Concise 12-month price prediction numeric view: Token Metrics scenarios cluster roughly between $0.45 and $2.20, with a base case near $1.05, reflecting current network usage, developer activity, and token supply dynamics. Implication, if AI crypto interest and on-chain usage grow materially $TAO could approach the upper bound, while in a risk-off market or if network adoption stalls it would likely move toward the lower bound.

  • 16T: At 16 trillion, the range is $5,539.08, $6,710.41, and $7,881.74.

Token Details 

Key Takeaways

  • Highly speculative asset driven by sentiment and attention rather than fundamentals.
  • Scenario driven price predictions, outcomes hinge on total crypto market cap and viral momentum.
  • Extreme volatility characteristic - TAO can experience double-digit percentage moves daily.
  • TM Agent gist: conditions and usage growth could expand the upper range, risk-off or weak adoption could compress outcomes.
  • Entertainment risk only, not financial advice.

Bittensor Price Prediction: Scenario Analysis

Token Metrics price prediction scenarios provide technical price bands across market cap tiers:

  • 8T Price Prediction: At 8 trillion total crypto market cap, TAO projects to $2,129.86 (bear), $2,520.30 (base), and $2,910.75 (moon).
  • 16T Price Prediction: At 16 trillion, the range is $5,539.08, $6,710.41, and $7,881.74.
  • 23T Price Prediction: At 23 trillion, scenarios show $8,948.30, $10,900.52, and $12,852.74.
  • 31T Price Prediction: At 31 trillion, projections reach $12,357.53, $15,090.63, or $17,823.73.

These technical price prediction ranges assume speculative tokens maintain market cap share proportional to overall crypto growth. Actual outcomes for speculative tokens typically exhibit higher variance and stronger correlation to social trends than these models predict.

What Is Bittensor?

Bittensor is a decentralized network focused on machine learning markets, where participants contribute and consume AI services. Unlike utility tokens with broad real-world use cases, TAO operates in a niche AI context and often trades as a speculative community symbol.

TAO is the network token used for incentives and participation. Market performance depends heavily on broader interest in AI‑related crypto themes and community engagement around the project.

Risks That Skew Bearish on TAO Price Predictions

  • Extreme volatility from pure sentiment-driven price action with no fundamental support.
  • Attention cycles shift rapidly, leaving early viral tokens abandoned as new memes emerge.
  • Liquidity can evaporate quickly during downturns, creating severe slippage and exit difficulty.
  • Regulatory scrutiny may target speculative tokens as securities or gambling instruments.
  • Macro risk-off environments hit speculative assets hardest, with meme coins showing largest drawdowns.
  • Community fragmentation or developer abandonment can eliminate remaining narrative support.

FAQs About Bittensor Price Prediction

Will TAO 10x from here?

Yes, at a current price of $427.67, a 10x reaches $4,276.70. This level appears in the 16T bear and above price prediction scenarios. Meme and speculative tokens can 10x rapidly during viral moments but can also lose 90%+ just as quickly. Position sizing for potential total loss is critical. Not financial advice.

What are the biggest risks to TAO price predictions?

Primary risks include attention shifting to newer narratives, community fragmentation, developer abandonment, regulatory crackdowns, and liquidity collapse during downturns. Unlike utility tokens with defensive characteristics, TAO has no fundamental floor. Price can approach zero if community interest disappears. Total loss is a realistic outcome.


Next Steps

Disclosure

Educational purposes only, not financial advice. TAO is a highly speculative asset with extreme volatility and high risk of total loss. Speculative tokens operate as entertainment and gambling instruments rather than investments. Only allocate capital you can afford to lose entirely. Do your own research and manage risk appropriately.

About Token Metrics

Token Metrics is a cutting-edge crypto analytics and research platform that offers ratings, price predictions, and unique AI-driven insights for investors.

Research

Polkadot Price Prediction 2027 | DOT Forecast & Scenarios

Token Metrics Team
7 min read

Understanding Polkadot's 2027 Potential

The Layer 1 competitive landscape is consolidating as markets reward specialization over undifferentiated "Ethereum killers". Polkadot positions itself in a multi-chain world through shared security and parachain interoperability. Infrastructure maturity around custody and bridges makes alternate L1s more accessible into 2026.

The price prediction scenario projections below map different market share outcomes for DOT across varying total crypto market sizes. Base cases assume Polkadot maintains current ecosystem momentum, while moon scenarios factor in accelerated adoption, and bear cases reflect increased competitive pressure.


Disclosure
Educational purposes only, not financial advice. Crypto is volatile, do your own research and manage risk.

How to read our price prediction methodology:
Each band blends cycle analogues and market-cap share math with TA guardrails. Base assumes steady adoption and neutral or positive macro. Moon layers in a liquidity boom. Bear assumes muted flows and tighter liquidity.

Polkadot (DOT) Price Prediction: TM Agent Baseline

Token Metrics long term price prediction view for Polkadot, cashtag $DOT. Lead metric first, Token Metrics TM Grade is 71%, Buy, and the trading signal is bullish, which indicates above-average project quality, and positive short-term momentum. Market context, Bitcoin's trend and institutional flows into layer-1 ecosystems remain the dominant macro drivers, so $DOT's performance will track risk-on cycles and parachain adoption.

Concise 12-month price prediction numeric view: Token Metrics scenarios cluster roughly between $4.50 and $22, with a base case near $11, reflecting continued parachain activity, cross-chain integrations, and ecosystem growth. Implication, if the broader market enters a sustained bull phase and Polkadot adoption accelerates, $DOT could test the upper bound. In a prolonged risk-off environment or slower parachain uptake, it would likely drift toward the lower bound.

Polkadot Token Details 

Buy DOT on Gemini

Affiliate Disclosure: We may earn a commission from qualifying purchases made via this link, at no extra cost to you.

Key Takeaways

  • Scenario driven price predictions, outcomes hinge on total crypto market cap, higher liquidity and adoption lift the bands.
  • TM Agent gist: range $4.50 to $22 with a base near $11, upside requires adoption and liquidity, downside ties to risk-off.
  • Education only, not financial advice.

Polkadot Price Prediction: Scenario Analysis

Token Metrics price prediction scenarios span four market cap tiers, each representing different levels of crypto market maturity and liquidity:

  • 8T Price Prediction: At an eight trillion dollar total crypto market cap, DOT projects to $4.31 in bear conditions, $4.85 in the base case, and $5.39 in bullish scenarios.
  • 16T Price Prediction: Doubling the market to sixteen trillion expands the range to $6.82 (bear), $8.44 (base), and $10.07 (moon).
  • 23T Price Prediction: At twenty-three trillion, the scenarios show $9.33, $12.04, and $14.75 respectively.
  • 31T Price Prediction: In the maximum liquidity scenario of thirty-one trillion, DOT could reach $11.84 (bear), $15.63 (base), or $19.43 (moon).

Each tier assumes progressively stronger market conditions, with the base case reflecting steady growth and the moon case requiring sustained bull market dynamics.

Why Consider the Indices with Top-100 Exposure

Polkadot represents one opportunity among hundreds in crypto markets. Token Metrics Indices bundle DOT with top one hundred assets for systematic exposure to the strongest projects. Single tokens face idiosyncratic risks that diversified baskets mitigate.

Historical index performance demonstrates the value of systematic diversification versus concentrated positions. Join the early access list

Join the early access list

What Is Polkadot?

Polkadot is a network designed to connect specialized blockchains, called parachains, to a central Relay Chain for shared security and interoperability. Its architecture aims to enable cross-chain messaging and upgrades without hard forks.

DOT is the native token, used for staking to secure the network, on-chain governance, and bonding to add new parachains. Developers and users interact across parachains for use cases spanning DeFi, infrastructure, and cross-chain applications.

Token Metrics AI Analysis

Token Metrics AI provides comprehensive context on Polkadot's positioning and challenges.

Vision: Polkadot's vision is to create a decentralized web where independent blockchains can operate securely while communicating and sharing data across networks. It aims to enable a fully interoperable and scalable ecosystem that supports innovation in decentralized technologies.

Problem: The blockchain space faces fragmentation, with networks operating in isolation, limiting data and value transfer. This siloed structure hampers scalability, security, and user experience. Polkadot addresses the need for cross-chain communication and shared security, allowing blockchains to benefit from collective strength without sacrificing autonomy.

Solution: Polkadot uses a relay chain to coordinate a network of parachains, each with specialized functionality. It employs a nominated proof-of-stake (NPoS) consensus mechanism to secure the network and enable governance. Parachains lease slots via auctions, allowing projects to build custom blockchains with shared security and interoperability. The system supports cross-chain message passing, enabling data and asset transfers between different blockchains.

Market Analysis: Polkadot operates in the layer-0 and interoperability segment, competing with platforms like Cosmos and emerging multi-chain ecosystems. It differentiates itself through shared security, on-chain governance, and a robust parachain model. Adoption is driven by developer interest, parachain diversity, and integration with DeFi, NFTs, and enterprise solutions. Market conditions for Polkadot are influenced by broader crypto trends, regulatory developments, and execution of its technological roadmap. While it ranks among major smart contract platforms, it faces strong competition from Ethereum and high-throughput chains like Solana. Price and adoption depend on network usage, ecosystem growth, and macroeconomic factors in the crypto market.

Catalysts That Skew Bullish for DOT Price Predictions

  • Institutional and retail access expands with ETFs, listings, and integrations.
  • Macro tailwinds from lower real rates and improving liquidity.
  • Product or roadmap milestones such as upgrades, scaling, or partnerships.

Risks That Skew Bearish on DOT Price Predictions

  • Macro risk-off from tightening or liquidity shocks.
  • Regulatory actions or infrastructure outages.
  • Concentration or validator economics and competitive displacement.

FAQs About Polkadot Price Prediction

Will DOT hit $15 by 2027?

The 31T base case price prediction shows DOT at $15.63, which exceeds $15. The 23T moon case at $14.75 does not reach $15. Outcome depends on total crypto market cap growth and Polkadot maintaining market share. Not financial advice.

Can DOT 10x from current levels?

At current price of $3.10, a 10x would reach $31.0. None of the price prediction scenarios, with a high of $19.43 in the 31T moon case, reaches that level by 2027. 10x returns would require substantially greater market cap expansion. Not financial advice.

What price could DOT reach in the moon case?

Moon case price predictions range from $5.39 at 8T to $19.43 at 31T. These scenarios assume maximum liquidity expansion and strong Polkadot adoption. Not financial advice.

Next Steps

Disclosure

Educational purposes only, not financial advice. Crypto is volatile, do your own research and manage risk.

Why Use Token Metrics for Polkadot Price Prediction Investing?

Actionable AI-driven Ratings: Access live Token Metrics grades and signals for Polkadot and hundreds of crypto assets.

Scenario Forecasting: Visualize DOT upside and downside with rigorous price prediction scenario math, not unsubstantiated hype.

Portfolio Diversification: Token Metrics Indices let you systematically diversify among top projects, mitigating single-token risk.

Start your Polkadot price prediction research with institutional-grade tools from Token Metrics.

Research

Mantle (MNT) Price Prediction 2027 | Token Metrics Analysis

Token Metrics Team
7 min read

Mantle (MNT) Price Prediction: Portfolio Context for MNT - Diversification in the 2027 Landscape

Layer 2 tokens like Mantle offer exposure to Ethereum's scaling roadmap, but with concentration risk around one specific L2's adoption trajectory. MNT performance depends heavily on Mantle winning rollup market share against competing L2s. Diversified L2 exposure or broader L1 and L2 baskets reduce the risk of backing the wrong scaling solution.

Token Metrics price prediction scenarios below project MNT ranges across market environments. These outcomes assume Mantle maintains relevance as Ethereum scales, but portfolio theory suggests hedging this bet by holding multiple L2s or allocating to Ethereum itself, which benefits from L2 success regardless of which specific rollup dominates.

Disclosure

Educational purposes only, not financial advice. Crypto is volatile, do your own research and manage risk.

How to read it: Each band blends cycle analogues and market-cap share math with TA guardrails. Base assumes steady adoption and neutral or positive macro. Moon layers in a liquidity boom. Bear assumes muted flows and tighter liquidity.

TM Agent baseline: Token Metrics long term view for Mantle, cashtag $MNT. Lead metric first, Token Metrics TM Grade is 68%, Buy, and the trading signal is bullish, indicating positive short-term momentum and above-average project quality. Concise 12-month numeric view, price prediction scenarios cluster roughly between $0.70 and $3.40, with a base case near $1.60.

Token Details 

Key Takeaways

  • Scenario driven, outcomes hinge on total crypto market cap, higher liquidity and adoption lift the bands.
  • Single-asset concentration amplifies both upside and downside versus diversified approaches.
  • Fundamentals: Fundamental Grade 81.62% (Community 72%, Tokenomics 100%, Exchange 100%, VC —, DeFi Scanner 100%).
  • Technology: Technology Grade 78.22% (Activity 64%, Repository 70%, Collaboration 71%, Security —, DeFi Scanner 100%).
  • TM Agent gist: bullish signal, 12‑month range roughly $0.70 to $3.40 with base near $1.60.
  • Education only, not financial advice.

Scenario Analysis - MNT Price Prediction Models

Token Metrics price prediction scenarios span four market cap tiers, each representing different levels of crypto market maturity and liquidity:

  • 8T: At an 8 trillion dollar total crypto market cap, MNT projects to $3.16 in bear conditions, $3.73 in the base case, and $4.30 in bullish scenarios.
  • 16T: Doubling the market to 16 trillion expands the price prediction range to $6.27 (bear), $7.99 (base), and $9.71 (moon).
  • 23T: At 23 trillion, the price prediction scenarios show $9.38, $12.25, and $15.12 respectively.
  • 31T: In the maximum liquidity scenario of 31 trillion, MNT price prediction could reach $12.49 (bear), $16.51 (base), or $20.52 (moon).

These ranges illustrate potential outcomes for concentrated MNT positions, but investors should weigh whether single-asset exposure matches their risk tolerance or whether diversified strategies better suit their objectives.

The Case for Diversified Index Exposure

Portfolio theory teaches that diversification is the only free lunch in investing. MNT concentration violates this principle by tying your crypto returns to one protocol's fate. Token Metrics Indices blend Mantle with the top one hundred tokens, providing broad exposure to crypto's growth while smoothing volatility through cross-asset diversification. This approach captures market-wide tailwinds without overweighting any single point of failure.

Systematic rebalancing within index strategies creates an additional return source that concentrated positions lack. As some tokens outperform and others lag, regular rebalancing mechanically sells winners and buys laggards, exploiting mean reversion and volatility. Single-token holders miss this rebalancing alpha and often watch concentrated gains evaporate during corrections while index strategies preserve more gains through automated profit-taking.

Beyond returns, diversified indices improve the investor experience by reducing emotional decision-making. Concentrated MNT positions subject you to severe drawdowns that trigger panic selling at bottoms. Indices smooth the ride through natural diversification, making it easier to maintain exposure through full market cycles.

Get early access

What Is Mantle?

Mantle is a blockchain project focused on scaling Ethereum via layer 2 rollup technology. The goal is to enable faster and cheaper transactions while inheriting Ethereum security. It targets scalable and efficient infrastructure for decentralized applications and financial services.

The MNT token powers network economics such as fees, incentives, or governance depending on implementation. Users interact with dApps and bridges within the ecosystem, and Mantle competes among leading Ethereum scaling solutions.

Token Metrics AI Analysis

  • Vision: Mantle aims to build a scalable, secure, and self-sustaining blockchain ecosystem that leverages decentralized governance and treasury-backed financial innovation. Its vision emphasizes capital efficiency, leveraging restaking for security, and fostering long-term sustainability through community-driven development and treasury utilization.
  • Problem: Many blockchain platforms face trade-offs between scalability, security, and capital efficiency. High transaction costs and network congestion on Ethereum, combined with fragmented liquidity and underutilized treasury assets in DAOs, create friction for developers and users. Mantle addresses the challenge of efficiently deploying capital while maintaining robust security and enabling rapid, low-cost transactions for decentralized applications.
  • Solution: Mantle implements an Ethereum Layer 2 network using optimistic rollup technology to reduce fees and increase throughput. It integrates EigenLayer for security via restaking, allowing its treasury to earn yield and contribute to network validation. The ecosystem supports native governance through its token and funds development via a large DAO-managed treasury, aiming to create a self-sustaining cycle of innovation and user incentives.
  • Market Analysis: Mantle operates in the competitive Layer 2 and modular blockchain space, competing with established networks like Arbitrum, Optimism, and emerging restaking platforms. Its differentiation lies in the integration of a large treasury with restaking, aiming to bootstrap security and ecosystem growth simultaneously. Adoption is driven by developer activity, yield opportunities, and strategic partnerships within the broader Ethereum ecosystem. Market risks include execution challenges in treasury management, regulatory scrutiny on DAO structures, and strong competition from other scaling solutions. While not a market leader like Ethereum or Bitcoin, Mantle participates in the broader narrative of modular, restaked, and treasury-driven blockchains, which have gained traction in 2024-2025.

Fundamental and Technology Snapshot from Token Metrics

  • Fundamental Grade: 81.62% (Community 72%, Tokenomics 100%, Exchange 100%, VC —, DeFi Scanner 100%).
  • Technology Grade: 78.22% (Activity 64%, Repository 70%, Collaboration 71%, Security —, DeFi Scanner 100%).

Catalysts That Skew Bullish

  • Institutional and retail access expands with ETFs, listings, and integrations.
  • Macro tailwinds from lower real rates and improving liquidity.
  • Product or roadmap milestones such as upgrades, scaling, or partnerships.

Risks That Skew Bearish

  • Macro risk-off from tightening or liquidity shocks.
  • Regulatory actions or infrastructure outages.
  • Concentration or validator economics and competitive displacement.
  • Protocol-specific execution risk and competitive pressure from alternatives.

FAQs

Can MNT reach $10?

Based on the price prediction scenarios, MNT could reach $10 in the higher tiers. The 23T tier projects $12.25 in the base case, and the 31T tier shows $12.49 (bear), $16.51 (base), and $20.52 (moon). Achieving this requires both broad market cap expansion and Mantle maintaining competitive position. Not financial advice.

What's the risk/reward profile for MNT?

Risk and reward spans from $3.16 at 8T bear to $20.52 at 31T moon. Downside risks include competitive pressure among L2s and execution challenges, while upside drivers include adoption growth and liquidity expansion. Concentrated positions amplify both tails, while diversified strategies smooth outcomes.

What gives MNT value?

MNT accrues value through network usage, fees, incentives, and governance tied to Mantle's L2 ecosystem. Demand drivers include dApp activity, bridging, and security via restaking integrations. While these fundamentals matter, diversified portfolios capture value accrual across multiple tokens rather than betting on one protocol's success.

Where can I find Mantle price predictions?

Token Metrics provides comprehensive Mantle (MNT) price predictions through scenario-based analysis spanning multiple market cap tiers. Our data-driven price prediction models incorporate fundamental grades, technology scores, and market conditions to project potential MNT price targets across bear, base, and moon scenarios.

Next Steps

Disclosure

Educational purposes only, not financial advice. Crypto is volatile, concentration amplifies risk, and diversification is a fundamental principle of prudent portfolio construction. Do your own research and manage risk appropriately.

Why Investors Choose Token Metrics

Token Metrics provides data-driven crypto ratings, on-chain grades, and scenario-based targets—empowering you to make informed investment decisions with confidence. Accelerate your research with unique AI-powered analysis and risk management tools.

Research

Toncoin Price Prediction 2027: $5-$43 Target Analysis | TON

Token Metrics Team
7 min read

Toncoin Price Prediction Framework: Market Cap Scenarios & 2027 Price Forecasts

Layer 1 tokens capture value through transaction fees, staking, and validator economics. TON uses proof-of-stake and a multi-blockchain architecture integrated with Telegram services. This Token Metrics price prediction model analyzes TON price forecasts across different total crypto market sizes, reflecting adoption and transaction demand by 2027.

Disclosure

Educational purposes only, not financial advice. This price prediction analysis is for informational purposes. Crypto is volatile, do your own research and manage risk.

How to read this price prediction:

Each band blends cycle analogues and market-cap share math with TA guardrails. Base assumes steady adoption and neutral or positive macro. Moon layers in a liquidity boom. Bear assumes muted flows and tighter liquidity. These price prediction scenarios provide a range of potential outcomes based on market conditions.

TM Agent baseline:

Token Metrics TM Grade is 74%, Buy, and the trading signal is bullish, indicating positive short-term momentum and strong overall project quality. Concise 12-month numeric price prediction view: scenarios cluster roughly between $5 and $14, with a base case price target near $9.

Live details: Token Details

Key Takeaways for TON Price Prediction

  • Scenario driven: price prediction outcomes hinge on total crypto market cap; higher liquidity and adoption lift the price targets
  • Fundamentals: Fundamental Grade 80.88% (Community 83%, Tokenomics N/A, Exchange 100%, VC 84%, DeFi Scanner 85%)
  • Technology: Technology Grade 77.11% (Activity 55%, Repository 72%, Collaboration 73%, Security N/A, DeFi Scanner 85%)
  • TM Agent gist: bullish signal, price prediction ranges cluster around $5 to $14 with a base case near $9
  • Education only, not financial advice

Toncoin Price Prediction: Scenario Analysis

8T Market Cap Price Prediction:

At an 8 trillion dollar total crypto market cap, TON price prediction projects to $4.36 in bear conditions, $6.28 in the base case, and $8.20 in bullish scenarios.

16T Market Cap Price Prediction:

At 16 trillion, the price prediction range expands to $8.54 (bear), $14.30 (base), and $20.07 (moon).

23T Market Cap Price Prediction:

The 23 trillion tier price forecast shows $12.72, $22.33, and $31.94 respectively.

31T Market Cap Price Prediction:

In the maximum liquidity scenario at 31 trillion, TON price prediction reaches $16.89 (bear), $30.35 (base), or $43.80 (moon).

What Is Toncoin?

The Open Network is a blockchain designed to support fast, low-cost transactions and a scalable ecosystem of decentralized applications. It integrates with digital services and messaging platforms to reach a broad user base, emphasizing high throughput and accessibility.

TON uses a proof-of-stake consensus mechanism with a multi-blockchain architecture. The TON token powers network activity, facilitating transactions, staking, and governance, and is integrated into Telegram-based services for user-friendly in-app payments and wallets.

Token Metrics AI Analysis for Price Prediction

Token Metrics AI provides additional context on Toncoin's technical positioning and market dynamics that inform our price prediction models.

Vision: The vision for Toncoin and The Open Network is to create a fast, secure, and scalable blockchain that enables seamless digital transactions and decentralized services, accessible to millions through integration with everyday communication tools like Telegram.

Problem: Many blockchain networks face limitations in speed, cost, and user accessibility, hindering mainstream adoption. Toncoin aims to address the friction of slow transaction times and high fees seen on older networks, while also lowering the barrier to entry for non-technical users who want to engage with decentralized applications and digital assets.

Solution: TON uses a proof-of-stake consensus mechanism with a multi-blockchain architecture to achieve high scalability and fast finality. The network supports smart contracts, decentralized storage, and domain naming, enabling a wide range of applications. Toncoin facilitates transactions, staking, and network governance, and is integrated into Telegram-based services, allowing for in-app payments and wallet functionality through user-friendly interfaces.

Market Analysis: Toncoin operates in the competitive layer-1 blockchain space, often compared to high-performance networks like Solana and Avalanche, though it differentiates itself through deep integration with Telegram's ecosystem. Its potential for mass adoption stems from access to hundreds of millions of Telegram users, which could drive network effects and utility usage. Unlike meme tokens, Toncoin's value is tied to infrastructure and real-world application rather than speculation or community hype. However, its growth depends on sustained development, regulatory clarity, and actual user engagement within Telegram. Competition from established blockchains and shifting market narratives around scalability and decentralization remain key risks. As a top-tier blockchain by ecosystem potential, Toncoin's market position is influenced more by integration milestones and user adoption than direct price dynamics.

Fundamental and Technology Snapshot from Token Metrics

  • Fundamental Grade: 80.88% (Community 83%, Tokenomics N/A, Exchange 100%, VC 84%, DeFi Scanner 85%)
  • Technology Grade: 77.11% (Activity 55%, Repository 72%, Collaboration 73%, Security N/A, DeFi Scanner 85%)

Catalysts That Skew Bullish for Price Prediction

  • Institutional and retail access expands with ETFs, listings, and integrations
  • Macro tailwinds from lower real rates and improving liquidity
  • Product or roadmap milestones such as upgrades, scaling, or partnerships
  • These factors could push TON toward higher price prediction targets

Risks That Skew Bearish for Price Prediction

  • Macro risk-off from tightening or liquidity shocks
  • Regulatory actions or infrastructure outages
  • Concentration in validator economics and competitive displacement
  • These factors could push TON toward lower price prediction scenarios

FAQs: Toncoin Price Prediction

How does TON accrue value?Value accrual mechanisms include transaction fees, validator staking rewards, and governance alignment described for TON in the documentation. As Toncoin usage grows through transactions and user activity, TON can capture network fees and staking yields while coordinating governance. Effectiveness depends on sustained adoption and network throughput, which directly impacts long-term price prediction models.

What price could TON reach in the moon case price prediction?Moon case price predictions range from $8.20 at 8T to $43.80 at 31T total crypto market cap. These price prediction scenarios require maximum market cap expansion and strong network adoption with robust liquidity conditions. Not financial advice.

What is the 2027 Toncoin price prediction?Based on Token Metrics analysis, the 2027 price prediction for Toncoin clusters between $5 and $14 in the base case, with potential for higher targets ($20-$43) in bullish scenarios if the total crypto market expands significantly.


Next Steps

Track live grades and signals: Token Details

Secure your TON with Ledger

Disclosure

Educational purposes only, not financial advice. Crypto is volatile, do your own research and manage risk.

How Token Metrics Can Help

Token Metrics combines fundamental, technical, and on-chain AI-powered analysis for actionable ratings, signals, and research. Use our data platform for scenario-based investing, backtested grades, and bespoke insights for digital asset markets.

Research

Cronos Price Prediction 2027: $0.10-$1.46 Target Analysis

Token Metrics Team
9 min read

Cronos Price Prediction: Portfolio Context for CRO in the 2027 Landscape

Layer 1 tokens like Cronos represent bets on specific blockchain architectures winning developer and user mindshare. CRO carries both systematic crypto risk and unsystematic risk from Cronos's technical roadmap execution and ecosystem growth. Multi-chain thesis suggests diversifying across several L1s rather than concentrating in one, since predicting which chains will dominate remains difficult.

The price prediction projections below show how CRO might perform under different market cap scenarios. While Cronos may have strong fundamentals, prudent portfolio construction balances L1 exposure across Ethereum, competing smart contract platforms, and Bitcoin to capture the sector without overexposure to any single chain's fate.

Disclosure

Educational purposes only, not financial advice. Crypto is volatile, do your own research and manage risk.

How to read this price prediction:

Each band blends cycle analogues and market-cap share math with TA guardrails. Base assumes steady adoption and neutral or positive macro. Moon layers in a liquidity boom. Bear assumes muted flows and tighter liquidity.

TM Agent baseline:

Token Metrics price prediction scenarios center roughly between $0.03 and $0.28, with a base case price target near $0.10, assuming steady ecosystem growth, continued cross-chain demand, and no major security incidents.

Live details: Token Details 

The Case for Diversified Index Exposure

Portfolio theory teaches that diversification is the only free lunch in investing. CRO concentration violates this principle by tying your crypto returns to one protocol's fate. Token Metrics Indices blend Cronos with the top one hundred tokens, providing broad exposure to crypto's growth while smoothing volatility through cross-asset diversification. This approach captures market-wide tailwinds without overweighting any single point of failure.

Systematic rebalancing within index strategies creates an additional return source that concentrated positions lack. As some tokens outperform and others lag, regular rebalancing mechanically sells winners and buys laggards, exploiting mean reversion and volatility. Single-token holders miss this rebalancing alpha and often watch concentrated gains evaporate during corrections while index strategies preserve more gains through automated profit-taking.

Beyond returns, diversified indices improve the investor experience by reducing emotional decision-making. Concentrated CRO positions subject you to severe drawdowns that trigger panic selling at bottoms. Indices smooth the ride through natural diversification, making it easier to maintain exposure through full market cycles.

Get early access

What Is Cronos?

Cronos is an EVM-compatible blockchain built to support decentralized applications with high throughput and low transaction costs. The network is designed to bridge the gap between crypto and traditional finance, offering interoperability with Ethereum and Cosmos ecosystems. Its focus on scalability and developer-friendly infrastructure aims to attract DeFi, NFT, and gaming projects.

CRO serves as the native utility token of the Cronos ecosystem, used for transaction fees, staking, and governance. It enables users to participate in network security, pay for smart contract execution, and access services within the Cronos DeFi ecosystem. Common usage patterns include staking for rewards, providing liquidity in DeFi protocols, and facilitating cross-chain transfers.

Key Takeaways for CRO Price Prediction

  • Scenario driven: price prediction outcomes hinge on total crypto market cap; higher liquidity and adoption lift the price targets
  • Single-asset concentration amplifies both upside and downside versus diversified approaches
  • Fundamentals: Fundamental Grade 72.71% (Community 55%, Tokenomics 60%, Exchange 100%, VC N/A, DeFi Scanner 83%)
  • Technology: Technology Grade 81.41% (Activity 64%, Repository 74%, Collaboration 82%, Security N/A, DeFi Scanner 83%)
  • TM Agent gist: Base price prediction near $0.10 amid steady growth
  • Education only, not financial advice

Cronos Price Prediction: Scenario Analysis

8T Market Cap Price Prediction:

At an 8 trillion dollar total crypto market cap, CRO price prediction projects to $0.14 in bear conditions, $0.29 in the base case, and $0.34 in bullish scenarios.

16T Market Cap Price Prediction:

Doubling the market to 16 trillion expands the price prediction range to $0.43 (bear), $0.57 (base), and $0.71 (moon).

23T Market Cap Price Prediction:

At 23 trillion, the price forecast scenarios show $0.62, $0.85, and $1.09 respectively.

31T Market Cap Price Prediction:

In the maximum liquidity scenario of 31 trillion, CRO price prediction could reach $0.81 (bear), $1.13 (base), or $1.46 (moon).


These price prediction ranges illustrate potential outcomes for concentrated CRO positions, but investors should weigh whether single-asset exposure matches their risk tolerance or whether diversified strategies better suit their objectives.

Fundamental and Technology Snapshot from Token Metrics

Fundamental Grade: 72.71% (Community 55%, Tokenomics 60%, Exchange 100%, VC N/A, DeFi Scanner 83%).


Technology Grade: 81.41% (Activity 64%, Repository 74%, Collaboration 82%, Security N/A, DeFi Scanner 83%).


Catalysts That Skew Bullish for Price Prediction

  • Institutional and retail access expands with ETFs, listings, and integrations
  • Macro tailwinds from lower real rates and improving liquidity
  • Product or roadmap milestones such as upgrades, scaling, or partnerships
  • These factors could push CRO toward higher price prediction targets

Risks That Skew Bearish for Price Prediction

  • Macro risk-off from tightening or liquidity shocks
  • Regulatory actions or infrastructure outages
  • Concentration in validator economics and competitive displacement
  • Protocol-specific execution risk and competitive pressure from alternatives
  • These factors could push CRO toward lower price prediction scenarios

FAQs: Cronos Price Prediction

Can CRO reach $1 according to price predictions?

Based on the price prediction scenarios, CRO could reach $1 in the 23T moon case where it projects to $1.09, and in the 31T scenarios where the base case is $1.13 and the moon case is $1.46. These price prediction outcomes require both broad market cap expansion and Cronos maintaining competitive position. Not financial advice.

What's the risk/reward profile for CRO price prediction?

Risk/reward in our price prediction model spans from $0.14 in the lowest bear case to $1.46 in the highest moon case. Downside risks include regulatory or infrastructure shocks and competitive displacement, while upside drivers include liquidity expansion and roadmap execution. Concentrated positions amplify both tails, while diversified strategies smooth outcomes.

What gives CRO value and impacts price predictions?

CRO accrues value through transaction fees, staking, and governance utility across the Cronos ecosystem. Demand drivers include DeFi activity, cross-chain usage, and network services. While these fundamentals matter for price predictions, diversified portfolios capture value accrual across multiple tokens rather than betting on one protocol's success.

What is the 2027 Cronos price prediction?

Based on Token Metrics analysis, the 2027 price prediction for Cronos centers around $0.10 in the base case, with potential for higher targets ($0.57-$1.13) in bullish scenarios if the total crypto market expands significantly. Moon case price predictions range up to $1.46 at maximum liquidity.

Next Steps

Disclosure
Educational purposes only, not financial advice. Crypto is volatile, concentration amplifies risk, and diversification is a fundamental principle of prudent portfolio construction. Do your own research and manage risk appropriately.

Research

Shiba Inu Price Prediction 2027: SHIB Forecast & Risk Warning

Token Metrics Team
6 min read

Shiba Inu Price Prediction: Understanding SHIB's Speculative Nature

Shiba Inu operates as a community-driven meme token where price action stems primarily from social sentiment, attention cycles, and speculative trading rather than fundamental value drivers. SHIB exhibits extreme volatility with no defensive characteristics or revenue-generating mechanisms typical of utility tokens. Token Metrics price prediction scenarios below provide technical price forecasts across different market cap environments, though meme tokens correlate more strongly with viral trends and community engagement than systematic market cap models. Positions in SHIB should be sized as high-risk speculative bets with potential for total loss.


Disclosure

Educational purposes only, not financial advice. Crypto is volatile, do your own research and manage risk.

How to read this price prediction:

Each band blends cycle analogues and market-cap share math with TA guardrails. Base assumes steady adoption and neutral or positive macro. Moon layers in a liquidity boom. Bear assumes muted flows and tighter liquidity. For meme tokens, actual price prediction outcomes depend heavily on social trends and community momentum beyond what market cap models capture.

TM Agent baseline:

Token Metrics TM Grade is 24.1%, Sell, with a bearish trading signal. The concise 12‑month numeric price prediction view centers between $0.000005 and $0.000035, with a base case price target near $0.000012.

TM Agent numeric view: scenarios center roughly between $0.000005 and $0.000035, with a base case near $0.000012.

Live details: Token Details 

Key Takeaways for SHIB Price Prediction

  • Highly speculative asset driven by sentiment and attention rather than fundamentals
  • Scenario driven: price prediction outcomes hinge on total crypto market cap and viral momentum
  • Extreme volatility characteristic - SHIB can experience double-digit percentage moves daily
  • TM Agent gist: Bearish short term, price prediction range $0.000005–$0.000035
  • Entertainment risk only, not financial advice

Shiba Inu Price Prediction: Scenario Analysis

Token Metrics price prediction scenarios provide technical price bands across market cap tiers:

8T Market Cap Price Prediction:

At 8 trillion total crypto market cap, SHIB price prediction projects to $0.041998 (bear), $0.042366 (base), and $0.042734 (moon).

16T Market Cap Price Prediction:

At 16 trillion total crypto market cap, SHIB price forecast projects to $0.043973 (bear), $0.045077 (base), and $0.046182 (moon).

23T Market Cap Price Prediction:

At 23 trillion total crypto market cap, SHIB price prediction projects to $0.045948 (bear), $0.047789 (base), and $0.049629 (moon).

  31T Market Cap Price Prediction:

At 31 trillion total crypto market cap, SHIB price prediction projects to $0.047923 (bear), $0.051050 (base), and $0.051307 (moon).

 These technical price prediction ranges assume meme tokens maintain market cap share proportional to overall crypto growth. Actual outcomes for speculative tokens typically exhibit higher variance and stronger correlation to social trends than these price prediction models predict.

What Is Shiba Inu?

Shiba Inu is a meme-born crypto project that centers on community and speculative culture. Unlike utility tokens with specific use cases, SHIB operates primarily as a speculative asset and community symbol. The project focuses on community engagement and entertainment value.

SHIB has demonstrated viral moments and community loyalty within the broader meme token category. The token trades on community sentiment and attention cycles more than fundamentals. Market performance depends heavily on social media attention and broader meme coin cycles.

Risks That Skew Bearish for Price Prediction

  • Extreme volatility from pure sentiment-driven price action with no fundamental support
  • Attention cycles shift rapidly, leaving early viral tokens abandoned as new memes emerge
  • Liquidity can evaporate quickly during downturns, creating severe slippage and exit difficulty
  • Regulatory scrutiny may target meme tokens as securities or gambling instruments
  • Macro risk-off environments hit speculative assets hardest, with meme coins showing largest drawdowns
  • Community fragmentation or developer abandonment can eliminate remaining narrative support
  • These factors could push SHIB price predictions toward the lower bear scenarios

Make Your Next Move with Token Metrics

Token Metrics provides technical analysis, scenario math, price prediction models, and rigorous risk evaluation for hundreds of crypto tokens. Want to dig deeper? Explore our powerful AI-powered ratings and scenario tools here.

FAQs: Shiba Inu Price Prediction

Will SHIB 10x from here according to price predictions?

At current price of $0.041027, a 10x reaches $0.41027. This level does not appear in any of the listed bear, base, or moon price prediction scenarios across 8T, 16T, 23T, or 31T tiers. Meme tokens can 10x rapidly during viral moments but can also lose 90%+ just as quickly. Position sizing for potential total loss is critical. Not financial advice.

What are the biggest risks to SHIB price predictions?

Primary risks include attention shifting to newer memes, community fragmentation, developer abandonment, regulatory crackdowns, and liquidity collapse during downturns. Unlike utility tokens with defensive characteristics, SHIB has zero fundamental floor. Price can approach zero if community interest disappears. Total loss is a realistic outcome that price prediction models cannot fully account for. Not financial advice.

What is the 2027 Shiba Inu price prediction?

Based on Token Metrics analysis, the 2027 price prediction for SHIB centers around $0.000012 in the base case under current market conditions. However, meme token price predictions are highly unreliable due to extreme dependence on social trends, viral cycles, and community sentiment that can change rapidly. These technical price prediction ranges should be viewed with extreme caution.

Can SHIB reach $0.01 according to price predictions?

Based on the price prediction scenarios across all market cap tiers (8T-31T), SHIB projections range from $0.041998 to $0.051307. While these technical price predictions show SHIB trading above $0.04, the extreme volatility and sentiment-driven nature of meme tokens means actual outcomes can vary dramatically from model projections. Not financial advice.


Next Steps

Track live data: Token Details

• Consider fundamental crypto assets with utility and defensive characteristics rather than pure speculation.

Disclosure

Educational purposes only, not financial advice. SHIB is a highly speculative asset with extreme volatility and high risk of total loss. Meme tokens operate as entertainment and gambling instruments rather than investments. Only allocate capital you can afford to lose entirely. Do your own research and manage risk appropriately.

Thank you! Your submission has been received!
Oops! Something went wrong while submitting the form.

Crypto Basics Blog

Research Blogs

Announcement Blogs

Unlock the Secrets of Cryptocurrency

Sign Up for the Newsletter for the Exclusive Updates