


.png)


.png)
.png)


.png)


.png)
%201%20(1).png)

.png)


.png)


.png)
.png)


.png)


.png)

.png)
.png)
.png)
.png)
.png)
.png)
.png)
.png)
.png)


.png)


.png)

.png)
.png)


.png)


.png)
.png)
.png)
.png)

.png)
.png)


Research
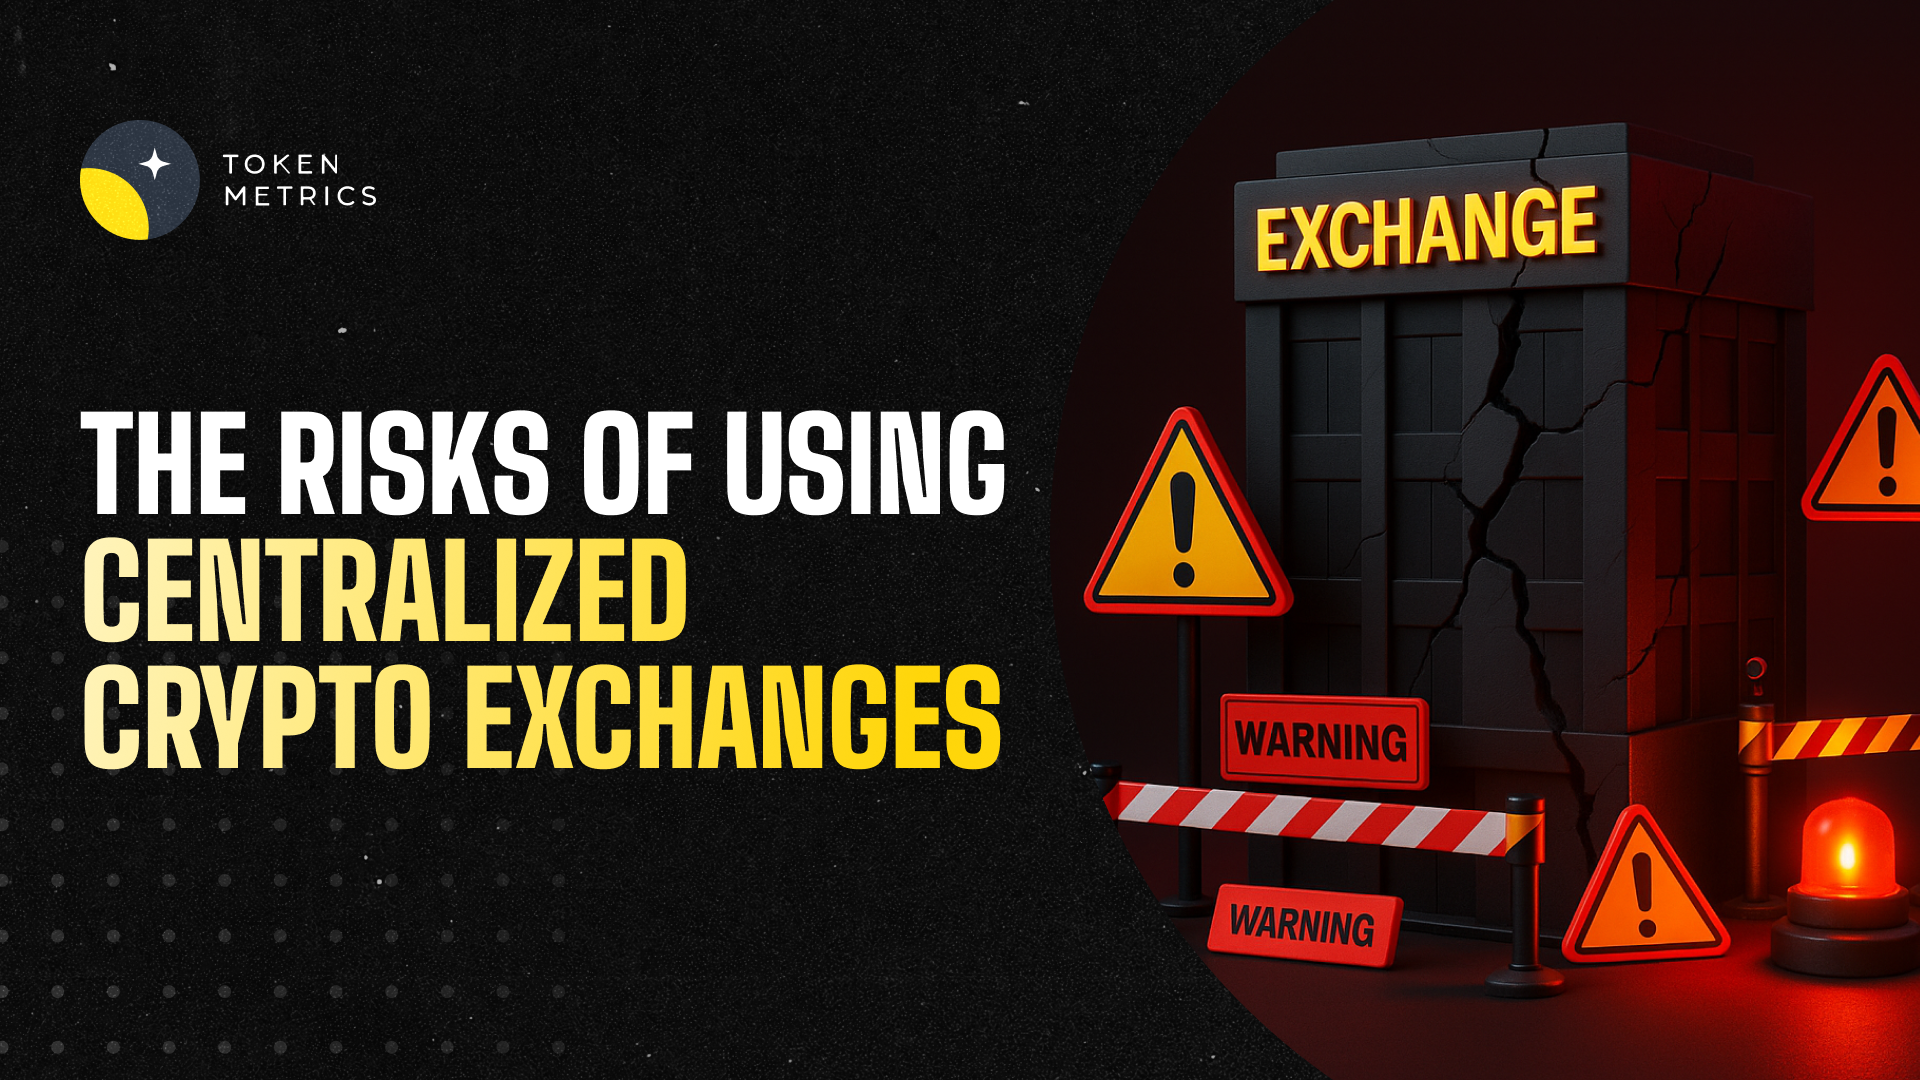
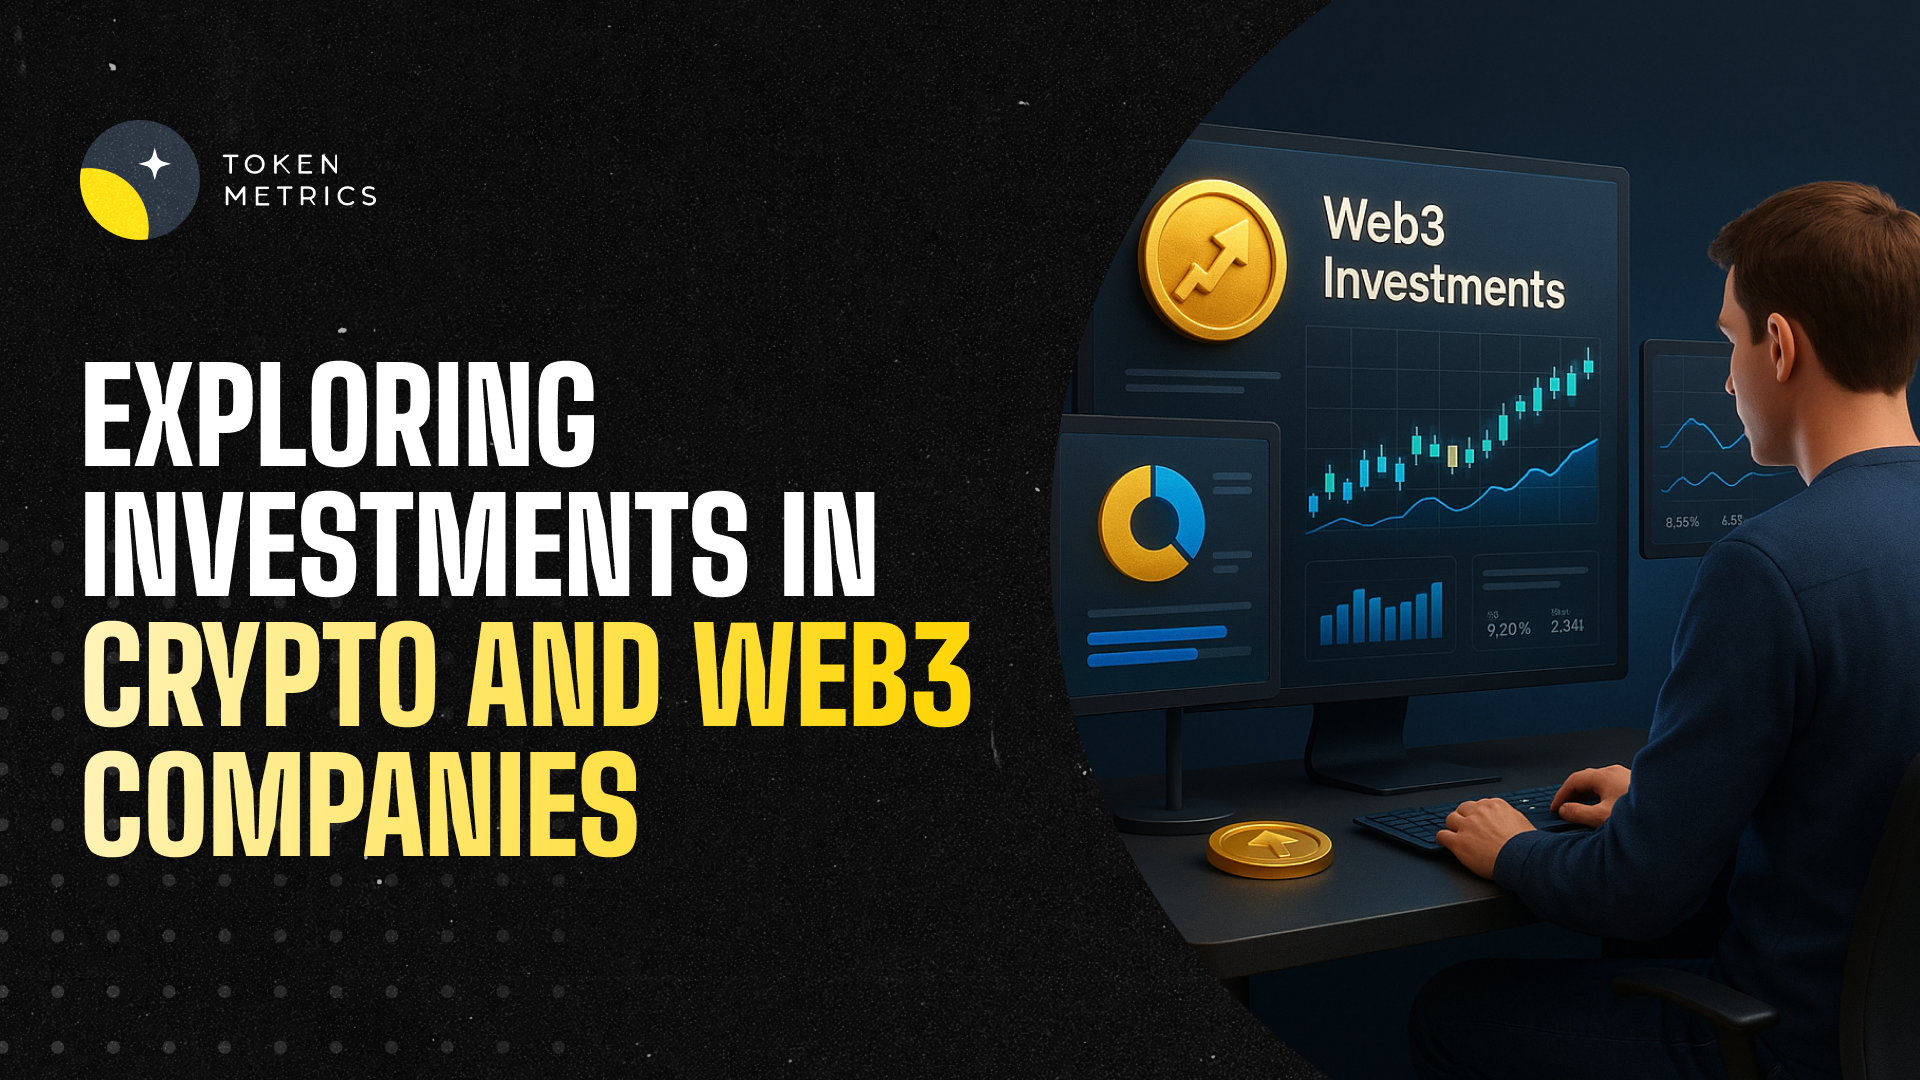
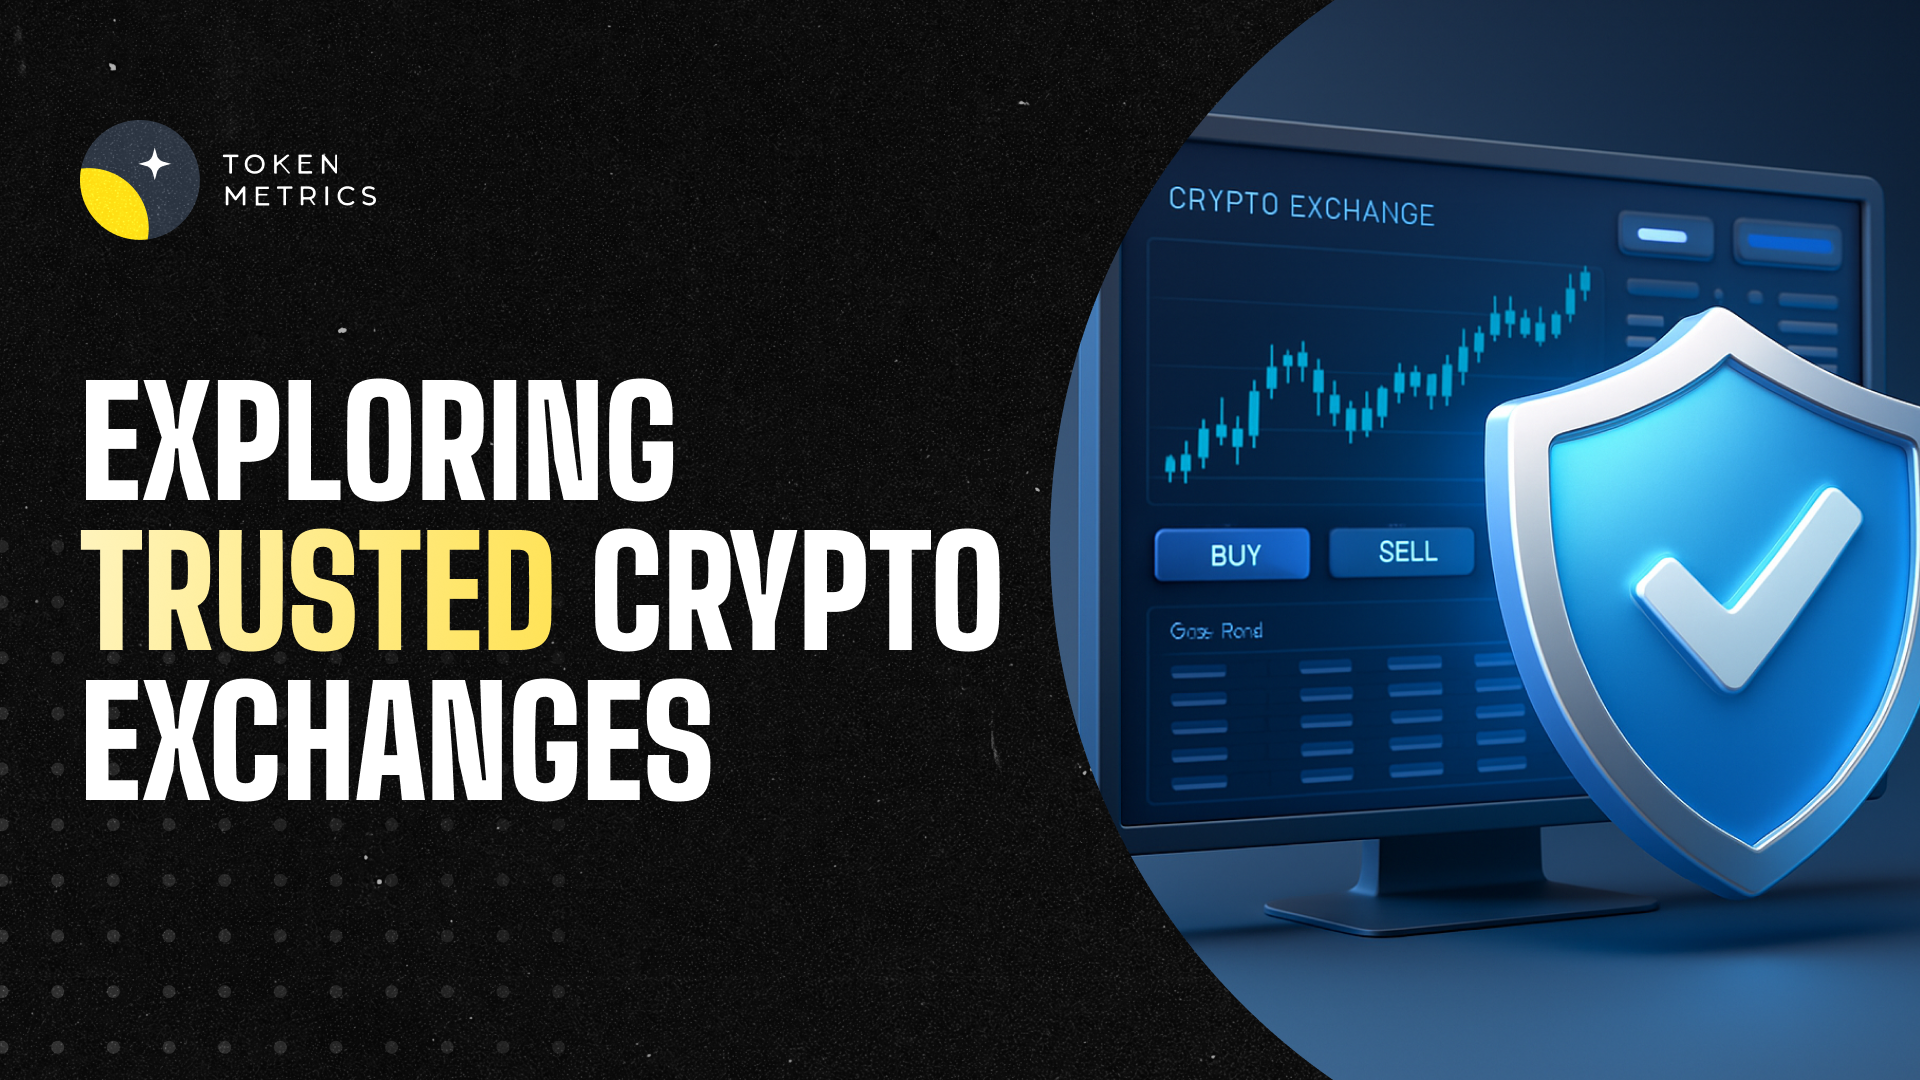
Top Crypto Trading Platforms in 2025
When it comes to crypto trading platforms, Token Metrics is not an exchange, but a crypto analytics and crypto trading intelligence platform powered by AI.
Token Metrics Team
10 min


%201.svg)
%201.svg)
Big news: We’re cranking up the heat on AI-driven crypto analytics with the launch of the Token Metrics API and our official SDK (Software Development Kit). This isn’t just an upgrade – it's a quantum leap, giving traders, hedge funds, developers, and institutions direct access to cutting-edge market intelligence, trading signals, and predictive analytics.
Crypto markets move fast, and having real-time, AI-powered insights can be the difference between catching the next big trend or getting left behind. Until now, traders and quants have been wrestling with scattered data, delayed reporting, and a lack of truly predictive analytics. Not anymore.
The Token Metrics API delivers 32+ high-performance endpoints packed with powerful AI-driven insights right into your lap, including:
Getting started with the Token Metrics API is simple:
At Token Metrics, we believe data should be decentralized, predictive, and actionable.
The Token Metrics API & SDK bring next-gen AI-powered crypto intelligence to anyone looking to trade smarter, build better, and stay ahead of the curve. With our official SDK, developers can plug these insights into their own trading bots, dashboards, and research tools – no need to reinvent the wheel.
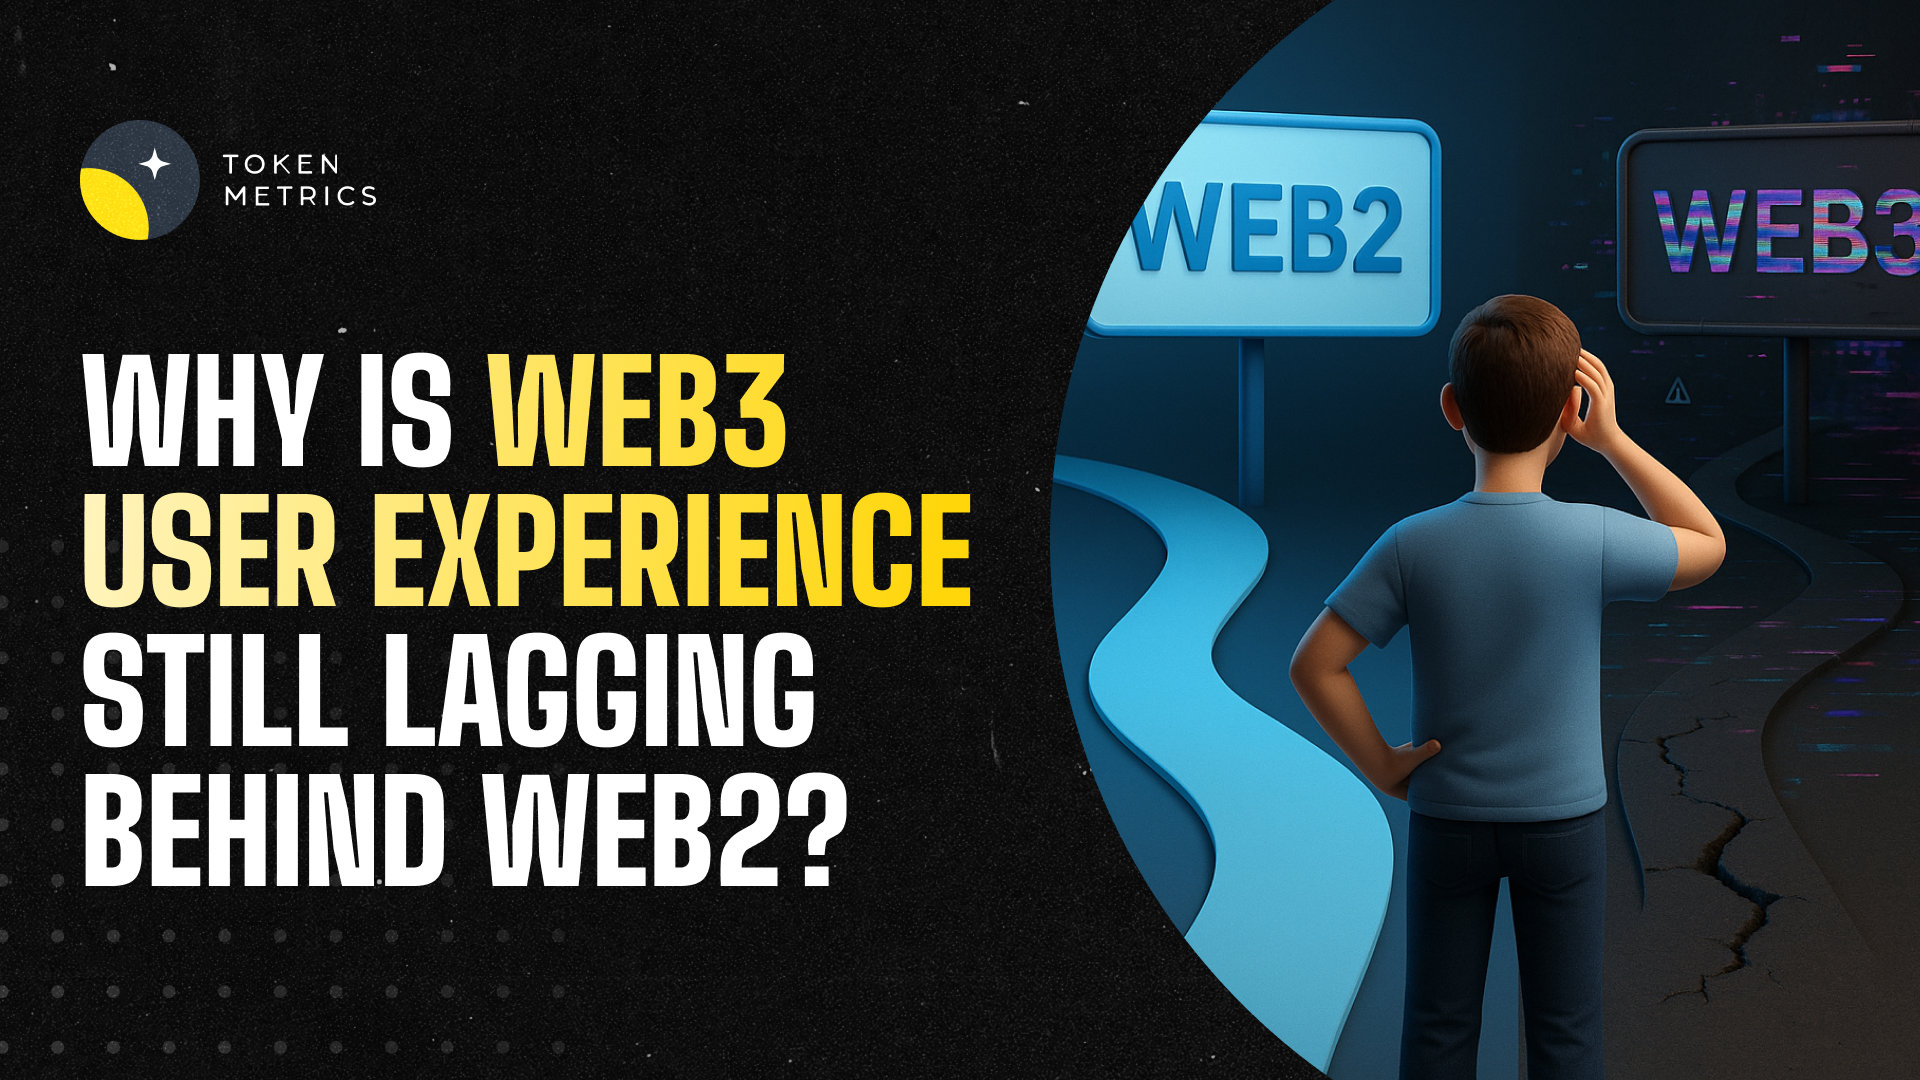
Web3 promises to revolutionize the internet by decentralizing control, empowering users with data ownership, and eliminating middlemen. The technology offers improved security, higher user autonomy, and innovative ways to interact with digital assets. With the Web3 market value expected to reach $81.5 billion by 2030, the potential seems limitless. Yet anyone who's interacted with blockchain products knows the uncomfortable truth: Web3 user experience often feels more like punishment than promise. From nerve-wracking first crypto transactions to confusing wallet popups and sudden unexplained fees, Web3 products still have a long way to go before achieving mainstream adoption. If you ask anyone in Web3 what the biggest hurdle for mass adoption is, UX is more than likely to be the answer. This comprehensive guide explores why Web3 UX remains significantly inferior to Web2 experiences in 2025, examining the core challenges, their implications, and how platforms like Token Metrics are bridging the gap between blockchain complexity and user-friendly crypto investing.
Web3 promises to revolutionize the internet by decentralizing control, empowering users with data ownership, and eliminating middlemen. The technology offers improved security, higher user autonomy, and innovative ways to interact with digital assets. With the Web3 market value expected to reach $81.5 billion by 2030, the potential seems limitless.
Yet anyone who's interacted with blockchain products knows the uncomfortable truth: Web3 user experience often feels more like punishment than promise. From nerve-wracking first crypto transactions to confusing wallet popups and sudden unexplained fees, Web3 products still have a long way to go before achieving mainstream adoption. If you ask anyone in Web3 what the biggest hurdle for mass adoption is, UX is more than likely to be the answer.
This comprehensive guide explores why Web3 UX remains significantly inferior to Web2 experiences in 2025, examining the core challenges, their implications, and how platforms like Token Metrics are bridging the gap between blockchain complexity and user-friendly crypto investing.
To understand Web3's UX challenges, we must first recognize what users expect based on decades of Web2 evolution. Web2, the "read-write" web that started in 2004, enhanced internet engagement through user-generated content, social media platforms, and cloud-based services with intuitive interfaces that billions use daily without thought.
Web2 applications provide seamless experiences: one-click logins via Google or Facebook, instant account recovery through email, predictable transaction costs, and familiar interaction patterns across platforms. Users have become accustomed to frictionless digital experiences that just work.
Web3, by contrast, introduces entirely new paradigms requiring users to manage cryptographic wallets, understand blockchain concepts, navigate multiple networks, pay variable gas fees, and take full custody of their assets. This represents a fundamental departure from familiar patterns, creating immediate friction.
The first interaction with most decentralized applications asks users to "Connect Wallet." If you don't have MetaMask or another compatible wallet, you're stuck before even beginning. This creates an enormous barrier to entry where Web2 simply asks for an email address.
Setting up a Web3 wallet requires understanding seed phrases—12 to 24 random words that serve as the master key to all assets. Users must write these down, store them securely, and never lose them, as there's no "forgot password" option. One mistake means permanent loss of funds.
Most DeFi platforms and crypto wallets nowadays still have cumbersome and confusing interfaces for wallet creation and management. The registration process, which in Web2 takes seconds through social login options, becomes a multi-step educational journey in Web3.
Most challenges in UX/UI design for blockchain stem from lack of understanding of the technology among new users, designers, and industry leaders. Crypto jargon and complex concepts of the decentralized web make it difficult to grasp product value and master new ways to manage funds.
Getting typical users to understand complicated blockchain ideas represents one of the main design challenges. Concepts like wallets, gas fees, smart contracts, and private keys must be streamlined without compromising security or usefulness—a delicate balance few projects achieve successfully.
The blockchain itself is a complex theory requiring significant learning to fully understand. Web3 tries converting this specialized domain knowledge into generalist applications where novices should complete tasks successfully. When blockchain products first started being developed, most were created by experts for experts, resulting in products with extreme pain points, accessibility problems, and complex user flows.
Another common headache in Web3 is managing assets and applications across multiple blockchains. Today, it's not uncommon for users to interact with Ethereum, Polygon, Solana, or several Layer 2 solutions—all in a single session.
Unfortunately, most products require users to manually switch networks in wallets, manually add new networks, or rely on separate bridges to transfer assets. This creates fragmented and confusing experiences where users must understand which network each asset lives on and how to move between them.
Making users distinguish between different networks creates unnecessary cognitive burden. In Web2, users never think about which server hosts their data—it just works. Web3 forces constant network awareness, breaking the illusion of seamless interaction.
Transaction costs in Web3 are variable, unpredictable, and often shockingly expensive. Users encounter sudden, unexplained fees that can range from cents to hundreds of dollars depending on network congestion. There's no way to know costs precisely before initiating transactions, creating anxiety and hesitation.
Web3 experiences generally run on public chains, leading to scalability problems as multiple parties make throughput requests. The more transactions that occur, the higher gas fees become—an unsustainable model as more users adopt applications.
Users shouldn't have to worry about paying high gas fees as transaction costs. Web2 transactions happen at predictable costs or are free to users, with businesses absorbing payment processing fees. Web3's variable cost structure creates friction at every transaction.
In Web2, mistakes are forgivable. Sent money to the wrong person? Contact support. Made a typo? Edit or cancel. Web3 offers no such mercy. Blockchain's immutability means transactions are permanent—send crypto to the wrong address and it's gone forever.
This creates enormous anxiety around every action. Users must triple-check addresses (long hexadecimal strings impossible to memorize), verify transaction details, and understand that one mistake could cost thousands. The nerve-wracking experience of making first crypto transactions drives many users away permanently.
Web2 platforms offer customer service: live chat, email support, phone numbers, and dispute resolution processes. Web3's decentralized nature eliminates these safety nets. There's no one to call when things go wrong, no company to reverse fraudulent transactions, no support ticket system to resolve issues.
This absence of recourse amplifies fear and reduces trust. Users accustomed to consumer protections find Web3's "code is law" philosophy terrifying rather than empowering, especially when their money is at stake.
Web3 applications often provide cryptic error messages that technical users struggle to understand, let alone mainstream audiences. "Transaction failed" without explanation, "insufficient gas" without context, or blockchain-specific error codes mean nothing to average users.
Good UX requires clear, actionable feedback. Web2 applications excel at this—telling users exactly what went wrong and how to fix it. Web3 frequently leaves users confused, frustrated, and unable to progress.
Crypto designs are easily recognizable by dark backgrounds, pixel art, and Web3 color palettes. But when hundreds of products have the same mysterious look, standing out while maintaining blockchain identity becomes challenging.
More problematically, there are no established UX patterns for Web3 interactions. Unlike Web2, where conventions like hamburger menus, shopping carts, and navigation patterns are universal, Web3 reinvents wheels constantly. Every application handles wallet connections, transaction confirmations, and network switching differently, forcing users to relearn basic interactions repeatedly.
The problem with most DeFi startups and Web3 applications is that they're fundamentally developer-driven rather than consumer-friendly. When blockchain products first launched, they were created by technical experts who didn't invest effort in user experience and usability.
This technical-first approach persists today. Products prioritize blockchain purity, decentralization orthodoxy, and feature completeness over simplicity and accessibility. The result: powerful tools that only experts can use, excluding the masses these technologies purportedly serve.
The Web3 revolution caught UI/UX designers by surprise. The Web3 community values privacy and anonymity, making traditional user research challenging. How do you design for someone you don't know and who deliberately stays anonymous?
Researching without compromising user privacy becomes complex, yet dedicating time to deep user exploration remains essential for building products that resonate with actual needs rather than developer assumptions.
Despite years of development and billions in funding, Web3 UX remains problematic for several structural reasons:
Despite challenges, innovative solutions are emerging to bridge the Web3 UX gap:
Modern crypto wallets embrace account abstraction enabling social recovery (using trusted contacts to restore access), seedless wallet creation via Multi-Party Computation, and biometric logins. These features make self-custody accessible without sacrificing security.
Forward-looking approaches use email address credentials tied to Web3 wallets. Companies like Magic and Web3Auth create non-custodial wallets behind familiar email login interfaces using multi-party compute techniques, removing seed phrases from user experiences entirely.
Some platforms absorb transaction costs or implement Layer 2 solutions dramatically reducing fees, creating predictable cost structures similar to Web2.
Progressive platforms abstract blockchain complexity, presenting familiar Web2-like experiences while handling Web3 mechanics behind the scenes. Users interact through recognizable patterns without needing to understand underlying technology.
While many Web3 UX challenges persist, platforms like Token Metrics demonstrate that sophisticated blockchain functionality can coexist with excellent user experience. Token Metrics has established itself as a leading crypto trading and analytics platform by prioritizing usability without sacrificing power.
Intuitive Interface for Complex Analysis
Token Metrics provides personalized crypto research and predictions powered by AI through interfaces that feel familiar to anyone who's used financial applications. Rather than forcing users to understand blockchain intricacies, Token Metrics abstracts complexity while delivering actionable insights.
The platform assigns each cryptocurrency both Trader Grade and Investor Grade scores—simple metrics that encapsulate complex analysis including code quality, security audits, development activity, and market dynamics. Users get sophisticated intelligence without needing blockchain expertise.
Eliminating Technical Barriers
Token Metrics removes common Web3 friction points:
Real-Time Alerts Without Complexity
Token Metrics monitors thousands of cryptocurrencies continuously, providing real-time alerts via email, SMS, or messaging apps about significant developments. Users stay informed without monitoring blockchain explorers, understanding gas prices, or navigating complex interfaces.
This separation between sophisticated monitoring and simple notification demonstrates how Web3 functionality can deliver value through Web2-familiar channels.
Integrated Trading Experience
Token Metrics launched integrated trading in 2025, transforming the platform into an end-to-end solution where users analyze opportunities and execute trades without leaving the ecosystem. This unified experience eliminates the multi-platform juggling typical of Web3 investing.
This seamless connection between analytics and execution showcases how thoughtful UX design bridges blockchain capabilities with user expectations, proving that Web3 doesn't require sacrificing usability.
Educational Without Overwhelming
Token Metrics provides educational resources helping users understand crypto markets without forcing deep technical knowledge. The platform demystifies complex topics through accessible explanations, gradually building user confidence and competence.
This approach recognizes that mainstream adoption requires meeting users where they are—not demanding they become blockchain experts before participating.
The ultimate success of Web3 hinges on user experience. No matter how revolutionary the technology, it will remain niche if everyday people find it too confusing, intimidating, or frustrating. Gaming, FinTech, digital identity, social media, and publishing will likely become Web3-enabled within the next 5 to 10 years—but only if UX improves dramatically.
UX as Competitive Advantage: Companies embracing UX early see fewer usability issues, higher retention, and more engaged users. UX-driven companies continually test assumptions, prototype features, and prioritize user-centric metrics like ease-of-use, task completion rates, and satisfaction—core measures of Web3 product success.
Design as Education: Highly comprehensive Web3 design helps educate newcomers, deliver effortless experiences, and build trust in technology. Design becomes the bridge between innovation and adoption.
Convergence with Web2 Patterns: Successful Web3 applications increasingly adopt familiar Web2 patterns while maintaining decentralized benefits underneath. This convergence represents the path to mass adoption—making blockchain invisible to end users who benefit from its properties without confronting its complexity.
Web3 UX remains significantly inferior to Web2 in 2025 due to fundamental challenges: complex onboarding, technical jargon, multi-chain fragmentation, unpredictable fees, irreversible errors, lack of support, poor feedback, inconsistent patterns, developer-centric design, and constrained user research.
These aren’t superficial problems solvable through better visual design—they stem from blockchain’s architectural realities and the ecosystem’s technical origins. However, they are also not insurmountable. Innovative solutions like account abstraction, email-based onboarding, gasless transactions, and unified interfaces are emerging.
Token Metrics demonstrates that Web3 functionality can deliver through Web2-familiar experiences. By prioritizing user needs over technical purity, abstracting complexity without sacrificing capability, and maintaining intuitive interfaces, Token Metrics shows the path forward for the entire ecosystem.
For Web3 to reach its transformative potential, designers and developers must embrace user-centric principles, continuously adapting to users’ needs rather than forcing users to adapt to technology. The future belongs to platforms that make blockchain invisible—where users experience benefits without confronting complexity.
As we progress through 2025, the gap between Web2 and Web3 UX will narrow, driven by competition for mainstream users, maturing design standards, and recognition that accessibility determines success. The question isn’t whether Web3 UX will improve—it's whether improvements arrive fast enough to capture the massive opportunity awaiting blockchain technology.
For investors navigating this evolving landscape, leveraging platforms like Token Metrics that prioritize usability alongside sophistication provides a glimpse of Web3’s user-friendly future—where powerful blockchain capabilities enhance lives without requiring technical expertise, patience, or tolerance for poor design.
Web3 promises to revolutionize the internet by decentralizing control, empowering users with data ownership, and eliminating middlemen. The technology offers improved security, higher user autonomy, and innovative ways to interact with digital assets. With the Web3 market value expected to reach $81.5 billion by 2030, the potential seems limitless. Yet anyone who's interacted with blockchain products knows the uncomfortable truth: Web3 user experience often feels more like punishment than promise. From nerve-wracking first crypto transactions to confusing wallet popups and sudden unexplained fees, Web3 products still have a long way to go before achieving mainstream adoption. If you ask anyone in Web3 what the biggest hurdle for mass adoption is, UX is more than likely to be the answer. This comprehensive guide explores why Web3 UX remains significantly inferior to Web2 experiences in 2025, examining the core challenges, their implications, and how platforms like Token Metrics are bridging the gap between blockchain complexity and user-friendly crypto investing.
To understand Web3's UX challenges, we must first recognize what users expect based on decades of Web2 evolution. Web2, the "read-write" web that started in 2004, enhanced internet engagement through user-generated content, social media platforms, and cloud-based services with intuitive interfaces that billions use daily without thought.
Web2 applications provide seamless experiences: one-click logins via Google or Facebook, instant account recovery through email, predictable transaction costs, and familiar interaction patterns across platforms. Users have become accustomed to frictionless digital experiences that just work.
Web3, by contrast, introduces entirely new paradigms requiring users to manage cryptographic wallets, understand blockchain concepts, navigate multiple networks, pay variable gas fees, and take full custody of their assets. This represents a fundamental departure from familiar patterns, creating immediate friction.
The first interaction with most decentralized applications asks users to "Connect Wallet." If you don't have MetaMask or another compatible wallet, you're stuck before even beginning. This creates an enormous barrier to entry where Web2 simply asks for an email address. Setting up a Web3 wallet requires understanding seed phrases—12 to 24 random words that serve as the master key to all assets. Users must write these down, store them securely, and never lose them, as there's no "forgot password" option. One mistake means permanent loss of funds.
Most DeFi platforms and crypto wallets nowadays still have cumbersome and confusing interfaces for wallet creation and management. The registration process, which in Web2 takes seconds through social login options, becomes a multi-step educational journey in Web3.
Most challenges in UX/UI design for blockchain stem from lack of understanding of the technology among new users, designers, and industry leaders. Crypto jargon and complex concepts of the decentralized web make it difficult to grasp product value and master new ways to manage funds. Getting typical users to understand complicated blockchain ideas represents one of the main design challenges. Concepts like wallets, gas fees, smart contracts, and private keys must be streamlined without compromising security or usefulness—a delicate balance few projects achieve successfully.
The blockchain itself is a complex theory requiring significant learning to fully understand. Web3 tries converting this specialized domain knowledge into generalist applications where novices should complete tasks successfully. When blockchain products first started being developed, most were created by experts for experts, resulting in products with extreme pain points, accessibility problems, and complex user flows.
Another common headache in Web3 is managing assets and applications across multiple blockchains. Today, it's not uncommon for users to interact with Ethereum, Polygon, Solana, or several Layer 2 solutions—all in a single session. Unfortunately, most products require users to manually switch networks in wallets, manually add new networks, or rely on separate bridges to transfer assets. This creates fragmented and confusing experiences where users must understand which network each asset lives on and how to move between them. Making users distinguish between different networks creates unnecessary cognitive burden. In Web2, users never think about which server hosts their data—it just works. Web3 forces constant network awareness, breaking the illusion of seamless interaction.
Transaction costs in Web3 are variable, unpredictable, and often shockingly expensive. Users encounter sudden, unexplained fees that can range from cents to hundreds of dollars depending on network congestion. There's no way to know costs precisely before initiating transactions, creating anxiety and hesitation. Web3 experiences generally run on public chains, leading to scalability problems as multiple parties make throughput requests. The more transactions that occur, the higher gas fees become—an unsustainable model as more users adopt applications. Users shouldn't have to worry about paying high gas fees as transaction costs. Web2 transactions happen at predictable costs or are free to users, with businesses absorbing payment processing fees. Web3's variable cost structure creates friction at every transaction.
In Web2, mistakes are forgivable. Sent money to the wrong person? Contact support. Made a typo? Edit or cancel. Web3 offers no such mercy. Blockchain's immutability means transactions are permanent—send crypto to the wrong address and it's gone forever. This creates enormous anxiety around every action. Users must triple-check addresses (long hexadecimal strings impossible to memorize), verify transaction details, and understand that one mistake could cost thousands. The nerve-wracking experience of making first crypto transactions drives many users away permanently.
Web2 platforms offer customer service: live chat, email support, phone numbers, and dispute resolution processes. Web3's decentralized nature eliminates these safety nets. There's no one to call when things go wrong, no company to reverse fraudulent transactions, no support ticket system to resolve issues. This absence of recourse amplifies fear and reduces trust. Users accustomed to consumer protections find Web3's "code is law" philosophy terrifying rather than empowering, especially when their money is at stake.
Web3 applications often provide cryptic error messages that technical users struggle to understand, let alone mainstream audiences. "Transaction failed" without explanation, "insufficient gas" without context, or blockchain-specific error codes mean nothing to average users. Good UX requires clear, actionable feedback. Web2 applications excel at this—telling users exactly what went wrong and how to fix it. Web3 frequently leaves users confused, frustrated, and unable to progress.
Crypto designs are easily recognizable by dark backgrounds, pixel art, and Web3 color palettes. But when hundreds of products have the same mysterious look, standing out while maintaining blockchain identity becomes challenging. More problematically, there are no established UX patterns for Web3 interactions. Unlike Web2, where conventions like hamburger menus, shopping carts, and navigation patterns are universal, Web3 reinvents wheels constantly. Every application handles wallet connections, transaction confirmations, and network switching differently, forcing users to relearn basic interactions repeatedly.
The problem with most DeFi startups and Web3 applications is that they're fundamentally developer-driven rather than consumer-friendly. When blockchain products first launched, they were created by technical experts who didn't invest effort in user experience and usability. This technical-first approach persists today. Products prioritize blockchain purity, decentralization orthodoxy, and feature completeness over simplicity and accessibility. The result: powerful tools that only experts can use, excluding the masses these technologies purportedly serve.
The Web3 revolution caught UI/UX designers by surprise. The Web3 community values privacy and anonymity, making traditional user research challenging. How do you design for someone you don't know and who deliberately stays anonymous? Researching without compromising user privacy becomes complex, yet dedicating time to deep user exploration remains essential for building products that resonate with actual needs rather than developer assumptions.
Despite years of development and billions in funding, Web3 UX remains problematic for several structural reasons:
Despite challenges, innovative solutions are emerging to bridge the Web3 UX gap:
While many Web3 UX challenges persist, platforms like Token Metrics demonstrate that sophisticated blockchain functionality can coexist with excellent user experience. Token Metrics has established itself as a leading crypto trading and analytics platform by prioritizing usability without sacrificing power.
The ultimate success of Web3 hinges on user experience. No matter how revolutionary the technology, it will remain niche if everyday people find it too confusing, intimidating, or frustrating. Gaming, FinTech, digital identity, social media, and publishing will likely become Web3-enabled within the next 5 to 10 years—but only if UX improves dramatically.
UX as Competitive Advantage: Companies embracing UX early see fewer usability issues, higher retention, and more engaged users. UX-driven companies continually test assumptions, prototype features, and prioritize user-centric metrics like ease-of-use, task completion rates, and satisfaction—core measures of Web3 product success.
Design as Education: Highly comprehensive Web3 design helps educate newcomers, deliver effortless experiences, and build trust in technology. Design becomes the bridge between innovation and adoption.
Convergence with Web2 Patterns: Successful Web3 applications increasingly adopt familiar Web2 patterns while maintaining decentralized benefits underneath. This convergence represents the path to mass adoption—making blockchain invisible to end users who benefit from its properties without confronting its complexity.
Web3 UX remains significantly inferior to Web2 in 2025 due to fundamental challenges: complex onboarding, technical jargon, multi-chain fragmentation, unpredictable fees, irreversible errors, lack of support, poor feedback, inconsistent patterns, developer-centric design, and constrained user research. These aren't superficial problems solvable through better visual design—they stem from blockchain's architectural realities and the ecosystem's technical origins. However, they're also not insurmountable. Innovative solutions like account abstraction, email-based onboarding, gasless transactions, and unified interfaces are emerging.
Platforms like Token Metrics demonstrate that Web3 functionality can deliver through Web2-familiar experiences. By prioritizing user needs over technical purity, abstracting complexity without sacrificing capability, and maintaining intuitive interfaces, Token Metrics shows the path forward for the entire ecosystem.
For Web3 to achieve its transformative potential, designers and developers must embrace user-centric principles, continuously adapting to users' needs rather than forcing users to adapt to technology. The future belongs to platforms that make blockchain invisible—where users experience benefits without confronting complexity.
As we progress through 2025, the gap between Web2 and Web3 UX will narrow, driven by competition for mainstream users, maturing design standards, and recognition that accessibility determines success. The question isn't whether Web3 UX will improve—it's whether improvements arrive fast enough to capture the massive opportunity awaiting blockchain technology.
For investors navigating this evolving landscape, leveraging platforms like Token Metrics that prioritize usability alongside sophistication provides a glimpse of Web3's user-friendly future—where powerful blockchain capabilities enhance lives without requiring technical expertise, patience, or tolerance for poor design.
.svg)


.png)
Token Metrics Media LLC is a regular publication of information, analysis, and commentary focused especially on blockchain technology and business, cryptocurrency, blockchain-based tokens, market trends, and trading strategies.
Token Metrics Media LLC does not provide individually tailored investment advice and does not take a subscriber’s or anyone’s personal circumstances into consideration when discussing investments; nor is Token Metrics Advisers LLC registered as an investment adviser or broker-dealer in any jurisdiction.
Information contained herein is not an offer or solicitation to buy, hold, or sell any security. The Token Metrics team has advised and invested in many blockchain companies. A complete list of their advisory roles and current holdings can be viewed here: https://tokenmetrics.com/disclosures.html/
Token Metrics Media LLC relies on information from various sources believed to be reliable, including clients and third parties, but cannot guarantee the accuracy and completeness of that information. Additionally, Token Metrics Media LLC does not provide tax advice, and investors are encouraged to consult with their personal tax advisors.
All investing involves risk, including the possible loss of money you invest, and past performance does not guarantee future performance. Ratings and price predictions are provided for informational and illustrative purposes, and may not reflect actual future performance.


%20Price%20Prediction%20.webp)


%20Price%20Prediction.webp)


