


_%20A%20Complete%20Guide%20to%20Ethereum%E2%80%99s%20Native%20Token%20in%202025.png)
.png)


.png)


.png)
.png)


.png)


.png)
%201%20(1).png)

.png)


.png)


.png)
.png)


.png)


.png)

.png)
.png)
.png)
.png)
.png)
.png)
.png)
.png)
.png)


.png)


.png)

.png)
.png)


.png)


.png)
.png)
.png)
.png)

.png)
.png)


Research
Top Crypto Trading Platforms in 2025
When it comes to crypto trading platforms, Token Metrics is not an exchange, but a crypto analytics and crypto trading intelligence platform powered by AI.
Token Metrics Team
10 min


%201.svg)
%201.svg)
Big news: We’re cranking up the heat on AI-driven crypto analytics with the launch of the Token Metrics API and our official SDK (Software Development Kit). This isn’t just an upgrade – it's a quantum leap, giving traders, hedge funds, developers, and institutions direct access to cutting-edge market intelligence, trading signals, and predictive analytics.
Crypto markets move fast, and having real-time, AI-powered insights can be the difference between catching the next big trend or getting left behind. Until now, traders and quants have been wrestling with scattered data, delayed reporting, and a lack of truly predictive analytics. Not anymore.
The Token Metrics API delivers 32+ high-performance endpoints packed with powerful AI-driven insights right into your lap, including:
Getting started with the Token Metrics API is simple:
At Token Metrics, we believe data should be decentralized, predictive, and actionable.
The Token Metrics API & SDK bring next-gen AI-powered crypto intelligence to anyone looking to trade smarter, build better, and stay ahead of the curve. With our official SDK, developers can plug these insights into their own trading bots, dashboards, and research tools – no need to reinvent the wheel.
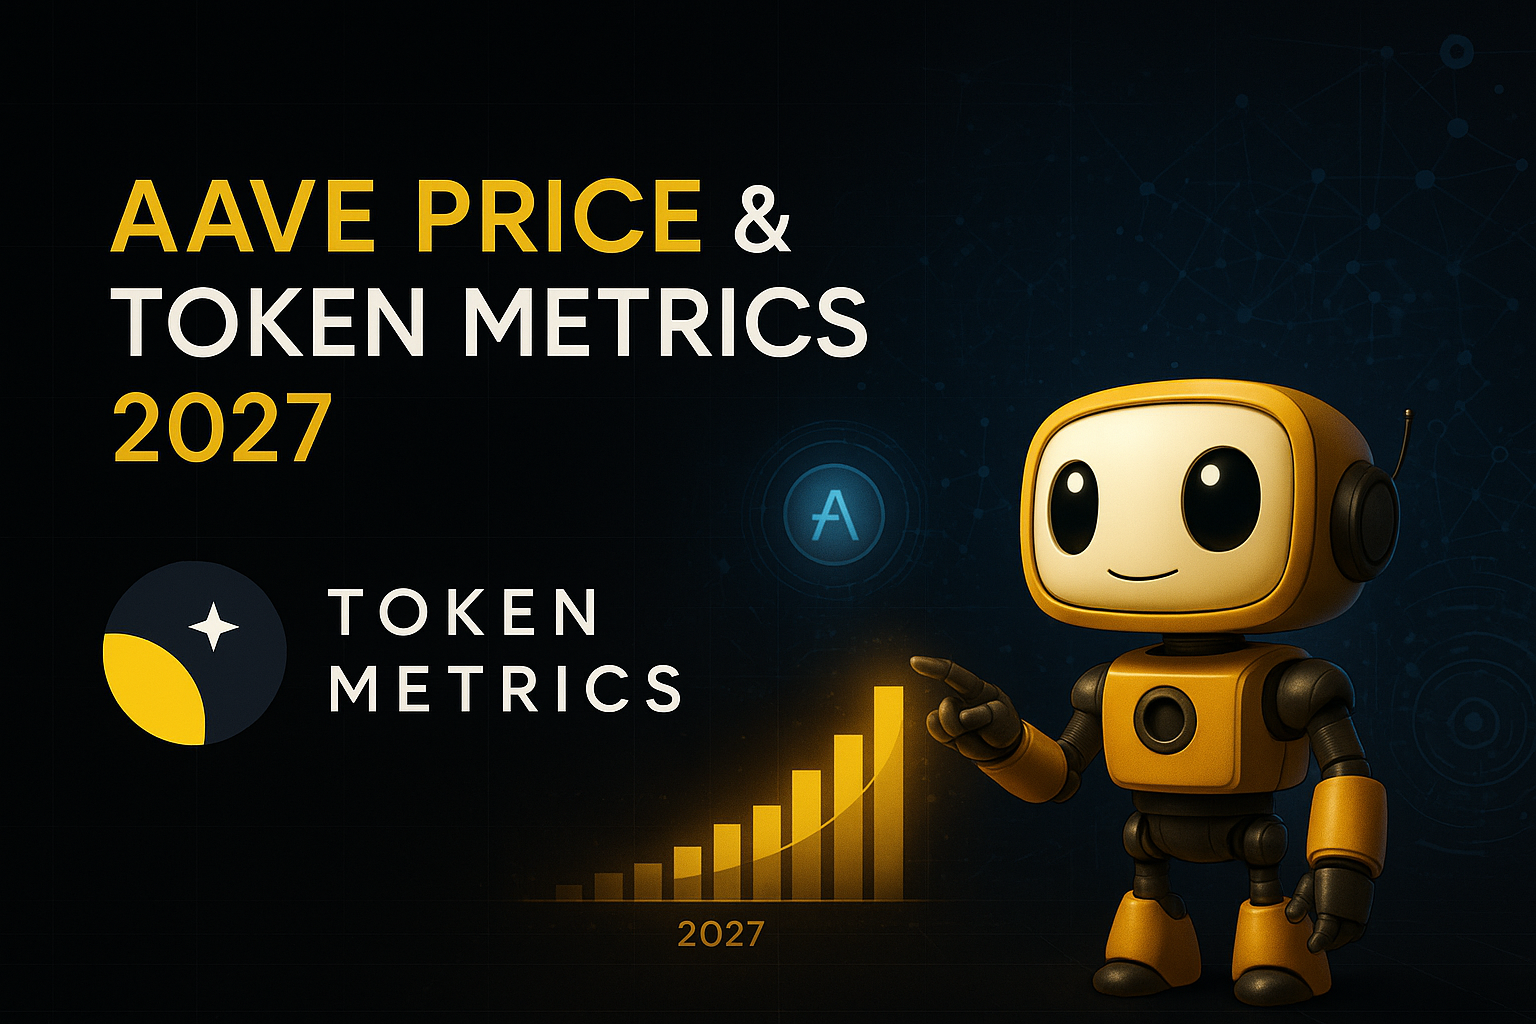
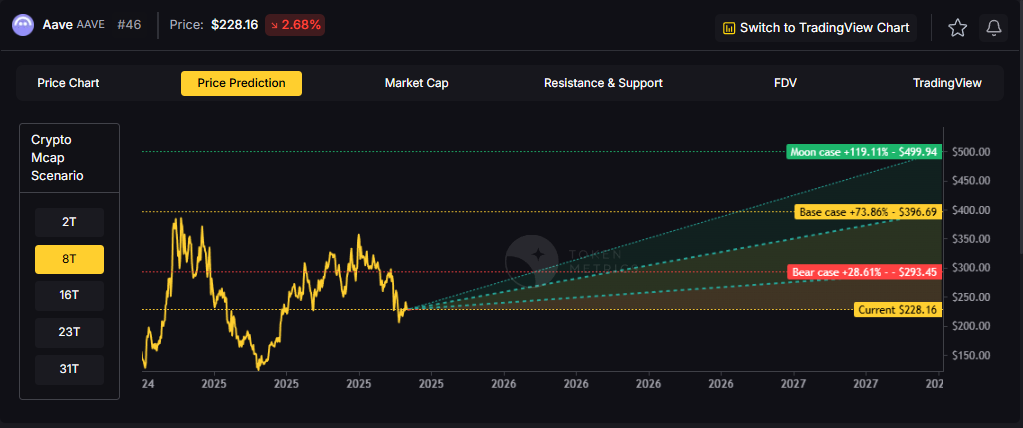
DeFi protocols are maturing beyond early ponzi dynamics toward sustainable revenue models. Aave operates in this evolving landscape where real yield and proven product-market fit increasingly drive valuations rather than speculation alone. Growing regulatory pressure on centralized platforms creates tailwinds for decentralized alternatives—factors that inform our comprehensive AAVE price prediction framework.
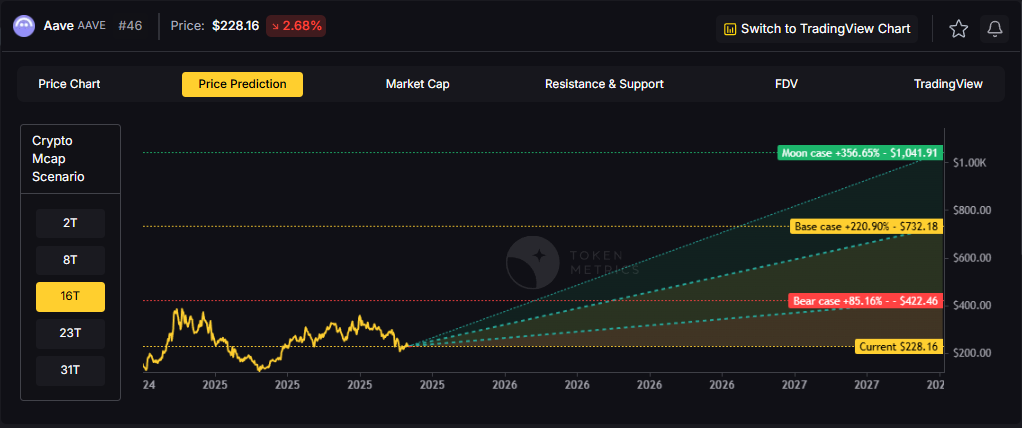
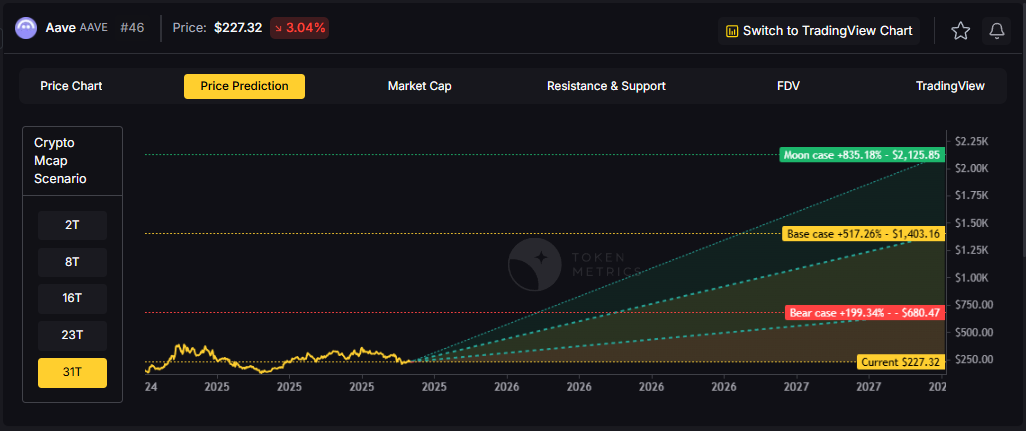
The scenario bands below reflect how AAVE price predictions might perform across different total crypto market cap environments. Each tier represents a distinct liquidity regime, from bear conditions with muted DeFi activity to moon scenarios where decentralized infrastructure captures significant value from traditional finance.

Disclosure
Educational purposes only, not financial advice. Crypto is volatile, do your own research and manage risk.
Each band blends cycle analogues and market-cap share math with TA guardrails. Base assumes steady adoption and neutral or positive macro. Moon layers in a liquidity boom. Bear assumes muted flows and tighter liquidity.
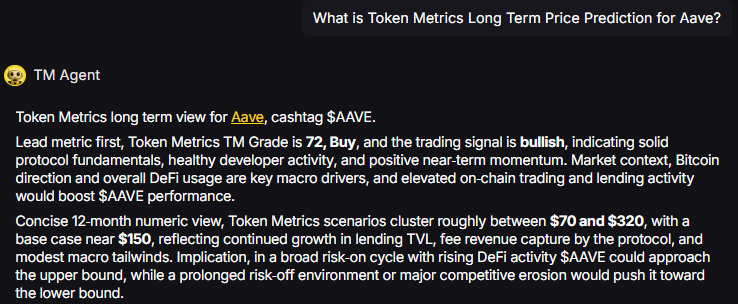
TM Agent baseline: Token Metrics TM Grade is 72, Buy, and the trading signal is bullish, indicating solid protocol fundamentals, healthy developer activity, and positive near-term momentum. Concise twelve-month numeric view, Token Metrics price prediction scenarios cluster roughly between $70 and $320, with a base case near $150, reflecting continued growth in lending TVL, fee revenue capture by the protocol, and modest macro tailwinds.
Live details: Aave Token Details
Affiliate Disclosure: We may earn a commission from qualifying purchases made via this link, at no extra cost to you.
Our Token Metrics price prediction framework spans four market cap tiers, each representing different levels of crypto market maturity and liquidity:
8T Market Cap - AAVE Price Prediction:
At an 8 trillion dollar total crypto market cap, AAVE projects to $293.45 in bear conditions, $396.69 in the base case, and $499.94 in bullish scenarios.
Doubling the market to 16 trillion expands the price prediction range to $427.46 (bear), $732.18 (base), and $1,041.91 (moon).
At 23 trillion, the price prediction scenarios show $551.46, $1,007.67, and $1,583.86 respectively.

In the maximum liquidity scenario of 31 trillion, AAVE price predictions could reach $680.47 (bear), $1,403.16 (base), or $2,175.85 (moon).
Each tier assumes progressively stronger market conditions, with the base case price prediction reflecting steady growth and the moon case requiring sustained bull market dynamics.
Aave represents one opportunity among hundreds in crypto markets. Token Metrics Indices bundle AAVE with top one hundred assets for systematic exposure to the strongest projects. Single tokens face idiosyncratic risks that diversified baskets mitigate.
Historical index performance demonstrates the value of systematic diversification versus concentrated positions.
Aave is a decentralized lending protocol that operates across multiple EVM-compatible chains including Ethereum, Polygon, Arbitrum, and Optimism. The network enables users to supply crypto assets as collateral and borrow against them in an over-collateralized manner, with interest rates dynamically adjusted based on utilization.
The AAVE token serves as both a governance asset and a backstop for the protocol through the Safety Module, where stakers earn rewards in exchange for assuming shortfall risk. Primary utilities include voting on protocol upgrades, fee switches, collateral parameters, and new market deployments.
Token Metrics AI provides comprehensive context on Aave's positioning and challenges.
Vision: Aave aims to create an open, accessible, and non-custodial financial system where users have full control over their assets. Its vision centers on decentralizing credit markets and enabling seamless, trustless lending and borrowing across blockchain networks.
Problem: Traditional financial systems often exclude users due to geographic, economic, or institutional barriers. Even in crypto, accessing credit or earning yield on idle assets can be complex, slow, or require centralized intermediaries. Aave addresses the need for transparent, permissionless, and efficient lending and borrowing markets in the digital asset space.
Solution: Aave uses a decentralized protocol where users supply assets to liquidity pools and earn interest, while borrowers can draw from these pools by posting collateral. It supports features like variable and stable interest rates, flash loans, and cross-chain functionality through its Layer 2 and multi-chain deployments. The AAVE token is used for governance and as a safety mechanism via its staking program (Safety Module).
Market Analysis: Aave is a leading player in the DeFi lending sector, often compared with protocols like Compound and Maker. It benefits from strong brand recognition, a mature codebase, and ongoing innovation such as Aave Arc for institutional pools and cross-chain expansion. Adoption is driven by liquidity, developer activity, and integration with other DeFi platforms. Key risks include competition from newer lending protocols, regulatory scrutiny on DeFi, and smart contract risks. As a top DeFi project, Aave's performance reflects broader trends in decentralized finance, including yield demand, network security, and user trust. Its multi-chain strategy helps maintain relevance amid shifting ecosystem dynamics.
Fundamental Grade: 75.51% (Community 77%, Tokenomics 100%, Exchange 100%, VC 49%, DeFi Scanner 70%).

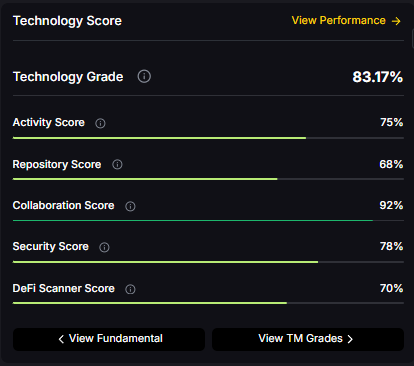
Technology Grade: 83.17% (Activity 75%, Repository 68%, Collaboration 92%, Security 78%, DeFi Scanner 70%).
Yes. Based on our price prediction scenarios, AAVE could reach $1,007.67 in the 23T base case and $1,041.91 in the 16T moon case. Not financial advice.
At current price of $228.16, a 10x would reach $2,281.60. This falls within the 31T moon case price prediction at $2,175.85 (only slightly below), and would require extreme liquidity expansion. Not financial advice.
Our moon case price predictions range from $499.94 at 8T to $2,175.85 at 31T. These scenarios assume maximum liquidity expansion and strong Aave adoption. Not financial advice.
Our comprehensive 2027 price prediction framework suggests AAVE could trade between $293.45 and $2,175.85, depending on market conditions and total crypto market capitalization. The base case scenario clusters around $396.69 to $1,403.16 across different market cap environments. Not financial advice.
AAVE shows strong fundamentals (75.51% grade) and technology scores (83.17% grade), with bullish trading signals. However, all price predictions involve uncertainty and risk. Always conduct your own research and consult financial advisors before investing. Not financial advice.
Track live grades and signals: Token Details
Want exposure? Buy AAVE on MEXC
Disclosure
Educational purposes only, not financial advice. Crypto is volatile, do your own research and manage risk.
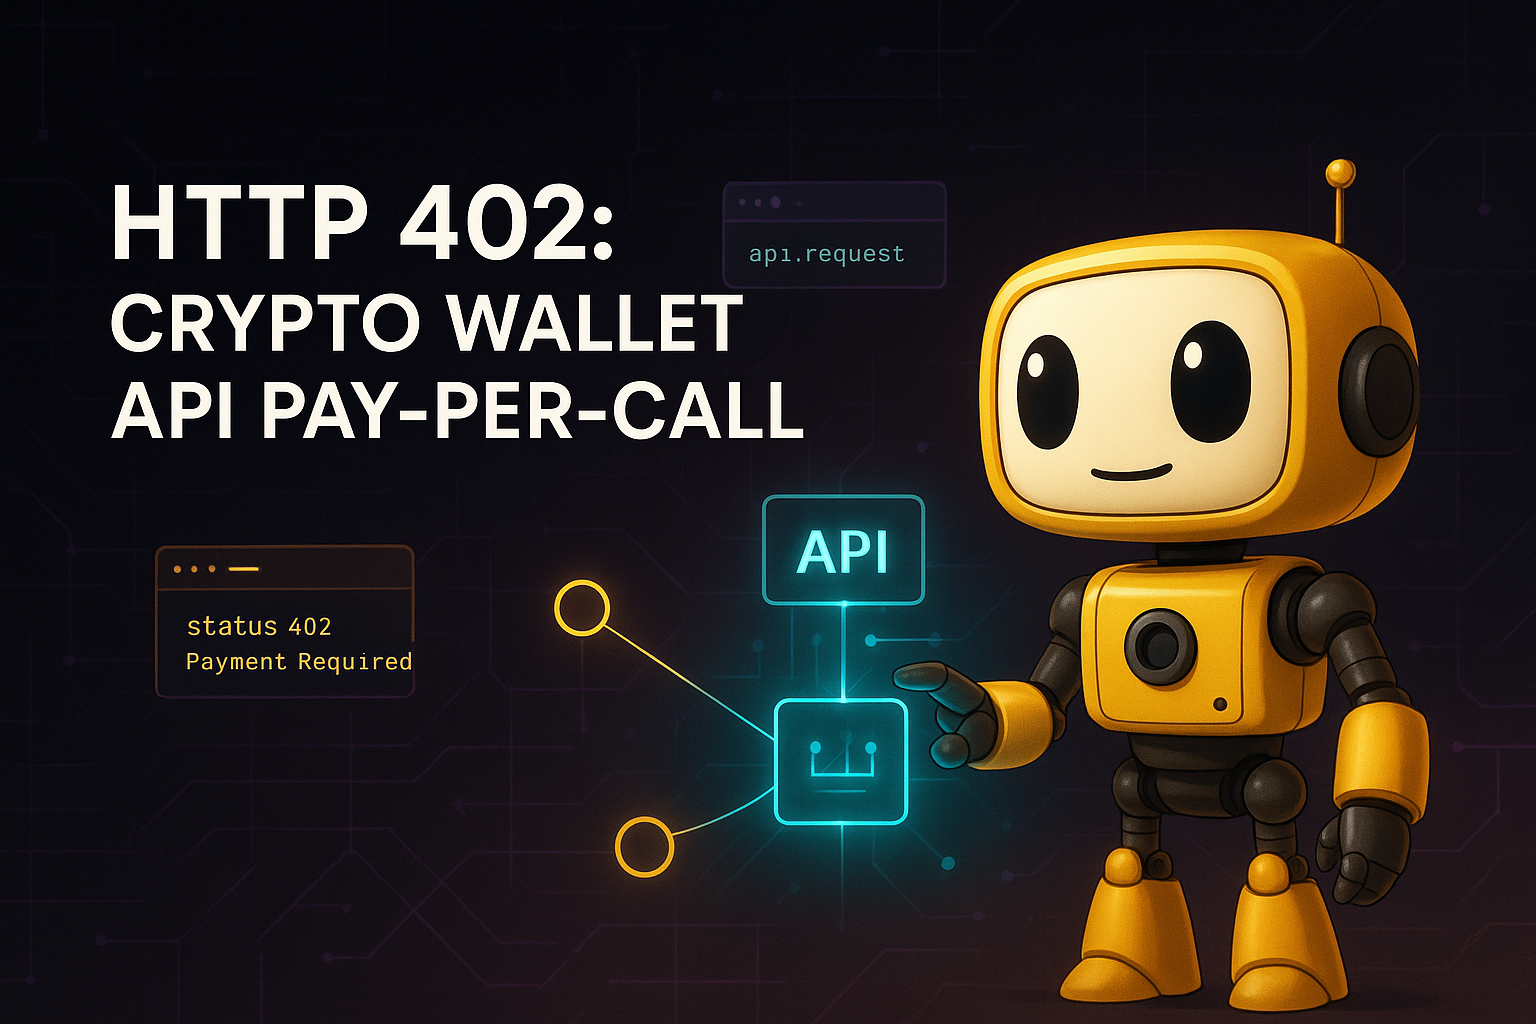
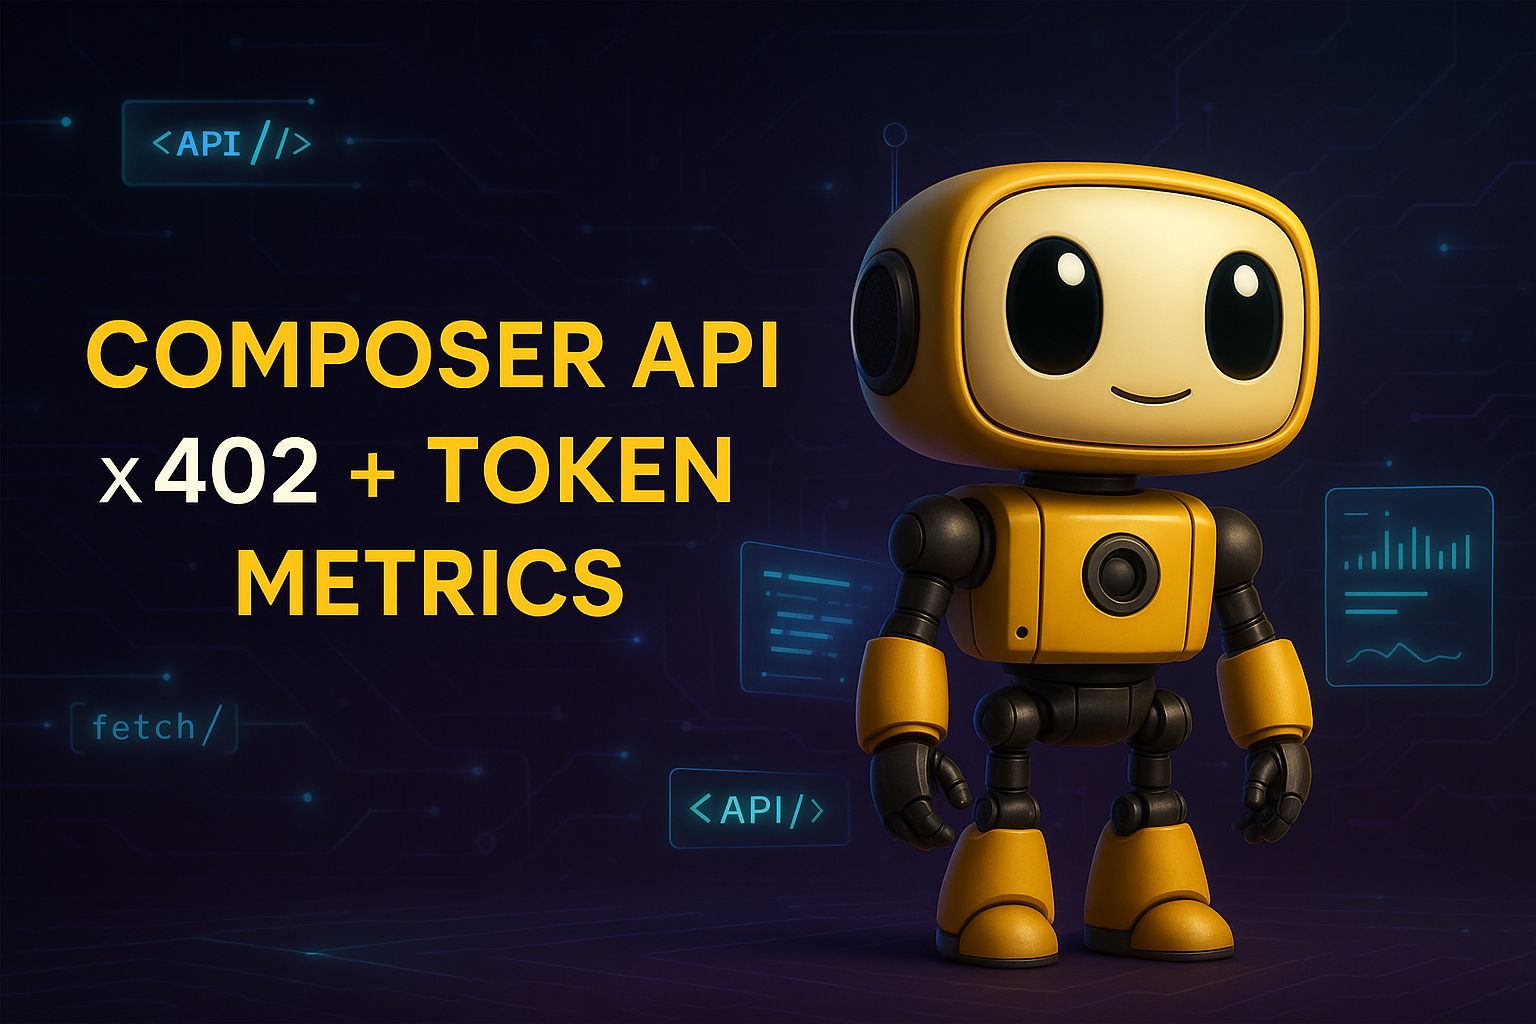
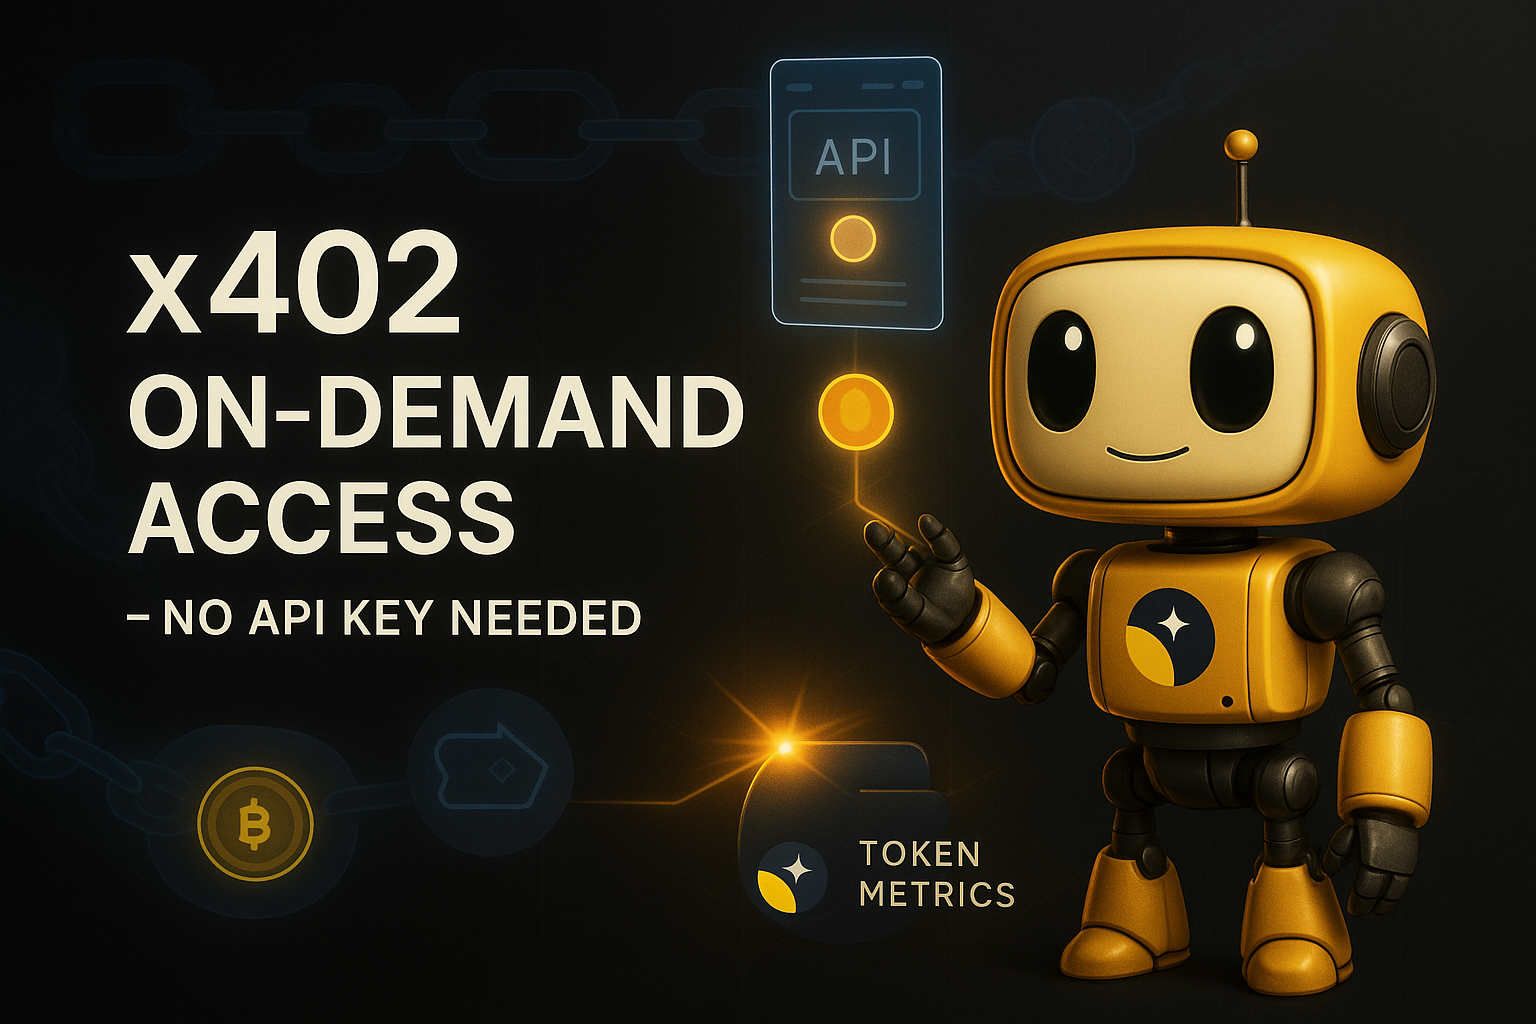
x402 is an open-source, HTTP-native payment protocol developed by Coinbase that enables pay-per-call API access using crypto wallets. It leverages the HTTP 402 Payment Required status code to create seamless, keyless API payments.
It eliminates traditional API keys and subscriptions, allowing agents and applications to pay for exactly what they use in real time. It works across Base and Solana with USDC and selected native tokens such as TMAI.
Start using Token Metrics X402 integration here. https://www.x402scan.com/server/244415a1-d172-4867-ac30-6af563fd4d25
x402 transforms API access by making payments native to HTTP requests.
Feature | Traditional APIs | x402 APIs |
Authentication | API keys, tokens | Wallet signature |
Payment Model | Subscription, prepaid | Pay-per-call |
Onboarding | Sign up, KYC, billing | Connect wallet |
Rate Limits | Fixed tiers | Economic (pay more = more access) |
Commitment | Monthly/annual | Zero, per-call only |
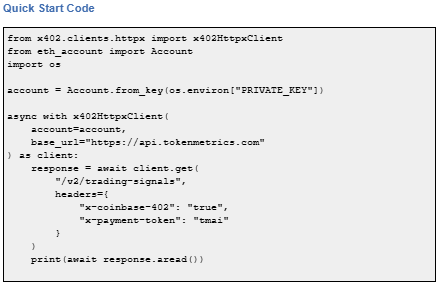
How to use it: Add x-coinbase-402: true header to any supported endpoint. Sign payment with your wallet. The API responds immediately after confirming micro-payment.
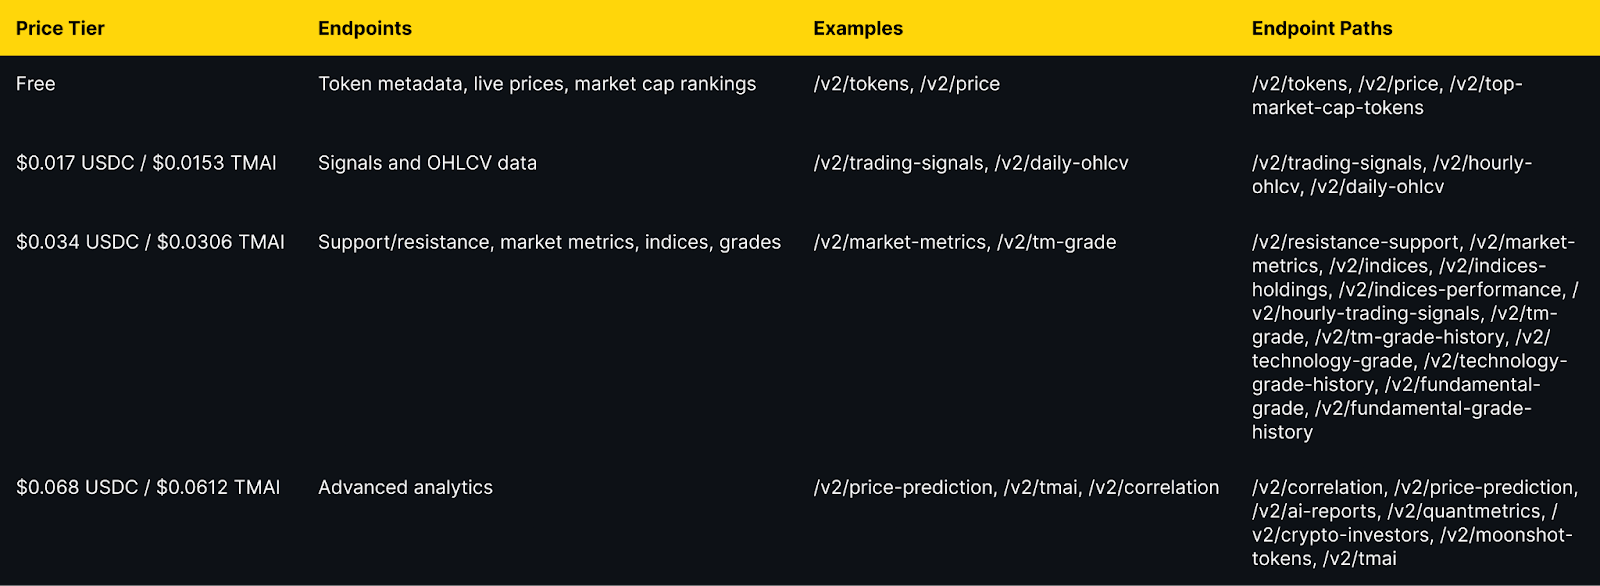
Token Metrics integration: All public endpoints available via x402 with per-call pricing from $0.017 to $0.068 USDC (10% discount with TMAI token).
Explore live agents: https://www.x402scan.com/composer.
The Protocol Flow
The HTTP 402 status code was reserved in HTTP/1.1 in 1997 for future digital payment use cases and was never standardized for any specific payment scheme. x402 activates this path by using 402 responses to coordinate crypto payments during API requests.
Why this matters: It eliminates intermediary payment processors, enables true machine-to-machine commerce, and reduces friction for AI agents.
CoinGecko Recognition
CoinGecko launched a dedicated x402 Ecosystem category in October 2025, tracking 700+ projects with over $1 billion market cap and approximately $213 million in daily trading volume. Top performers include PING and Alnalyst, along with established projects like EigenCloud.
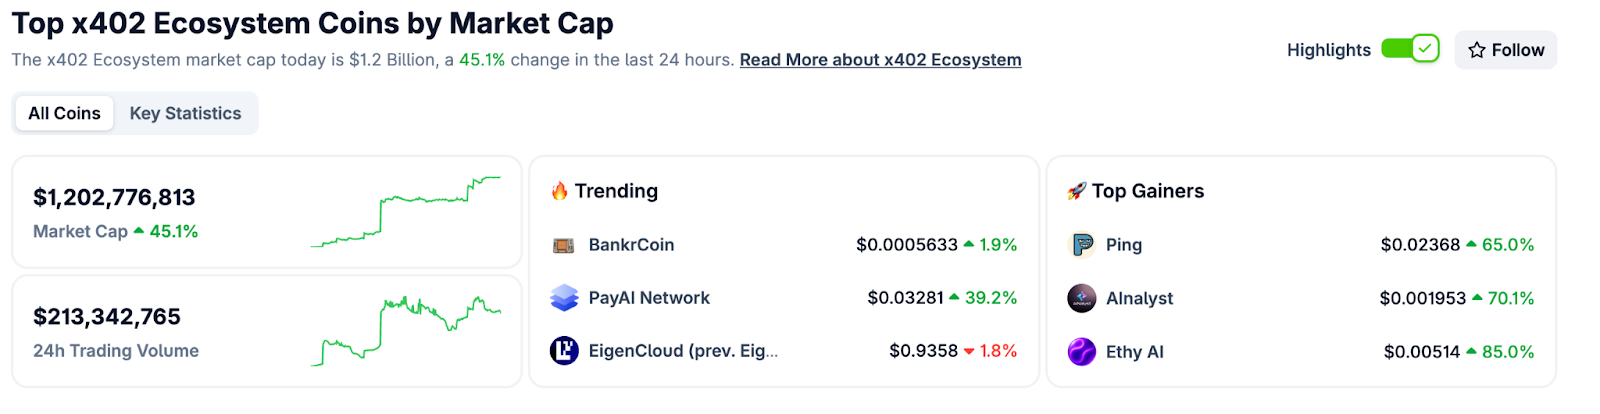
Base Network Adoption
Base has emerged as the primary chain for x402 adoption, with 450,000+ weekly transactions by late October 2025, up from near-zero in May. This growth demonstrates real agent and developer usage.
Composer is x402scan's sandbox for discovering and using AI agents that pay per tool call. Users can open any agent, chat with it, and watch tool calls and payments stream in real time.
Top agents include AInalyst, Canza, SOSA, and NewEra. The Composer feed shows live activity across all agents.

Explore Composer: https://x402scan.com/composer
What We Ship
Token Metrics offers all public API endpoints via x402 with no API key required. Pay per call with USDC or TMAI for a 10 percent discount. Access includes trading signals, price predictions, fundamental grades, technology scores, indices data, and the AI chatbot.
Check out Token Metrics Integration on X402. https://www.x402scan.com/server/244415a1-d172-4867-ac30-6af563fd4d25
Data as of October, 2025.
Pricing Tiers
Important note: TMAI Spend Limit: TMAI has 18 decimals. Set max payment to avoid overspending. Example: 200 TMAI = 200 * (10 ** 18) in base units.
Full integration guide: https://api.tokenmetrics.com
Ecosystem Participants and Tools
Active x402 Endpoints
Key endpoints beyond Token Metrics include Heurist Mesh for crypto intelligence, Tavily extract for structured web content, Firecrawl search for SERP and scraping, Twitter or X search for social discovery, and various DeFi and market data providers.
Infrastructure and Tools
Common Questions About x402
How is x402 different from traditional API keys?
x402 uses wallet signatures instead of API keys. Payment happens per call rather than via subscription. No sign-up, no monthly billing, no rate limit tiers. You pay for exactly what you use.
Which chains support x402?
Currently Base and Solana. Most activity is on Base with USDC as the primary payment token. Some endpoints accept native tokens like TMAI for discounts.
Do I need to trust the API provider with my funds?
No. Payments are on-chain and verifiable. You approve each transaction amount. No escrow or prepayment is required.
What happens if a payment fails?
The API returns 402 Payment Required again with updated payment details. Your client retries automatically. You do not receive data until payment confirms.
Can I use x402 with existing API clients?
Yes, with x402 client libraries such as x402-axios for Node and x402-httpx for Python. These wrap standard HTTP clients and handle the payment flow automatically.
Getting Started Checklist
Token Metrics x402 Resources
What's Next for x402
Ecosystem expansion. More API providers adopting x402, additional chains beyond Base and Solana, standardization of payment headers and response formats.
Agent sophistication. As x402 matures, expect agents that automatically discover and compose multiple paid endpoints, optimize costs across providers, and negotiate better rates for bulk usage.
Disclosure
Educational content only, not financial advice. API usage and crypto payments carry risks. Verify all transactions before signing. Do your own research.
Opening Hook
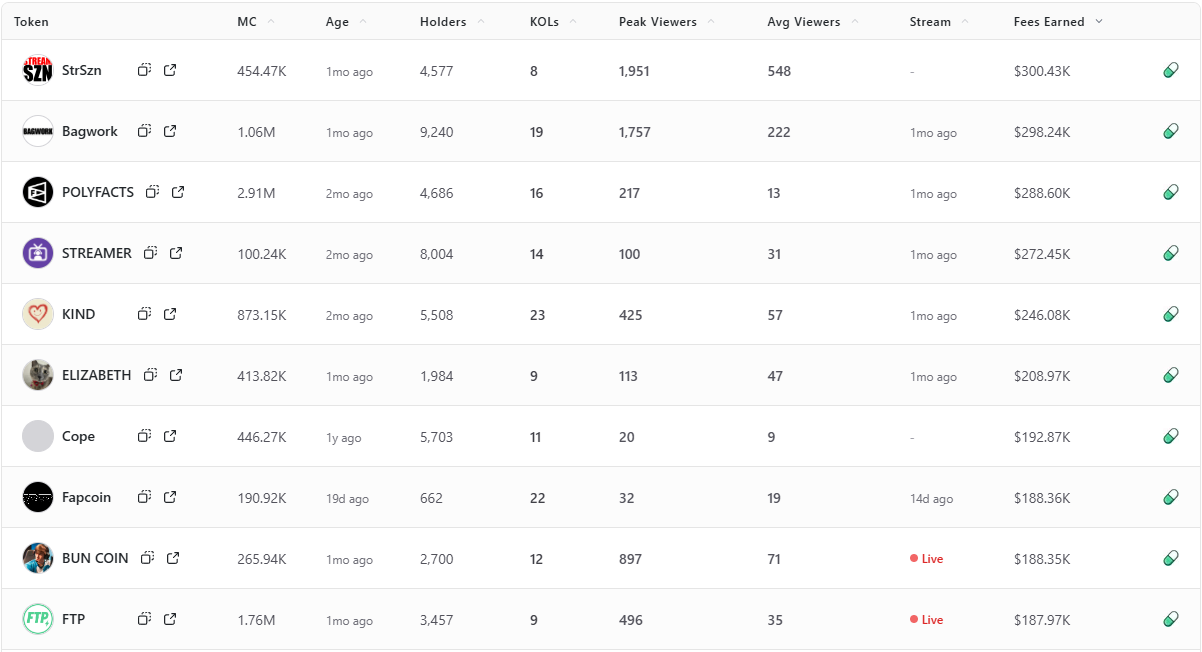
Fees Earned is a clean way to see which livestream tokens convert attention into on-chain activity. This leaderboard ranks the top 10 Pump.fun livestream tokens by Fees Earned using the screenshot you provided.
Selection rule is simple, top 10 by Fees Earned from the screenshot, numbers appear exactly as shown. If a field is not in the image, it is recorded as —.
Entity coverage: project names and tickers are taken as listed on Pump.fun, chain is Solana, sector is livestream meme tokens and creator tokens.
Token Metrics Live (TMLIVE) brings real time, data driven crypto market analysis to Pump.fun. The team has produced live crypto content for 7 years with a 500K plus audience and a platform of more than 100,000 users. Our public track record includes early coverage of winners like MATIC and Helium in 2018.
TMLIVE Quick Stats, as captured
TLDR: Fees Earned Leaders at a Glance
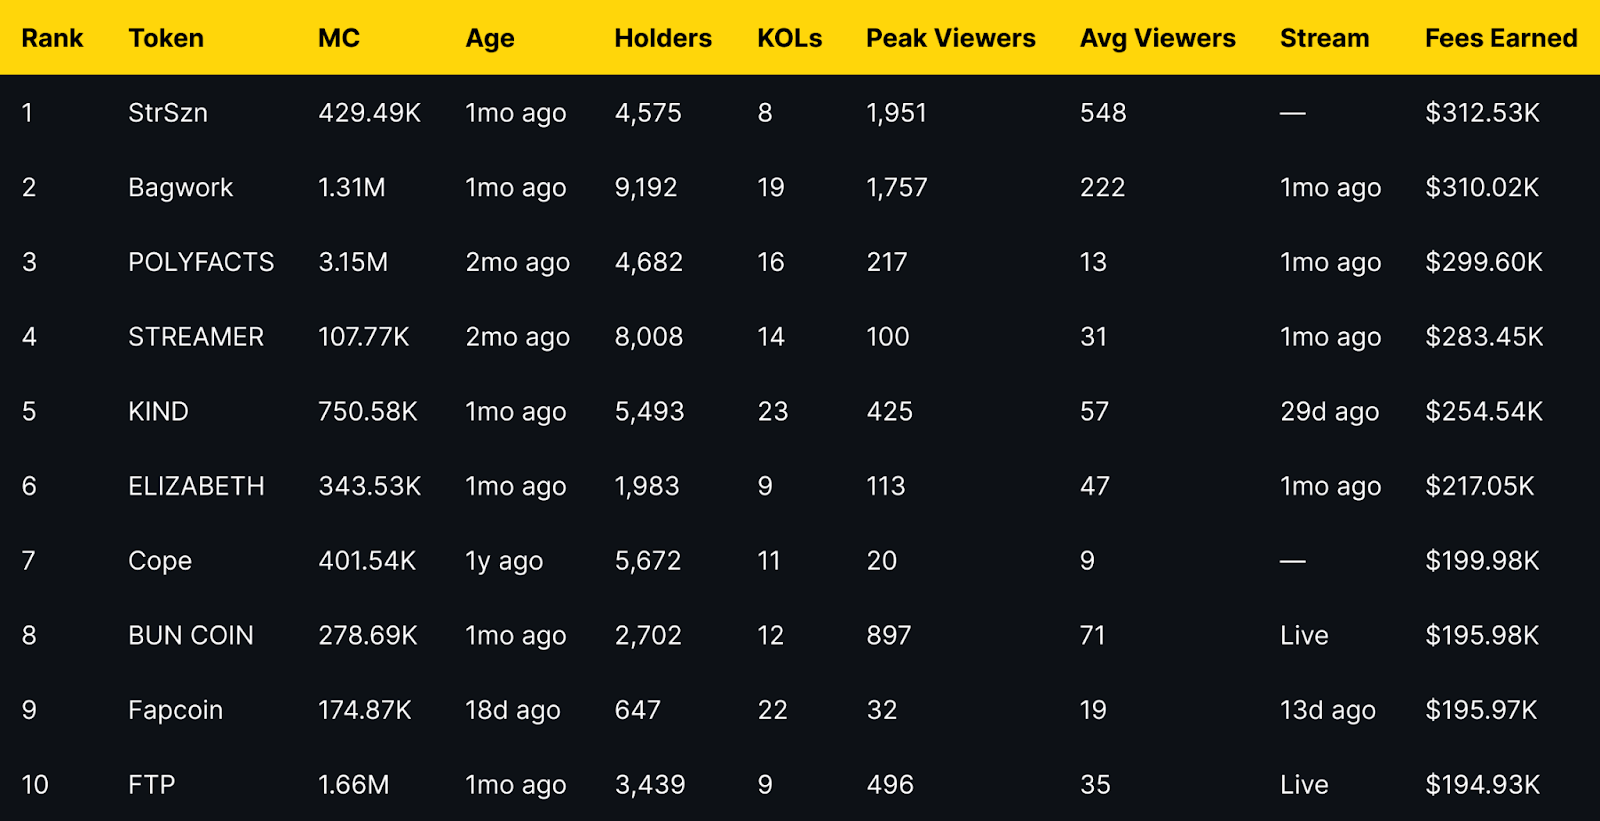
Short distribution note: the top three sit within a narrow band of each other, while mid-table tokens show a mix of older communities and recent streams. Several names with modest average viewers still appear due to concentrated activity during peaks.
StrSzn
Positioning: Active community meme with consistent viewer base.
Research Blurb: Project details unclear at time of writing. Fees and viewership suggest consistent stream engagement over the last month.
Quick Facts: Chain = Solana, Status = —, Peak Viewers = 1,951, Avg Viewers = 548.
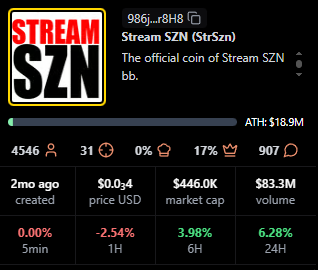
https://pump.fun/coin/986j8mhmidrcbx3wf1XJxsQFvWBMXg7gnDi3mejsr8H8
Bagwork
Positioning: Large holder base with sustained attention.
Research Blurb: Project details unclear at time of writing. Strong holders and KOL presence supported steady audience numbers.
Quick Facts: Chain = Solana, Status = 1mo ago, Holders = 9,192, KOLs = 19.

https://pump.fun/coin/7Pnqg1S6MYrL6AP1ZXcToTHfdBbTB77ze6Y33qBBpump
POLYFACTS
Positioning: Higher market cap with light average viewership.
Research Blurb: Project details unclear at time of writing. High market cap with comparatively low average viewers implies fees concentrated in shorter windows.
Quick Facts: Chain = Solana, Status = 1mo ago, MC = 3.15M, Avg Viewers = 13.
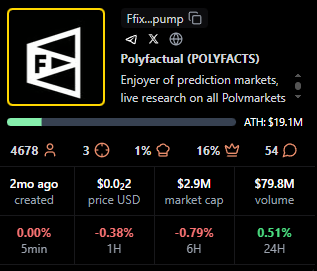
https://pump.fun/coin/FfixAeHevSKBZWoXPTbLk4U4X9piqvzGKvQaFo3cpump
STREAMER
Positioning: Community focused around streaming identity.
Research Blurb: Project details unclear at time of writing. Solid holders and moderate KOL count, steady averages over time.
Quick Facts: Chain = Solana, Status = 1mo ago, Holders = 8,008, KOLs = 14.

https://pump.fun/coin/3arUrpH3nzaRJbbpVgY42dcqSq9A5BFgUxKozZ4npump
KIND
Positioning: Heaviest KOL footprint in the top 10.
Research Blurb: Project details unclear at time of writing. The largest KOL count here aligns with above average view metrics and meaningful fees.
Quick Facts: Chain = Solana, Status = 29d ago, KOLs = 23, Avg Viewers = 57.

https://pump.fun/coin/V5cCiSixPLAiEDX2zZquT5VuLm4prr5t35PWmjNpump
ELIZABETH
Positioning: Mid-cap meme with consistent streams.
Research Blurb: Project details unclear at time of writing. Viewer averages and recency indicate steady presence rather than single spike behavior.
Quick Facts: Chain = Solana, Status = 1mo ago, Avg Viewers = 47, Peak Viewers = 113.
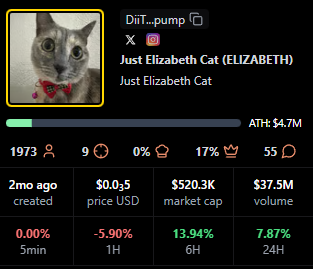
https://pump.fun/coin/DiiTPZdpd9t3XorHiuZUu4E1FoSaQ7uGN4q9YkQupump
Cope
Positioning: Older token with a legacy community.
Research Blurb: Project details unclear at time of writing. Despite low recent averages, it holds a sizable base and meaningful fees.
Quick Facts: Chain = Solana, Status = —, Age = 1y ago, Avg Viewers = 9.
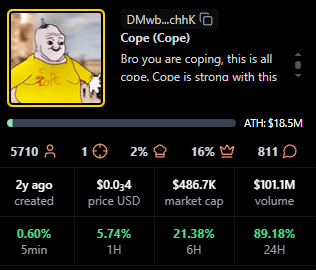
https://pump.fun/coin/DMwbVy48dWVKGe9z1pcVnwF3HLMLrqWdDLfbvx8RchhK
BUN COIN
Positioning: Currently live, strong peaks relative to size.
Research Blurb: Project details unclear at time of writing. Live streaming status often coincides with bursts of activity that lift fees quickly.
Quick Facts: Chain = Solana, Status = Live, Peak Viewers = 897, Avg Viewers = 71.
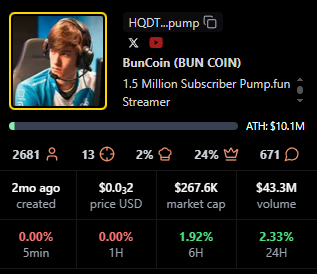
https://pump.fun/coin/HQDTzNa4nQVetoG6aCbSLX9kcH7tSv2j2sTV67Etpump
Fapcoin
Positioning: Newer token with targeted pushes.
Research Blurb: Project details unclear at time of writing. Recent age and meaningful KOL support suggest orchestrated activations that can move fees.
Quick Facts: Chain = Solana, Status = 13d ago, Age = 18d ago, KOLs = 22.

https://pump.fun/coin/8vGr1eX9vfpootWiUPYa5kYoGx9bTuRy2Xc4dNMrpump
FTP
Positioning: Live status with solid mid-table view metrics.
Research Blurb: Project details unclear at time of writing. Peaks and consistent averages suggest an active audience during live windows.
Quick Facts: Chain = Solana, Status = Live, Peak Viewers = 496, Avg Viewers = 35.

https://pump.fun/coin/J2eaKn35rp82T6RFEsNK9CLRHEKV9BLXjedFM3q6pump
Signals From Fees Earned: Patterns to Watch
Fees Earned often rise with peak and average viewers, but timing matters. Several tokens here show concentrated peaks with modest averages, which implies that well timed announcements or coordinated segments can still produce high fees.
Age is not a blocker for this board. Newer tokens like Fapcoin appear due to focused activity, while older names such as Cope persist by mobilizing established holders. KOL count appears additive rather than decisive, with KIND standing out as the KOL leader.
For creators, Fees Earned reflects whether livestream moments translate into on-chain action. Design streams around clear calls to action, align announcements with segments that drive peaks, then sustain momentum with repeatable formats that stabilize averages.
For traders, Fees Earned complements market cap, viewers, and age. Look for projects that combine rising averages with consistent peaks, because those patterns suggest repeatable engagement rather than single event spikes.
TV Live is a fast way to follow real-time crypto market news, creator launches, and token breakdowns as they happen. You get context on stream dynamics, audience behavior, and on-chain activity while the story evolves.
CTA: Watch TV Live for real-time crypto market news →TV Live Link
CTA: Follow and enable alerts → TV Live
Token Metrics is trusted for transparent data, crypto analytics, on-chain ratings, and investor education. Our platform offers cutting-edge signals and market research to empower your crypto investing decisions.
What is the best way to track Pump.fun livestream leaders?
Tracking Pump.fun livestream leaders starts with the scanner views that show Fees Earned, viewers, and KOLs side by side, paired with live coverage so you see data and narrative shifts together.
Do higher fees predict higher market cap or sustained viewership?
Higher Fees Earned does not guarantee higher market cap or sustained viewership, it indicates conversion in specific windows, while longer term outcomes still depend on execution and community engagement.
How often do these rankings change?
Rankings can change quickly during active cycles, the entries shown here reflect the exact time of the screenshot.
Next Steps
Disclosure
This article is educational content. Cryptocurrency involves risk. Always do your own research.

Cryptocurrency investing intimidates many potential investors. The technical jargon, overwhelming number of tokens, security concerns, and stories of people losing fortunes create paralysis. You know crypto represents an opportunity, but where do you even begin?
Token Metrics AI Indices eliminate these barriers by providing a simple, secure pathway into cryptocurrency investing. Whether you've never bought crypto before or you're transitioning from traditional investments, this comprehensive beginner's guide walks you through everything needed to start investing successfully in just 30 minutes.
No technical expertise required. No complicated wallet setup. No endless research into thousands of tokens. Just straightforward steps that get you invested intelligently and positioned for long-term wealth creation.
Before diving into the how-to, let's establish a simple understanding of what you're investing in.
Think of crypto indices like a basket containing multiple cryptocurrencies. Instead of buying Bitcoin or Ethereum individually, you buy a pre-made collection of several carefully selected digital assets. This is similar to how traditional stock index funds like the S&P 500 contain hundreds of companies rather than forcing you to pick individual stocks.
Token Metrics creates these baskets using artificial intelligence that analyzes thousands of cryptocurrencies and selects the best ones based on comprehensive data. The AI acts like a team of expert analysts working 24/7, constantly monitoring market conditions and adjusting your portfolio to maximize returns while managing risk.
When you invest in a Token Metrics index, you're essentially hiring sophisticated AI technology to build and manage your crypto portfolio professionally. You get instant diversification across multiple tokens, automatic rebalancing when market conditions change, protection from common investing mistakes, and access to opportunities you'd never find independently.
The beauty of this approach is simplicity. You don't need to understand blockchain technology, read complicated whitepapers, or analyze trading charts. The AI handles complexity while you focus on your life and watch your investment grow.
For beginners, indices provide the perfect entry point—immediate diversification, professional management, emotion-free investing, and minimal time commitment. You can start small, learn gradually, and scale up as you become comfortable.
Ready to begin? Follow this simple roadmap to go from complete beginner to invested in under 30 minutes.
After your initial investment, understanding ongoing management helps you stay invested successfully.
Token Metrics indices rebalance regularly as market conditions change. You'll receive notifications when adjustments are recommended. These typically occur weekly, bi-weekly, or monthly. Follow the recommendations by making small adjustments—usually just a few minutes to execute.
Check your portfolio monthly rather than daily. Cryptocurrency volatility means dramatic day-to-day swings. Monthly reviews allow tracking overall trajectory without getting caught up in noise. Token Metrics provides performance tracking tools showing returns over various periods and comparing to benchmarks.
Occasionally rebalance your overall portfolio allocation. If crypto has grown from 10% to 25% of your total investments, consider taking profits to rebalance back to your target. This ensures you don't become overexposed during market euphoria.
New investors often have the same questions and concerns. Here are straightforward answers.
"Is crypto investing safe?"
Cryptocurrency carries risk like all investments. However, indices are far safer than buying random tokens. Token Metrics' AI vetting filters out scams, diversification reduces risk, and professional management protects against emotional mistakes.
"What if I lose everything?"
This is why you only invest money you can afford to lose. Crypto indices are diversified across multiple assets, making total loss extremely unlikely. Individual tokens can fail, but portfolios of 10-30 carefully selected tokens provide resilience.
"How much can I make?"
Token Metrics indices have historically delivered returns significantly exceeding Bitcoin and Ethereum. Conservative indices might return 100-200% annually during bull markets. Aggressive indices could deliver 300-500%+. Bear markets may see negative returns—long-term holding is essential.
"What about taxes?"
Cryptocurrency transactions trigger capital gains taxes in most jurisdictions. Keep records of all transactions. Token Metrics provides transaction tracking to simplify tax preparation. Consult a tax professional for personalized guidance.
"Do I need a special wallet?"
For beginners with smaller amounts, keeping crypto on a reputable exchange is acceptable. As holdings grow beyond $10,000, consider a hardware wallet for additional security.
"Can I start with just $100?"
Yes! While larger amounts generate more absolute returns, you can start with any amount. Use small initial investments to learn and build confidence.
After 30 days, continue monthly reviews, execute recommended rebalancing, and stick to your dollar-cost averaging schedule. Successful investing is about consistency and discipline, not constant activity.
Cryptocurrency investing doesn't require technical expertise, complicated processes, or endless time commitment. Token Metrics AI Indices make professional-grade crypto investing accessible to anyone willing to follow a simple, proven system.
You've learned what indices are, why they're perfect for beginners, and exactly how to get started in 30 minutes. You understand ongoing management, have answers to common concerns, and possess a 30-day action plan for success.
The only thing remaining is action. Every day you delay is a day you're not participating in one of the most significant wealth creation opportunities of our generation. Markets don't wait for perfect timing—they reward those who begin with imperfect action.
Your 30-minute journey to crypto investing starts with a single click. Sign up for Token Metrics' 7-day free trial today, explore the indices, and make your first investment following this guide. Your future self will thank you for taking action now rather than watching from the sidelines as others build life-changing wealth.
The tools are available. The guidance is clear. The opportunity is now. Begin your Token Metrics journey today.

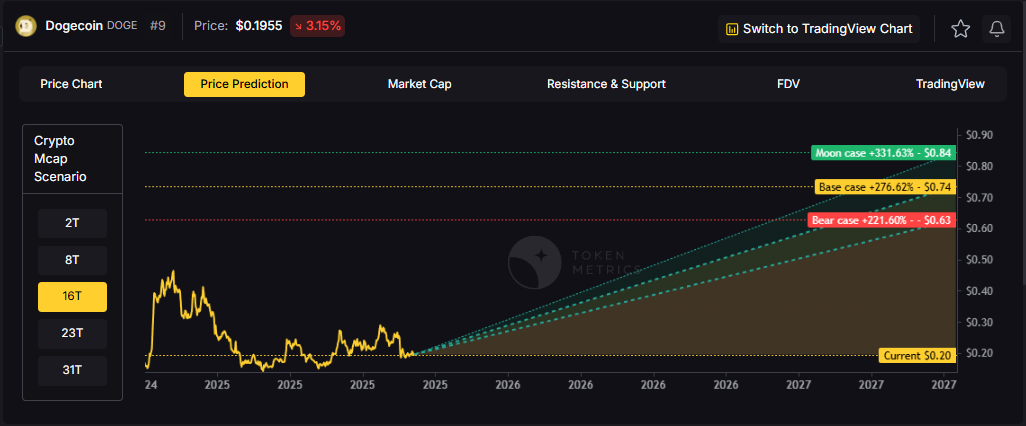
Crypto is transitioning into a broadly bullish regime into 2026 as liquidity improves and adoption deepens.
Regulatory clarity is reshaping the classic four-year cycle, flows can arrive earlier and persist longer as institutions gain confidence. Access and infrastructure continue to mature with ETFs, qualified custody, and faster L2 scaling that reduce frictions for new capital. Real-world integrations expand the surface area for crypto utility, which supports sustained participation across market phases.
This bullish backdrop frames our Dogecoin price prediction scenario work for DOGE. The bands below reflect different total market sizes and DOGE's share dynamics across varying liquidity conditions, providing comprehensive price prediction analysis for investors.

Each band blends cycle analogues and market-cap share math with TA guardrails. Base assumes steady adoption and neutral or positive macro. Moon layers in a liquidity boom. Bear assumes muted flows and tighter liquidity.
TM Agent baseline: Token Metrics lead metric, TM Grade, is 22.65 (Sell), and the trading signal is bearish, indicating short-term downward momentum. Price context: $DOGE is trading around $0.193, rank #9, down about 3.1% in 24 hours and roughly 16% over 30 days. Implication: upside in our price prediction models likely requires a broader risk-on environment and renewed retail or celebrity-driven interest.
Live details: Dogecoin Token Details → https://app.tokenmetrics.com/en/dogecoin
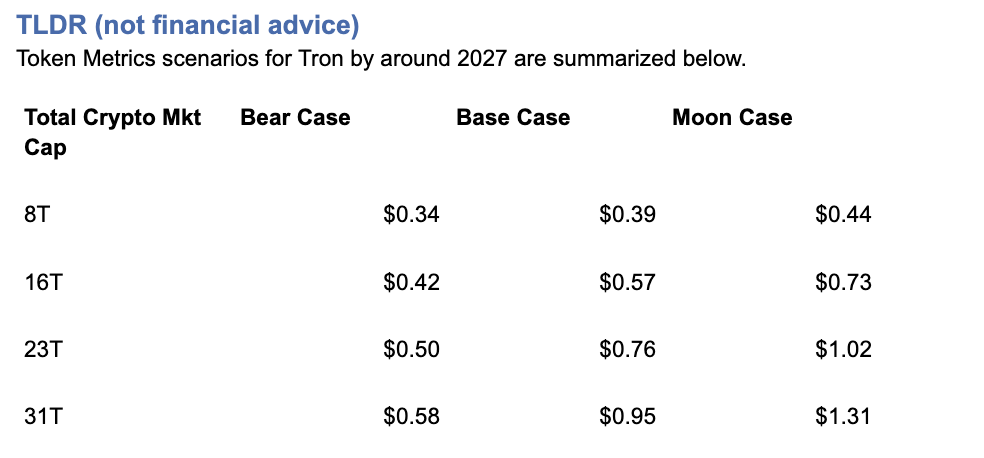
Token Metrics price prediction scenarios span four market cap tiers, each representing different levels of crypto market maturity and liquidity:
At an 8 trillion dollar total crypto market cap, our DOGE price prediction framework projects specific targets in bear, base, and bullish scenarios. The 8T tier reflects conservative market conditions with modest meme coin participation.

Doubling the market to 16 trillion expands the DOGE price prediction range significantly, reflecting increased retail participation and potential celebrity-driven catalysts that historically benefit Dogecoin.
Doubling the market to 16 trillion expands the DOGE price prediction range significantly, reflecting increased retail participation and potential celebrity-driven catalysts that historically benefit Dogecoin.
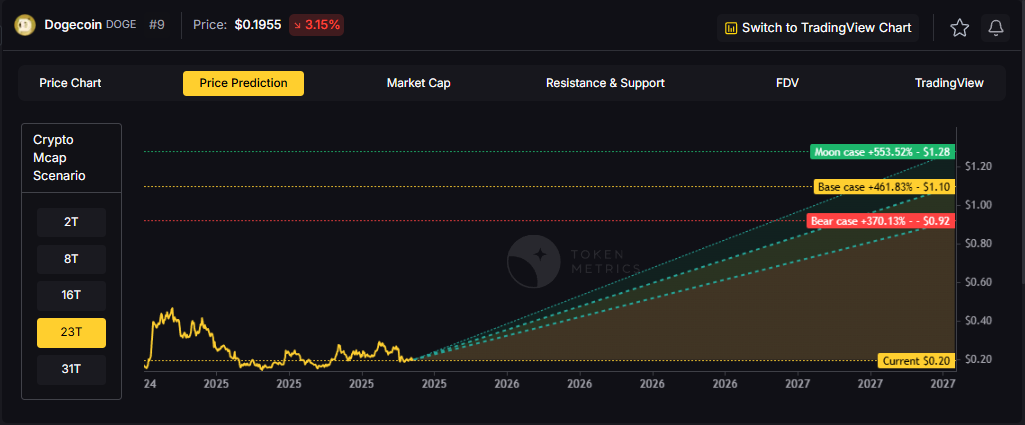
31T Market Cap - DOGE Price Prediction:
In the maximum liquidity scenario of 31 trillion, DOGE price predictions reach their highest potential across all scenarios (bear, base, and moon), with all three bands projecting levels above $1.00 according to our framework.

Each tier in our price prediction framework assumes progressively stronger market conditions, with particular emphasis on retail-driven liquidity and social media sentiment that uniquely impacts meme coin valuations.
Diversification matters. Dogecoin is compelling, yet concentrated bets can be volatile—especially for meme coins where price predictions are heavily influenced by sentiment. Token Metrics Indices hold DOGE alongside the top one hundred tokens for broad exposure to leaders and emerging winners.
Our backtests indicate that owning the full market with diversified indices has historically outperformed both the total market and Bitcoin in many regimes due to diversification and rotation benefits, reducing single-asset risk inherent in meme coin price predictions.
Dogecoin is a peer-to-peer cryptocurrency that began as a meme but has evolved into a widely recognized digital asset used for tipping, payments, and community-driven initiatives. It runs on its own blockchain with inflationary supply mechanics. The token's liquidity and brand awareness create periodic speculative cycles, especially during broad risk-on phases—all critical factors influencing DOGE price predictions.
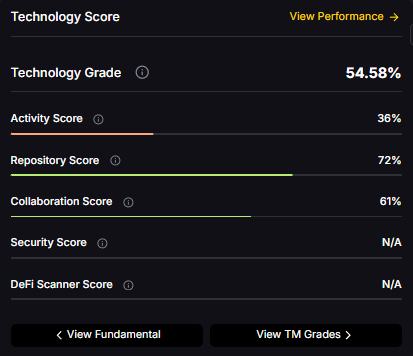
Technology Snapshot from Token Metrics
Technology Grade: 54.58% (Activity 36%, Repository 72%, Collaboration 61%, Security N/A, DeFi Scanner N/A).
Unlock platform-wide intelligence on every major crypto asset. Use code ADVANCED20 at checkout for twenty percent off.
Yes. Multiple tiers in our price prediction framework imply levels above $1.00 by the 2027 horizon, including the 23T Base case and all 31T scenarios (bear, base, and moon). However, achieving this requires the bullish 2026 thesis materializing with strong retail participation and favorable macro conditions. Despite the Sell rating (22.65), the $1 psychological level remains achievable in higher liquidity environments. Not financial advice.
DOGE presents a high-risk, high-volatility investment case with a Sell rating (22.65) and modest technology grade (54.58%). Our price prediction models show potential upside in bullish scenarios, but the outcome depends heavily on adoption, liquidity regime, celebrity influence, retail sentiment, and supply dynamics. Meme coins lack fundamental utility of smart contract platforms, making them speculative plays. Diversify and size positions responsibly. Not financial advice.
Our comprehensive DOGE price prediction framework for 2026-2027 suggests Dogecoin could reach significant levels depending on total crypto market capitalization, with the 23T and 31T scenarios projecting above $1.00 across multiple bands. Current price of $0.193 implies substantial upside potential (400%+ gains to $1) if bullish 2026 conditions materialize. However, the Sell rating (22.65) reflects concerns about fundamentals and current bearish momentum. Not financial advice.
DOGE reaching $10 would require extraordinary market conditions and market capitalization exceeding most realistic scenarios in our price prediction models. At current supply levels, $10 DOGE would imply a market cap surpassing major corporations. While our 31T moon scenarios show substantial upside, $10 appears beyond rational price prediction frameworks without significant supply changes or unprecedented retail mania. Not financial advice.
DOGE has a Sell rating (22.65) indicating Token Metrics does not currently endorse Dogecoin at these levels, despite bullish 2026 macro thesis. Current price of $0.193 is down 16% over 30 days with bearish trading signals. However, if you believe in the 2026 bull market thesis and meme coin comeback, dollar-cost averaging may reduce timing risk. Meme coins are highly speculative—size positions accordingly and consider diversified exposure through indices. Not financial advice.
DOGE receives a Sell rating (22.65) due to weak fundamentals, modest technology grade (54.58%), low development activity (36%), and current bearish momentum—despite the broader bullish 2026 macro thesis. Our price prediction framework shows potential upside in favorable liquidity scenarios, but ratings reflect current conditions and fundamental quality rather than just market sentiment. The rating suggests caution even in bullish environments. Not financial advice.
Dogecoin remains the original and most established meme coin with superior liquidity, exchange listings, and brand recognition versus competitors like Shiba Inu or PEPE. Our price prediction framework suggests DOGE could exceed $1.00 in 23T+ scenarios. However, the Sell rating (22.65) reflects that even among meme coins, DOGE's low technology grade (54.58%) and minimal development activity create concerns. First-mover advantage matters, but newer meme coins may offer higher risk-adjusted returns.
Celebrity influence—particularly from Elon Musk—significantly impacts Dogecoin price predictions and has historically driven major rallies. Our bullish 2026 scenarios assume potential for renewed celebrity-driven interest during risk-on phases. However, this creates unpredictable volatility that price prediction models struggle to capture. The Sell rating (22.65) reflects concerns that celebrity sentiment alone cannot sustain long-term value without fundamental improvements. Not financial advice.
Yes. Our price prediction scenarios are specifically framed around the bullish 2026 thesis, where improving liquidity, institutional participation, and retail FOMO create favorable conditions for meme coins. DOGE's brand recognition and top-10 ranking position it to capture bull market momentum. However, the Sell rating (22.65) and low technology grade (54.58%) suggest DOGE may underperform versus utility tokens. Meme coins tend to outperform in late-stage bull markets driven by retail speculation. Not financial advice.
Key risks that could derail Dogecoin price predictions include: current Sell rating (22.65) indicating weak fundamentals, low technology grade (54.58%) and minimal development activity (36%), inflationary supply creating perpetual selling pressure, lack of utility versus smart contract platforms, regulatory targeting of meme coins, negative celebrity sentiment shifts, competition from newer meme coins, macro liquidity shocks ending the 2026 bull thesis, and excessive speculation leading to retail exhaustion. Not financial advice.
Our price prediction framework suggests DOGE reaching $1.00 is achievable in the 23T base case and all 31T scenarios (bear, base, moon), which could materialize in the bullish 2026-2027 environment. From current price of $0.193, this represents approximately 400%+ gains. However, achieving this requires sustained macro liquidity, retail participation, positive celebrity sentiment, and overcoming the current Sell rating (22.65) concerns. Possible but not guaranteed—manage expectations accordingly. Not financial advice.
Dogecoin price predictions are particularly challenging due to meme coin volatility, celebrity influence unpredictability, and sentiment-driven price action that doesn't follow traditional fundamental analysis. Our scenario-based framework provides structured projections across multiple market cap tiers, but actual outcomes may vary significantly. The Sell rating (22.65) and low technology grade (54.58%) suggest fundamental weaknesses that could limit upside regardless of market conditions. Use price predictions as educational frameworks, not guarantees. Not financial advice.

• Track live grades and signals: Token Details
• Join Indices Early Access
• Want exposure Buy DOGE on MEXC
Disclosure
Educational purposes only, not financial advice. Crypto is volatile, do your own research and manage risk.

The crypto market is shifting toward a broadly bullish regime into 2026 as liquidity improves and risk appetite normalizes.
Regulatory clarity across major regions is reshaping the classic four-year cycle, flows can arrive earlier and persist longer. Institutional access keeps expanding through ETFs and qualified custody, while L2 scaling and real-world integrations broaden utility. Infrastructure maturity lowers frictions for capital, which supports deeper order books and more persistent participation.
This bullish backdrop frames our Tron price prediction scenario work for TRX. The bands below map potential outcomes to different total crypto market sizes, providing comprehensive price prediction analysis for investors navigating the stablecoin transfer and payments-focused blockchain space.
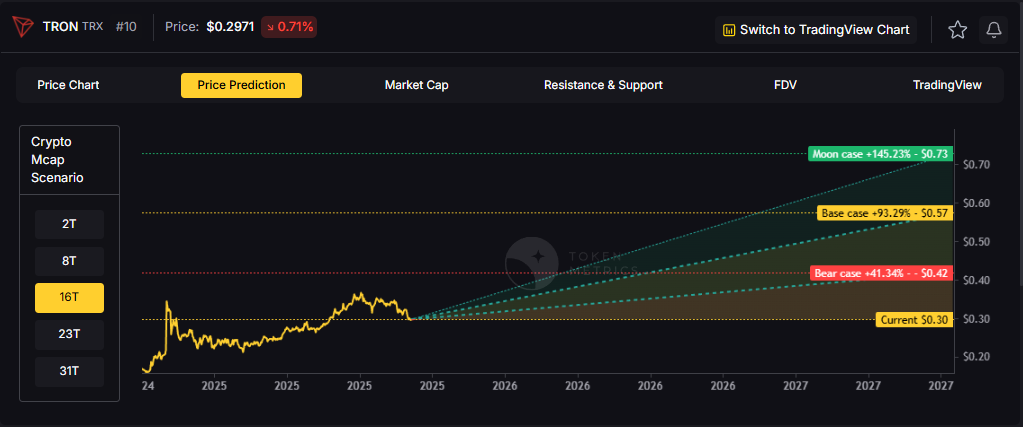
Current price: $0.2971.
Each band blends cycle analogues and market-cap share math with TA guardrails. Base assumes steady adoption and neutral or positive macro. Moon layers in a liquidity boom. Bear assumes muted flows and tighter liquidity.
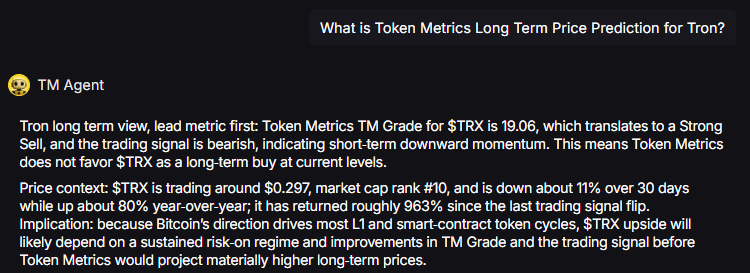
TM Agent baseline: Token Metrics TM Grade for $TRX is 19.06, which translates to a Strong Sell, and the trading signal is bearish, indicating short-term downward momentum. Price context: $TRX is trading around $0.297, market cap rank #10, and is down about 11% over 30 days while up about 80% year-over-year, it has returned roughly 963% since the last trading signal flip. Despite strong historical returns, current price prediction models reflect caution.
Live details: Tron Token Details → https://app.tokenmetrics.com/en/tron
Buy TRX: https://www.mexc.com/acquisition/custom-sign-up?shareCode=mexc-2djd4
Token Metrics price prediction scenarios span four market cap tiers, each representing different levels of crypto market maturity and liquidity:
8T Market Cap - TRX Price Prediction:
At an 8 trillion dollar total crypto market cap, our TRX price prediction framework projects specific targets in bear, base, and bullish scenarios. The 8T tier reflects conservative market conditions with steady stablecoin transfer adoption.
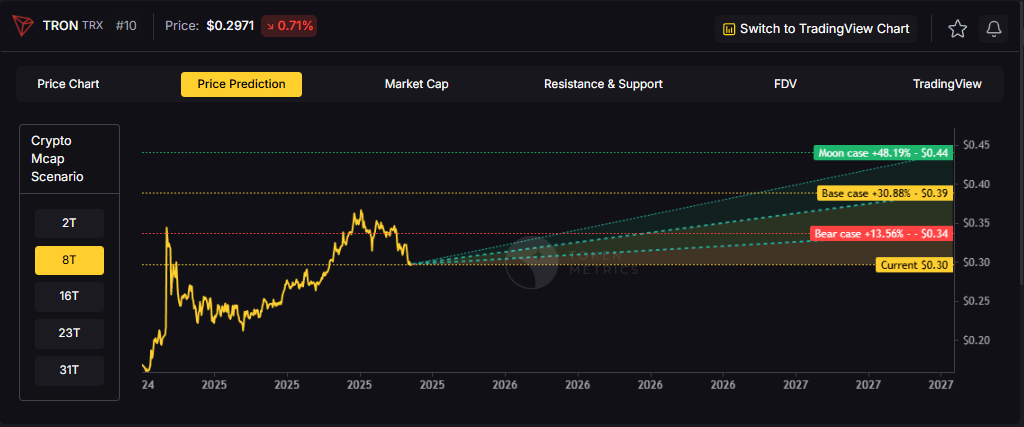
16T Market Cap - TRX Price Prediction:
Doubling the market to 16 trillion expands the TRX price prediction range significantly, reflecting increased institutional stablecoin usage and payments adoption that benefit Tron's high-throughput, low-cost infrastructure.
23T Market Cap - TRX Price Prediction:
At 23 trillion total crypto market cap, the price prediction scenarios show substantial upside potential, with the moon case projecting $1.02—achieving the psychologically important $1.00 milestone for TRX holders.
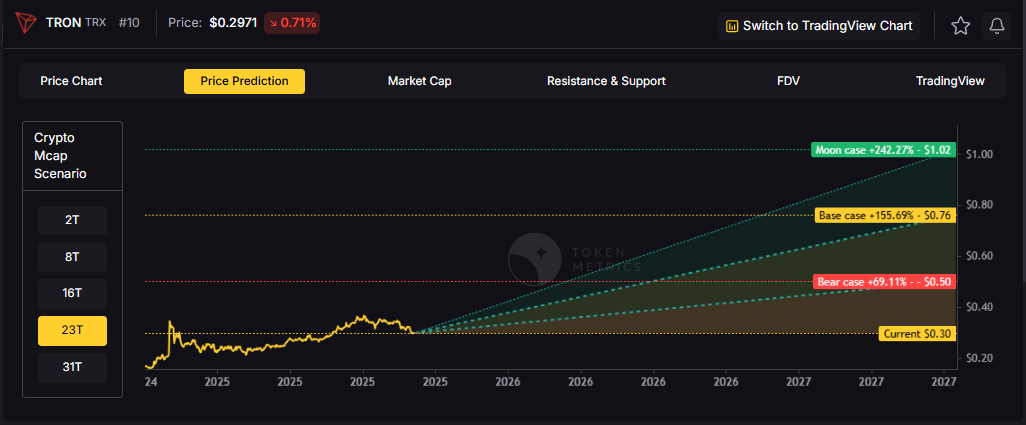
Each tier in our price prediction framework assumes progressively stronger market conditions, with particular emphasis on stablecoin transfer volume and payments use cases that uniquely position Tron in the blockchain ecosystem.
Diversification matters. Tron is compelling, yet concentrated bets can be volatile—especially when price predictions carry Strong Sell ratings despite bullish macro conditions. Token Metrics Indices hold TRX alongside the top one hundred tokens for broad exposure to leaders and emerging winners.
Our backtests indicate that owning the full market with diversified indices has historically outperformed both the total market and Bitcoin in many regimes due to diversification and rotation benefits, reducing single-asset risk.
Get early access: https://docs.google.com/forms/d/1AnJr8hn51ita6654sRGiiW1K6sE10F1JX-plqTUssXk/preview
If your editor supports embeds, place a form embed here. Otherwise, include the link above as a button labeled Join Indices Early Access.
Tron is a smart-contract blockchain focused on low-cost, high-throughput transactions and cross-border settlement. The network supports token issuance and a broad set of dApps, with an emphasis on stablecoin transfer volume and payments—critical factors that influence TRX price predictions.
TRX is the native asset that powers fees and staking for validators and delegators within the network. Developers and enterprises use the chain for predictable costs and fast finality, which supports consumer-facing use cases. Tron has become a dominant network for USDT (Tether) transfers, creating organic demand for TRX that impacts long-term price prediction trajectories.
Unlock platform-wide intelligence on every major crypto asset. Use code ADVANCED20 at checkout for twenty percent off.
Start with Advanced today → https://www.tokenmetrics.com/token-metrics-pricing
Yes. The 23T moon case in our price prediction framework shows $1.02 and the 31T moon case shows $1.31, which imply a path to $1 in higher-liquidity regimes. From current price of $0.2971, this represents approximately 240%+ gains. However, achieving this requires the bullish 2026 thesis materializing with strong stablecoin adoption and overcoming the current Strong Sell rating (19.06). Not financial advice.
TRX presents a complex investment case with a Strong Sell rating (19.06) despite impressive historical returns (80% YoY, 963% since last signal flip). Our price prediction models show potential upside to $1.02-$1.31 in bullish scenarios, but outcome depends heavily on adoption, liquidity regime, competition, regulatory environment, and supply dynamics. The stablecoin transfer use case provides organic demand, but fundamental concerns reflected in the Strong Sell rating suggest caution. Diversify and size positions responsibly. Not financial advice.
Our comprehensive TRX price prediction framework for 2026-2027 suggests Tron could reach $1.02 in the 23T moon scenario and $1.31 in the 31T moon scenario, representing significant upside from current $0.2971 price. Base case scenarios across market cap tiers provide more conservative targets. Despite the bullish 2026 macro thesis and strong stablecoin utility, the Strong Sell rating (19.06) and bearish trading signal indicate current fundamental concerns. Not financial advice.
TRX has a Strong Sell rating (19.06) indicating Token Metrics does not endorse Tron at current levels, despite bullish 2026 macro conditions and 80% YoY gains. Current price of $0.2971 is down 11% over 30 days with bearish trading signals. However, historical outperformance (963% since last signal flip) and stablecoin transfer utility create a paradox. If you believe in the 2026 bull thesis and Tron's stablecoin dominance, dollar-cost averaging may reduce timing risk. Consider diversified exposure through indices. Not financial advice.
TRX receives a Strong Sell rating (19.06) based on current fundamental analysis, technical indicators, and valuation metrics—despite impressive historical performance (80% YoY, 963% since last signal flip). Ratings reflect forward-looking risk assessment including regulatory concerns, centralization issues, reputational factors, and competitive threats. Our price prediction framework shows potential upside in favorable scenarios, but the Strong Sell rating suggests significant risks that could prevent achieving bullish targets. Past performance doesn't guarantee future results. Not financial advice.
Tron has become the dominant network for USDT (Tether) transfers due to extremely low fees and fast settlement. This creates organic demand for TRX as users need the native token for transaction fees. Our price prediction models assume continued growth in stablecoin transfer volume, which supports base case scenarios. The 23T and 31T price predictions of $1.02-$1.31 factor in sustained stablecoin dominance. However, competition from other low-cost chains and regulatory scrutiny on Tether operations represent risks. Not financial advice.
TRX reaching $2 would exceed our current price prediction models' highest scenario of $1.31 (31T moon case). From current $0.2971, $2 represents approximately 570%+ gains. This would require extraordinary market conditions beyond the 31T total crypto market cap tier, exceptional stablecoin adoption acceleration, and overcoming significant fundamental concerns reflected in the Strong Sell rating (19.06). While possible in extreme bull scenarios, $2 appears beyond rational price prediction frameworks. Not financial advice.
Key risks that could derail Tron price predictions include: Strong Sell rating (19.06) indicating severe fundamental concerns, regulatory actions targeting Tron network or founder Justin Sun, centralization concerns in validator economics, regulatory scrutiny on Tether/USDT operations affecting transfer volumes, competitive displacement from Solana/BNB Chain for stablecoin transfers, reputational issues, macro liquidity shocks ending 2026 bull thesis, and potential security vulnerabilities. Despite strong utility, these risks warrant careful position sizing. Not financial advice.
Tron's price prediction framework suggests $0.30-$1.31 across scenarios, positioning it as a specialized payments and stablecoin transfer network. Compared to Ethereum's dominance and Solana's speed, Tron differentiates through extremely low fees and USDT transfer volume leadership. However, the Strong Sell rating (19.06) reflects concerns that this niche may not sustain long-term value versus more decentralized, diversified platforms. Tron trades at rank #10, indicating established but controversial market position. Not financial advice.
Yes. Our price prediction scenarios are specifically framed around the bullish 2026 thesis, where improving liquidity, institutional participation, and stablecoin adoption create favorable conditions. TRX's low-fee infrastructure and USDT dominance position it to capture bull market momentum in payments use cases. However, the Strong Sell rating (19.06) and bearish momentum suggest TRX may underperform versus fundamentally stronger tokens. Muted base case projections reflect this tension between macro tailwinds and micro concerns. Not financial advice.
The $1 target appears achievable in our price prediction framework's 23T moon case ($1.02) and 31T scenarios ($1.31). From current $0.2971, this represents approximately 240%+ gains requiring sustained stablecoin adoption, bullish macro conditions materializing, and overcoming Strong Sell rating concerns. Historical volatility (963% returns since last signal flip) demonstrates TRX's ability to deliver explosive gains, but fundamental weaknesses create significant uncertainty. Possible but high-risk—manage expectations accordingly. Not financial advice.
For TRX to reach our price prediction targets of $1.02-$1.31, several catalysts must materialize: (1) continued dominance in USDT stablecoin transfers, (2) bullish 2026 macro conditions with improving liquidity, (3) addressing regulatory concerns around Tron and Justin Sun, (4) improving TM Grade from Strong Sell (19.06) territory, (5) institutional adoption of Tron for cross-border payments, (6) successful competition against Solana/BNB Chain, and (7) maintaining low-fee advantage as scaling solutions proliferate. The Strong Sell rating suggests these catalysts aren't currently materializing at required pace.
Track live grades and signals: Token Details → https://app.tokenmetrics.com/en/tron
Join Indices Early Access: https://docs.google.com/forms/d/1AnJr8hn51ita6654sRGiiW1K6sE10F1JX-plqTUssXk/preview
Want exposure Buy TRX on MEXC → https://www.mexc.com/acquisition/custom-sign-up?shareCode=mexc-2djd4
Disclosure
Educational purposes only, not financial advice. Crypto is volatile, do your own research and manage risk.

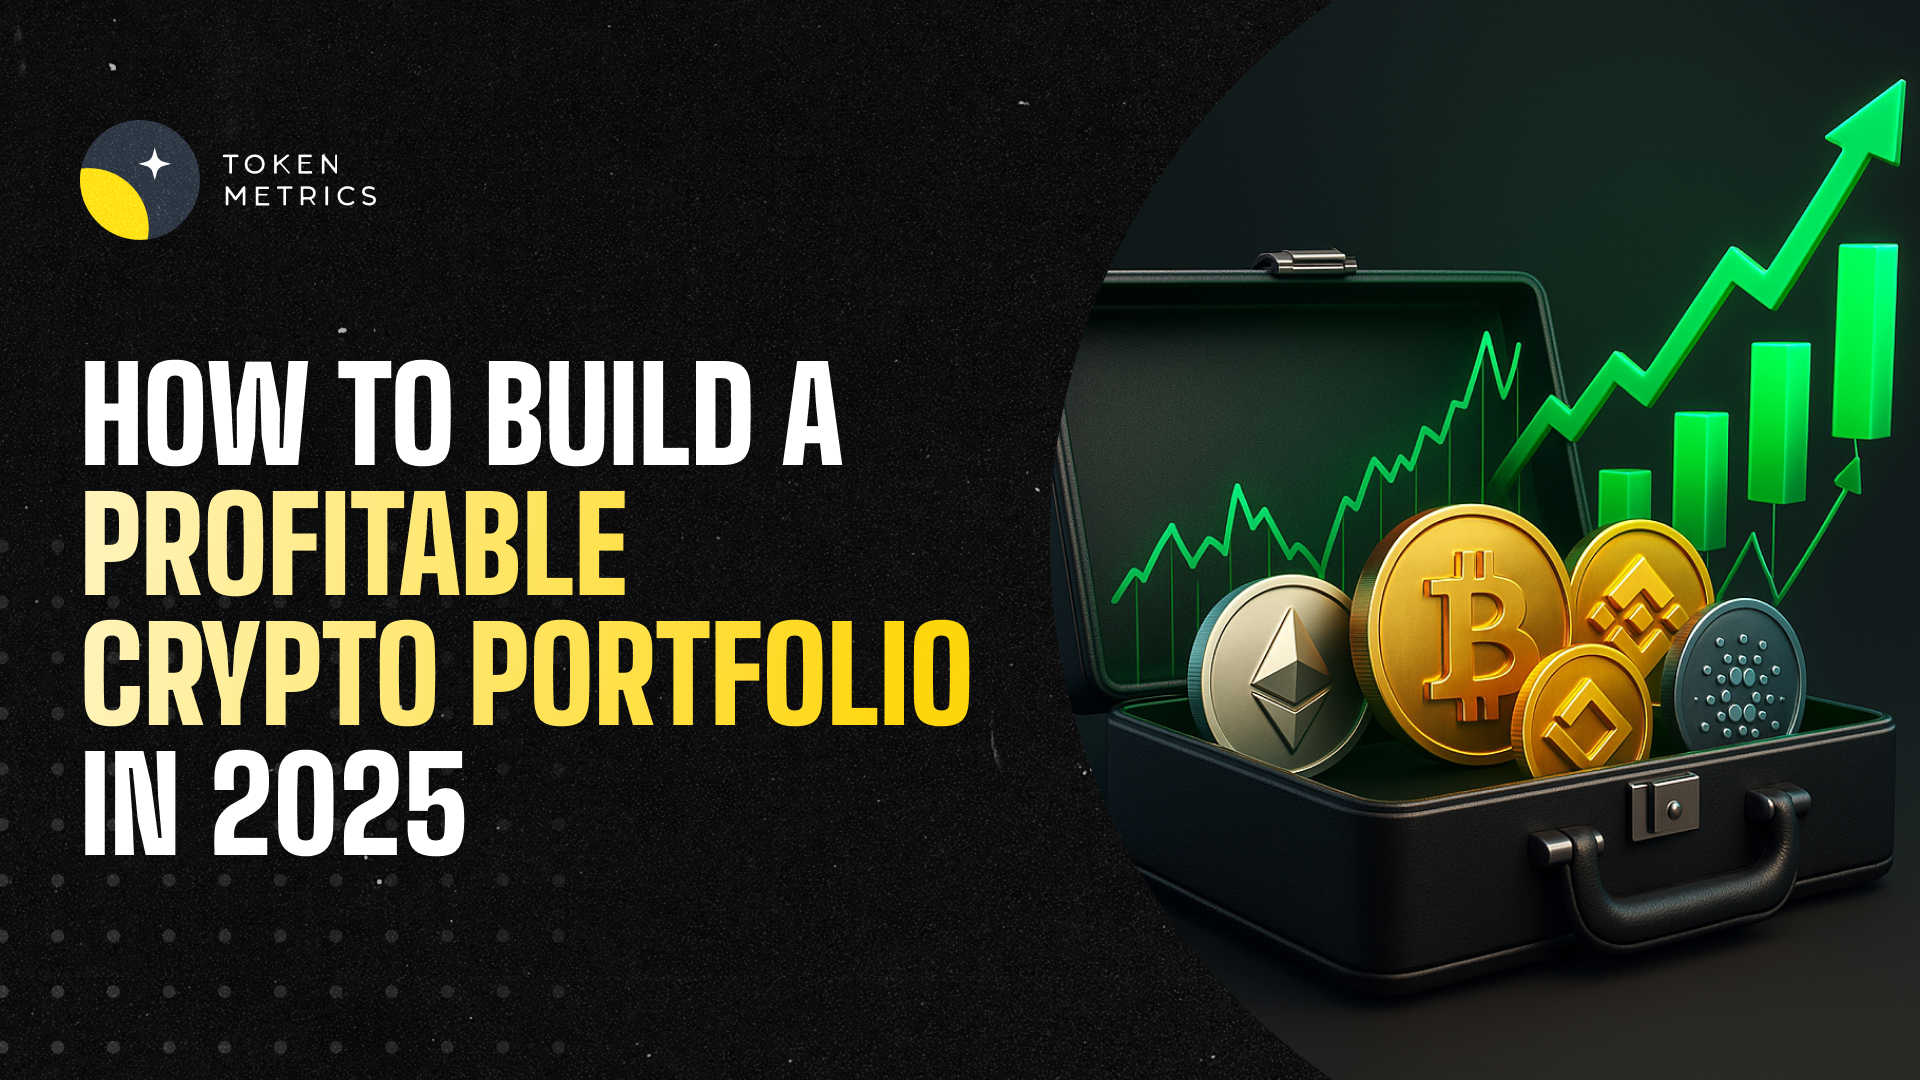
The cryptocurrency market presents unprecedented wealth-building opportunities, but it also poses significant challenges.
With thousands of tokens competing for investor attention and market volatility that can erase gains overnight, success in crypto investing requires more than luck—it demands a strategic, data-driven approach.
Token Metrics AI Indices have emerged as a game-changing solution for investors seeking to capitalize on crypto's growth potential while managing risk effectively.
This comprehensive guide explores how to leverage these powerful tools to build, manage, and optimize your cryptocurrency portfolio for maximum returns in 2025 and beyond.
The traditional approach to crypto investing involves countless hours of research, technical analysis, and constant market monitoring.
For most investors, this proves unsustainable.
Token Metrics solves this challenge by offering professionally managed, AI-driven index portfolios that automatically identify winning opportunities and rebalance based on real-time market conditions.
What makes Token Metrics indices unique is their foundation in machine learning technology.
The platform analyzes over 6,000 cryptocurrencies daily, processing more than 80 data points per asset including technical indicators, fundamental metrics, on-chain analytics, sentiment data, and exchange information.
This comprehensive evaluation far exceeds what individual investors can accomplish manually.
The indices employ sophisticated AI models including gradient boosting decision trees, recurrent neural networks, random forests, natural language processing algorithms, and anomaly detection frameworks.
These systems continuously learn from market patterns, adapt to changing conditions, and optimize portfolio allocations to maximize risk-adjusted returns.
Token Metrics offers a diverse range of indices designed to serve different investment objectives, risk tolerances, and market outlooks.
Understanding these options is crucial for building an effective crypto portfolio.
Conservative Indices: Stability and Long-Term Growth
For investors prioritizing capital preservation and steady appreciation, conservative indices focus on established, fundamentally sound cryptocurrencies with proven track records.
These indices typically allocate heavily to Bitcoin and Ethereum while including select large-cap altcoins with strong fundamentals.
The Investor Grade Index exemplifies this approach, emphasizing projects with solid development teams, active communities, real-world adoption, and sustainable tokenomics.
This index is ideal for retirement accounts, long-term wealth building, and risk-averse investors seeking exposure to crypto without excessive volatility.
Balanced Indices: Growth with Measured Risk
Balanced indices strike a middle ground between stability and growth potential.
These portfolios combine major cryptocurrencies with promising mid-cap projects that demonstrate strong technical momentum and fundamental strength.
The platform's AI identifies tokens showing positive divergence across multiple indicators—rising trading volume, improving developer activity, growing social sentiment, and strengthening technical patterns.
Balanced indices typically rebalance weekly or bi-weekly, capturing emerging trends while maintaining core positions in established assets.
Aggressive Growth Indices: Maximum Upside Potential
For investors comfortable with higher volatility in pursuit of substantial returns, aggressive growth indices target smaller-cap tokens with explosive potential.
These portfolios leverage Token Metrics' Trader Grade system to identify assets with strong short-term momentum and technical breakout patterns.
Aggressive indices may include DeFi protocols gaining traction, Layer-1 blockchains with innovative technology, AI tokens benefiting from market narratives, and memecoins showing viral adoption patterns.
While risk is higher, the potential for 10x, 50x, or even 100x returns makes these indices attractive for portfolio allocation strategies that embrace calculated risk.
Sector-Specific Indices: Thematic Investing
Token Metrics offers specialized indices targeting specific cryptocurrency sectors, allowing investors to align portfolios with their market convictions and thematic beliefs.
• DeFi Index: Focuses on decentralized finance protocols including lending platforms, decentralized exchanges, yield aggregators, and synthetic asset platforms.
• Layer-1 Index: Concentrates on base-layer blockchains competing with Ethereum, including Solana, Avalanche, Cardano, Polkadot, and emerging ecosystems.
• AI and Machine Learning Index: Targets tokens at the intersection of artificial intelligence and blockchain technology.
• Memecoin Index: Contrary to traditional wisdom dismissing memecoins as purely speculative, Token Metrics recognizes that community-driven tokens can generate extraordinary returns.
This index uses AI to identify memecoins with genuine viral potential, active communities, and sustainable momentum before they become mainstream.
Success with Token Metrics indices requires more than simply choosing an index—it demands a comprehensive portfolio strategy tailored to your financial situation, goals, and risk tolerance.
Step 1: Assess Your Financial Profile
Begin by honestly evaluating your investment capacity, time horizon, and risk tolerance.
Ask yourself critical questions: How much capital can I allocate to crypto without compromising financial security? What is my investment timeline—months, years, or decades? How would I react emotionally to a 30% portfolio drawdown? What returns do I need to achieve my financial goals?
Your answers shape your portfolio construction.
Conservative investors with shorter timelines should emphasize stable indices, while younger investors with longer horizons can embrace more aggressive strategies.
Step 2: Determine Optimal Allocation Percentages
Financial advisors increasingly recommend including cryptocurrency in diversified portfolios, but the appropriate allocation varies significantly based on individual circumstances.
• Conservative Allocation (5-10% of portfolio): Suitable for investors approaching retirement or with low risk tolerance. Focus 80% on conservative indices, 15% on balanced indices, and 5% on sector-specific themes you understand deeply.
• Moderate Allocation (10-20% of portfolio): Appropriate for mid-career professionals building wealth. Allocate 50% to conservative indices, 30% to balanced indices, and 20% to aggressive growth or sector-specific indices.
• Aggressive Allocation (20-30%+ of portfolio): Reserved for younger investors with high risk tolerance and long time horizons. Consider 30% conservative indices for stability, 30% balanced indices for steady growth, and 40% split between aggressive growth and thematic sector indices.
Step 3: Implement Dollar-Cost Averaging
Rather than investing your entire allocation at once, implement a dollar-cost averaging strategy over 3-6 months.
This approach reduces timing risk and smooths out entry prices across market cycles.
For example, if allocating $10,000 to Token Metrics indices, invest $2,000 monthly over five months.
This strategy proves particularly valuable in volatile crypto markets where timing the perfect entry proves nearly impossible.
Step 4: Set Up Automated Rebalancing
Token Metrics indices automatically rebalance based on AI analysis, but you should also establish personal portfolio rebalancing rules.
Review your overall allocation quarterly and rebalance if any index deviates more than 10% from your target allocation.
If aggressive growth indices perform exceptionally well and grow from 20% to 35% of your crypto portfolio, take profits and rebalance back to your target allocation.
This disciplined approach ensures you systematically lock in gains and maintain appropriate risk levels.
Step 5: Monitor Performance and Adjust Strategy
While Token Metrics indices handle day-to-day portfolio management, you should conduct quarterly reviews assessing overall performance, comparing returns to benchmarks like Bitcoin and Ethereum, evaluating whether your risk tolerance has changed, and considering whether emerging market trends warrant allocation adjustments.
Use Token Metrics' comprehensive analytics to track performance metrics including total return, volatility, Sharpe ratio, maximum drawdown, and correlation to major cryptocurrencies.
These insights inform strategic decisions about continuing, increasing, or decreasing exposure to specific indices.
Once comfortable with basic index investing, consider implementing advanced strategies to enhance returns and manage risk more effectively.
Tactical Overweighting
While maintaining core index allocations, temporarily overweight specific sectors experiencing favorable market conditions.
During periods of heightened interest in AI, increase allocation to the AI and Machine Learning Index by 5-10% at the expense of other sector indices.
Return to strategic allocation once the catalyst dissipates.
Combining Indices with Individual Tokens
Use Token Metrics indices for 70-80% of your crypto allocation while dedicating 20-30% to individual tokens identified through the platform's Moonshots feature.
This hybrid approach provides professional management while allowing you to pursue high-conviction opportunities.
Market Cycle Positioning
Adjust index allocations based on broader market cycles.
During bull markets, increase exposure to aggressive growth indices.
As conditions turn bearish, shift toward conservative indices with strong fundamentals.
Token Metrics' AI Indicator provides valuable signals for market positioning.
Even with sophisticated AI-driven indices, cryptocurrency investing carries substantial risks.
Implement robust risk management practices to protect your wealth.
Diversification Beyond Crypto
Never allocate so much to cryptocurrency that a market crash would devastate your financial position.
Most financial advisors recommend limiting crypto exposure to 5-30% of investment portfolios depending on age and risk tolerance.
Maintain substantial allocations to traditional assets—stocks, bonds, real estate—that provide diversification and stability.
Position Sizing and Security
Consider implementing portfolio-level stop-losses if your crypto allocation declines significantly from its peak.
Use hardware wallets or secure custody solutions for significant holdings.
Implement strong security practices including two-factor authentication and unique passwords.
Tax Optimization
Cryptocurrency taxation typically involves capital gains taxes on profits.
Consult tax professionals to optimize your strategy through tax-loss harvesting and strategic rebalancing timing.
Token Metrics' transaction tracking helps maintain accurate records for tax reporting.
Several factors distinguish Token Metrics indices from alternatives and explain their consistent outperformance.
Token Metrics indices respond to market changes in real-time rather than waiting for scheduled monthly or quarterly rebalancing.
This responsiveness proves crucial in crypto markets where opportunities can appear and disappear rapidly.
The platform's AI evaluates dozens of factors simultaneously—technical patterns, fundamental strength, on-chain metrics, sentiment analysis, and exchange dynamics.
This comprehensive approach identifies tokens that traditional indices would miss.
The AI continuously learns from outcomes, improving predictive accuracy over time.
Models that underperform receive reduced weighting while successful approaches gain influence, creating an evolving system that adapts to changing market dynamics.
Token Metrics' extensive coverage of 6,000+ tokens provides exposure to emerging projects before they gain mainstream attention, positioning investors for maximum appreciation potential.
To illustrate practical application, consider several investor profiles and optimal index strategies.
Profile 1: Conservative 55-Year-Old Preparing for Retirement
Total portfolio: $500,000
Crypto allocation: $25,000 (5%)
Strategy: $20,000 in Investor Grade Index (80%), $4,000 in Balanced Index (16%), $1,000 in DeFi Index (4%)
This conservative approach provides crypto exposure with minimal volatility, focusing on established assets likely to appreciate steadily without risking retirement security.
Profile 2: Moderate 35-Year-Old Building Wealth
Total portfolio: $150,000
Crypto allocation: $30,000 (20%)
Strategy: $12,000 in Investor Grade Index (40%), $9,000 in Balanced Index (30%), $6,000 in Layer-1 Index (20%), $3,000 in Aggressive Growth Index (10%)
This balanced approach captures crypto growth potential while maintaining stability through substantial conservative and balanced allocations.
Profile 3: Aggressive 25-Year-Old Maximizing Returns
Total portfolio: $50,000
Crypto allocation: $15,000 (30%)
Strategy: $4,500 in Investor Grade Index (30%), $3,000 in Balanced Index (20%), $4,500 in Aggressive Growth Index (30%), $3,000 in Memecoin Index (20%)
This aggressive strategy embraces volatility and maximum growth potential, appropriate for younger investors with decades to recover from potential downturns.
Ready to begin building wealth with Token Metrics indices?
Follow this action plan:
• Week 1-2: Sign up for Token Metrics' 7-day free trial and explore available indices, historical performance, and educational resources. Define your investment goals, risk tolerance, and allocation strategy using the frameworks outlined in this guide.
• Week 3-4: Open necessary exchange accounts and wallets. Fund accounts and begin implementing your strategy through dollar-cost averaging. Set up tracking systems and calendar reminders for quarterly reviews.
• Ongoing: Follow Token Metrics' index recommendations, execute rebalancing transactions as suggested, monitor performance quarterly, and adjust strategy as your financial situation evolves.
Cryptocurrency represents one of the most significant wealth-building opportunities in modern financial history, but capturing this potential requires sophisticated approaches that most individual investors cannot implement alone.
Token Metrics AI Indices democratize access to professional-grade investment strategies, leveraging cutting-edge machine learning, comprehensive market analysis, and real-time responsiveness to build winning portfolios.
Whether you're a conservative investor seeking measured exposure or an aggressive trader pursuing maximum returns, Token Metrics provides indices tailored to your specific needs.
The choice between random coin picking and strategic, AI-driven index investing is clear.
One approach relies on luck and guesswork; the other harnesses data, technology, and proven methodologies to systematically build wealth while managing risk.
Your journey to crypto investment success begins with a single decision: commit to a professional, strategic approach rather than speculative gambling.
Token Metrics provides the tools, insights, and management to transform crypto investing from a game of chance into a calculated path toward financial freedom.
Start your 7-day free trial today and discover how AI-powered indices can accelerate your wealth-building journey.
The future of finance is decentralized, intelligent, and accessible—make sure you're positioned to benefit.
Token Metrics stands out as a leader in AI-driven crypto index solutions.
With over 6,000 tokens analyzed daily and indices tailored to every risk profile, the platform provides unparalleled analytics, real-time rebalancing, and comprehensive investor education.
Its commitment to innovation and transparency makes it a trusted partner for building your crypto investment strategy in today's fast-evolving landscape.
Token Metrics indices use advanced AI models to analyze technical, fundamental, on-chain, and sentiment data across thousands of cryptocurrencies.
They construct balanced portfolios that are automatically rebalanced in real-time to adapt to evolving market conditions and trends.
There are conservative, balanced, aggressive growth, and sector-specific indices including DeFi, Layer-1, AI, and memecoins.
Each index is designed for a different investment objective, risk tolerance, and market outlook.
No mandatory minimum is outlined for using Token Metrics indices recommendations.
You can adapt your allocation based on your personal investment strategy, capacity, and goals.
Token Metrics indices are rebalanced automatically based on dynamic AI analysis, but it is recommended to review your overall crypto allocation at least quarterly to ensure alignment with your targets.
Token Metrics provides analytics and index recommendations; investors maintain custody of their funds and should implement robust security practices such as hardware wallets and two-factor authentication.
No investing approach, including AI-driven indices, can guarantee profits.
The goal is to maximize risk-adjusted returns through advanced analytics and professional portfolio management, but losses remain possible due to the volatile nature of crypto markets.
This article is for educational and informational purposes only.
It does not constitute financial, investment, or tax advice.
Cryptocurrency investing carries risk, and past performance does not guarantee future results. Always consult your own advisor before making investment decisions.

The cryptocurrency market has evolved dramatically since Bitcoin's inception in 2009. With over 20,000 digital assets now available and a combined market capitalization exceeding $3 trillion as of 2025, navigating this complex ecosystem has become increasingly challenging for investors.
Traditional approaches to crypto investing often involve painstaking research, constant market monitoring, and the stress of picking individual tokens that may or may not succeed.
Enter crypto indices—a revolutionary approach that simplifies digital asset investing while providing diversification and professional management. Among the leaders in this space is Token Metrics, an AI-powered cryptocurrency research and analytics platform that has transformed how investors access and benefit from the crypto market through its innovative AI indices.
A cryptocurrency index is a curated portfolio of multiple digital assets grouped by strategy, market capitalization, theme, or other specific criteria. Similar to traditional stock market indices like the S&P 500, crypto indices track the performance of a basket of cryptocurrencies, allowing investors to gain broad market exposure without purchasing each token individually.
Crypto indices serve several critical functions in today's digital asset landscape. • They provide instant diversification across multiple tokens
• Reduce the risk associated with single-asset concentration
• Offer professional portfolio management and rebalancing
• Simplify the investment process for both novice and experienced investors
• Provide transparent performance tracking and reporting
The beauty of crypto indices lies in their ability to capture market movements while mitigating the extreme volatility often associated with individual cryptocurrencies.
Rather than betting on a single token, investors can participate in the growth of entire sectors or market segments.
Founded in 2018 and headquartered in Washington, D.C., Token Metrics has established itself as a leading AI-driven cryptocurrency research and analytics platform. The company serves a diverse customer base spanning from crypto fund managers to passive investors across more than 50 countries.
What sets Token Metrics apart is its sophisticated use of artificial intelligence and machine learning to build and manage crypto indices. The platform leverages advanced algorithms to analyze over 6,000 cryptocurrency projects daily, evaluating more than 80 quantitative and qualitative data points for each asset. This comprehensive analysis covers fundamental metrics, technical indicators, on-chain activity, tokenomics, sentiment data, and exchange information.
Token Metrics employs an ensemble of sophisticated machine learning models to power its indices, including:
• Gradient boosting decision trees for pattern recognition
• Recurrent neural networks for time-series predictions
• Random forests for robust classification
• Natural language processing for sentiment analysis
• Anomaly detection frameworks for risk assessment
These AI systems are continuously retrained with fresh data on a weekly basis, learning from past predictions, integrating feedback from trading outcomes, and adapting model weightings as market conditions evolve.
This dynamic approach ensures that Token Metrics indices remain responsive to rapidly changing market dynamics.
Token Metrics indices are model portfolios built using machine learning technology that simplifies and democratizes quality crypto investing and trading. Unlike static index funds, Token Metrics indices offer real-time responsiveness and active management through AI.
The platform analyzes cryptocurrencies using both Trader Grades and Investor Grades. The Trader Grade identifies assets with strong short-term upside momentum, making it ideal for active traders looking to capitalize on near-term opportunities. The Investor Grade, on the other hand, evaluates assets based on fundamentals, code quality, and adoption metrics to identify strong long-term holdings suitable for HODLers and strategic investors.
Real-Time Rebalancing
Unlike traditional indices that rebalance quarterly or monthly, Token Metrics indices can respond in real time to market changes. When sentiment shifts or volatility spikes, the AI can adjust holdings dynamically, reducing exposure to underperforming sectors while increasing allocation to high-potential areas.
Sector-Specific Strategies
Token Metrics offers indices tailored to specific cryptocurrency sectors including memecoins, Layer-1 blockchains, DeFi protocols, AI tokens, and thematic investments. This allows investors to align their portfolio with their conviction in particular market niches.
Multiple Investment Strategies
Whether you're a conservative long-term holder, an aggressive swing trader, or somewhere in between, Token Metrics provides indices designed for different risk tolerances and investment horizons. Each index has performed strongly through rigorous internal testing and real-world market conditions.
Transparent Performance Tracking
Each index provides clear investment guidance, showing all rebalancing transactions and enabling precise performance monitoring. This transparency allows investors to understand exactly how their portfolio is being managed and why specific decisions are made.
One-Click Diversification
With Token Metrics indices, building a winning crypto portfolio is just one click away. The platform eliminates the complexity of researching hundreds of tokens, determining optimal allocations, and executing trades across multiple exchanges.
Diversification and Risk Management
Crypto markets are notoriously volatile, with individual tokens capable of losing 50% or more of their value in days. By spreading investments across multiple carefully selected assets, Token Metrics indices dramatically reduce concentration risk. Research suggests that even a modest 1-3% allocation to crypto indices can historically improve overall portfolio efficiency, enhancing returns while keeping drawdowns manageable.
AI-Driven Decision Making
Human emotions—fear, greed, FOMO—often lead to poor investment decisions. Token Metrics removes emotion from the equation by leveraging data-driven AI analysis. The platform's algorithms process vast amounts of information far beyond human capability, identifying patterns and opportunities that might otherwise be missed.
Time Efficiency
Actively managing a crypto portfolio requires constant monitoring of markets, news, on-chain metrics, and technical indicators. For most investors, this is simply not feasible. Token Metrics indices automate this process, allowing investors to benefit from professional-grade management without dedicating hours daily to market research.
Access to Emerging Opportunities
Through its Moonshots feature, Token Metrics identifies tokens with 10x-100x potential before they hit major exchanges. The platform scans thousands of tokens daily, using AI to highlight daily opportunities that align with specific indices and investment strategies.
Simplified Trading Execution
Token Metrics offers integrated on-chain trading directly from the platform. There's no need to manually copy contract addresses or navigate multiple decentralized exchanges. The "Buy" button provides instant access to execute trades based on index recommendations.
Token Metrics first launched its cryptocurrency indices in August 2020 with 14 different indices leveraging artificial intelligence to build winning investment portfolios. This launch represented a response to overwhelming customer demand for simplified, professional-grade crypto investing tools.
The company's vision was clear: to do for crypto investing what Vanguard did for traditional index funds and ETFs—democratize access to sophisticated investment strategies. By 2022, Token Metrics had refined its indices platform based on extensive testing and customer feedback, continuously improving the AI models and expanding the range of available strategies.
In 2025, Token Metrics continues to innovate with plans to expand sector-specific indices, enhance mobile access for on-the-go portfolio management, and integrate automated trading bots that execute buys and sells based on real-time AI signals. These developments aim to cement Token Metrics' position as the leading platform for AI-powered crypto investing.
Investing through Token Metrics indices is straightforward and accessible to both beginners and experienced traders. Here's how to get started:
Step 1: Create an Account
Visit the Token Metrics platform and sign up for an account. The platform offers various subscription tiers, including a 7-day free trial for new users to explore the indices and other features.
Step 2: Explore Available Indices
Browse through the various indices available on the platform. Each index is designed for specific investment strategies, risk profiles, and market sectors. Review the historical performance, composition, and rebalancing frequency of each index to determine which aligns with your goals.
Step 3: Determine Your Allocation
Decide what percentage of your portfolio you want to allocate to crypto. Financial advisors typically recommend allocating 60% to long-term holds, 20% to sector themes, and 20% to higher-risk moonshots with strict risk management. For conservative investors aged 50-65, incorporating as little as 5% into value indices can improve returns without excessive risk. Moderate risk investors aged 35-50 might allocate up to 15% in balanced indices.
Step 4: Follow the Index Recommendations
Token Metrics indices provide clear, actionable guidance on which tokens to buy, in what proportions, and when to rebalance. You can either manually execute these recommendations or use the platform's integrated trading features for seamless execution.
Step 5: Monitor and Adjust
Regularly monitor your investments through the platform's comprehensive tracking tools. Watch for Trader Grade downgrades or bearish signals, analyze winning and losing patterns, and adjust your strategy as needed. Advanced users can also leverage the Token Metrics API to build custom dashboards or automated trading strategies.
The cryptocurrency investing landscape in 2025 is more sophisticated than ever, and Token Metrics has positioned itself at the forefront of this evolution. Several factors distinguish the platform from competitors:
Proven Track Record
With over seven years in operation and a community of more than 110,000 crypto traders, Token Metrics has demonstrated consistent performance across multiple market cycles, including both bull and bear markets.
Comprehensive Ecosystem
Beyond indices, Token Metrics offers a complete suite of tools including AI chatbot assistance, moonshot discovery, real-time signals and alerts, trading view indicators, analytics platform, and API access for developers. This ecosystem approach provides everything investors need in one place.
Continuous Innovation
Token Metrics continuously evolves its platform based on market developments and user feedback. Recent innovations include the launch of automated trading bots, integration with Dune Analytics for institutional-grade data, and the expansion of mobile capabilities for portfolio management on the go.
Educational Resources
The platform provides extensive educational content through tutorials, videos, webinars, and detailed investment reports covering blockchain technology, cryptocurrency basics, investment strategies, risk management, and market analysis.
While Token Metrics indices offer significant advantages, it's essential to understand that all cryptocurrency investing carries inherent risks. The market remains highly volatile, and past performance does not guarantee future results.
To invest safely through Token Metrics indices, follow these best practices:
• Never invest more than you can afford to lose
• Use a secure wallet for storing your digital assets
• Avoid emotional trading decisions
• Stick to your predetermined investment strategy
• Use alerts to stay informed of significant market moves
• Regularly review and rebalance your portfolio
• Consult with financial advisors for personalized guidance
Remember that Token Metrics provides research and analytics tools but is not a registered investment adviser or broker-dealer. The platform offers informational and educational resources designed to help investors make more informed decisions, but ultimate investment choices remain with the individual investor.
As cryptocurrency markets continue to mature and institutional adoption accelerates, crypto indices are becoming essential tools for portfolio construction. The ability to gain diversified exposure to digital assets through professionally managed, AI-driven strategies addresses one of the primary barriers to crypto adoption: complexity.
Looking ahead, several trends are shaping the future of crypto indices. Increased regulatory clarity will likely lead to more traditional financial institutions offering crypto index products. The integration of DeFi protocols into index strategies will provide additional yield opportunities.
Advanced AI and machine learning capabilities will enable even more sophisticated portfolio optimization. Cross-chain indices will allow seamless exposure across multiple blockchain ecosystems.
Token Metrics is well-positioned to lead this evolution, with planned expansions including automated trading agents that execute strategies 24/7, enhanced sector-specific indices for emerging crypto narratives, improved mobile applications for portfolio management anywhere, and deeper integration with traditional financial platforms for seamless asset allocation.
Cryptocurrency investing in 2025 is no longer about gambling on individual tokens or following influencer recommendations. It's about leveraging data, artificial intelligence, and proven strategies to build resilient, diversified portfolios capable of capturing market upside while managing downside risk.
Token Metrics' AI-powered crypto indices represent a significant advancement in making professional-grade crypto investing accessible to everyone. By combining sophisticated machine learning algorithms with transparent performance tracking and user-friendly interfaces, the platform empowers both novice and experienced investors to navigate the complex crypto landscape with confidence.
Whether you're looking to make your first foray into cryptocurrency or seeking to optimize an existing portfolio, Token Metrics indices offer a compelling solution. The platform's proven track record, continuous innovation, and commitment to democratizing access to advanced investment strategies make it an essential tool for the modern crypto investor.
As the cryptocurrency market continues to evolve and mature, one thing is clear: indices are no longer merely convenient—they're essential tools for developing a well-formed portfolio of digital assets. With Token Metrics leading the way in AI-powered index innovation, investors have the opportunity to participate in the digital asset revolution with the sophistication and strategic approach it demands.
Start your journey with Token Metrics today and discover how AI-powered crypto indices can transform your investment strategy. With a 7-day free trial and comprehensive educational resources, there's never been a better time to explore the future of crypto investing.
Token Metrics stands apart as one of the few platforms offering AI-powered cryptocurrency indices that adapt to real-time market signals. Its holistic, data-backed approach is designed for both new and seasoned investors, offering clarity, transparency, and robust educational support.
Whether your goal is to diversify, stay ahead of trends, or simplify your investing workflow, Token Metrics delivers a comprehensive research and execution hub trusted by investors worldwide.
Token Metrics crypto indices are built using AI and machine learning models that allow real-time rebalancing, active management, and sector-specific strategies. Traditional index funds typically rebalance quarterly or monthly and do not provide exposure to digital assets or utilize AI-driven selection and allocation.
Both novice and experienced investors can use Token Metrics indices. The platform is designed to simplify portfolio construction, offering actionable analytics and automated recommendations suitable for a wide range of investors, from passive holders to active traders.
Token Metrics indices offer strategies for both long-term and short-term approaches. Some indices focus on fundamental strength and growth potential, which may appeal to long-term holders, while others are constructed for active traders seeking short-term opportunities.
Token Metrics indices can be rebalanced in real-time, with AI algorithms continuously analyzing new data and making adjustments as needed. This enables dynamic risk management and updated recommendations to align with changing market conditions.
No, Token Metrics serves customers worldwide. Its platform and tools support users from over 50 countries, providing global coverage for research, analytics, and index investing in the cryptocurrency markets.
The information contained in this blog is for educational and informational purposes only and does not constitute financial or investment advice. Cryptocurrency markets are volatile, and investing involves risks. Token Metrics is not a registered investment adviser or broker-dealer. Users should conduct their own research and consult qualified professionals before making investment decisions. Past performance is not indicative of future results.

Crypto investing can feel overwhelming—especially with the hype and volatility of digital assets. But what really matters isn't just theory; it's how AI-powered strategies translate into real-world results for everyday investors.
Sarah is a 34-year-old software engineer who began investing in crypto during the 2020 bull market. She soon realized successful investing required much more time than expected.
She found herself spending 10–15 hours a week researching tokens, reading whitepapers, and monitoring channels. Despite her efforts, her portfolio underperformed Bitcoin due to emotional decisions and stress from constant monitoring.
Sarah almost walked away from crypto altogether, doubting if her efforts were worthwhile.
The turning point came when a colleague introduced her to Token Metrics. She was drawn to the AI-driven, systematic approach and started a trial in January 2023.
Token Metrics provided clear index strategies tailored to her risk profile, simplifying her investment process. She split her portfolio into large-cap, mid-cap, and DeFi sector indices for diversification.
Over 18 months, Sarah reduced her crypto management time from 10-15 hours weekly to just 2 hours a month. This freed her to focus on work and life, while systematic rebalancing and data-driven decisions led to better risk-adjusted returns compared to her former DIY approach.
By trusting the indices, she avoided panic selling during downturns and saw a meaningful improvement in her results. She increased her allocation, confident she could build wealth with professional-grade tools—without needing to be a full-time analyst.
Marcus, a retired accountant, approached crypto with caution in 2021 after a financial advisor recommended diversification. Unfamiliar and uneasy with the new asset class, he invested 5% of his retirement savings but found managing it stressful due to volatility.
Attempting a self-directed approach with Bitcoin and Ethereum brought sleepless nights, as every market drop felt like a crisis. His lack of confidence made downturns particularly stressful.
Discovery came through a podcast that introduced Token Metrics’ systematic, risk-managed methodology. With his advisor’s help, Marcus allocated most funds to large-cap indices for stability and a smaller portion to a staking index, generating passive income similar to dividend stocks.
This approach provided not only growth potential but also reliable staking yields. Marcus appreciated having transparent strategies and security guidance fit for his needs.
Now, Marcus’s allocation has grown to $135,000, including both appreciation and new contributions. His staking returns generate extra retirement income, and he reviews the portfolio quarterly with confidence.
The platform’s educational resources enhanced his security practices and peace of mind. Most importantly, he enjoys the benefits of crypto without daily stress or constant monitoring.
Jasmine is a 28-year-old marketing manager facing the familiar challenges of student debt, rising living costs, and uncertain economic prospects. Seeking a new way to build wealth, she was drawn to crypto but quickly got lost amid conflicting online advice and hype.
Her initial investments—often based on internet trends and promises of outsized returns—led to losses. After watching her portfolio shrink, she considered quitting altogether.
A friend recommended Token Metrics. Jasmine found relief in systematic, AI-driven investing. She reset her strategy, investing in a balanced index and contributing monthly, unaffected by market swings.
The discipline of dollar-cost averaging kept her investing through downturns. She trusted the indices to accumulate quality tokens rather than chasing the next trend.
After 20 months, Jasmine’s portfolio reflected her steady contributions and growth. More importantly, she shifted from chasing hype to building wealth systematically, using a mix of balanced, growth, and sector indices.
With consistent monitoring and sound strategy, Jasmine felt empowered to reach ambitious goals—combining crypto wealth with long-term savings toward early retirement.
David, an experienced stock trader, entered crypto believing his technical skills would transfer easily. Yet, he found crypto's 24/7 volatility and volatility exhausting, with results that barely outpaced a basic buy-and-hold strategy.
He realized that endless effort wasn’t yielding better returns. The emotional toll and time commitment prompted a search for improvement.
Token Metrics’ data-driven approach challenged his assumptions. David committed most of his portfolio to AI-powered indices, keeping a portion for discretionary trading.
This hybrid approach offered the best of both worlds: systematic, stable core exposure and a smaller allocation for active trading.
After 18 months, his index-driven portfolio consistently outperformed his discretionary trades, all with less stress. The platform’s discipline helped override emotional impulses during market swings, with automatic rebalancing and rational exits.
David now advocates systematic strategies in his trading community, valuing the psychological relief and reliable results brought by combining AI with disciplined investing.
Across these stories, several themes stand out.
• Professional Tools for Everyone:
Token Metrics makes institutional-quality resources accessible to all investors, not just large funds or experts.
• Time Freedom:
Investors gained back hours each week, shifting focus to life’s priorities beyond crypto management.
• Emotional Relief:
Systematic, data-driven strategies replace emotional decisions with disciplined confidence and peace of mind.
• Realistic Expectations:
Wealth is built gradually through strategic compounding, not overnight speculation.
• Education and Growth:
Beyond performance, Token Metrics delivers ongoing investor education about portfolio strategy, risk, and disciplined implementation.
Despite their different backgrounds and situations, each investor succeeded by choosing systematic, AI-powered investing.
Success required:
• A clear strategy based on risk tolerance and goals
• Systematic implementation, letting AI guide decisions
• Patience to weather volatility
• Ongoing learning and growth
The journey from confusion and stress to clarity and confidence is possible for anyone committed to an evidence-based process.
Token Metrics provides the tools, strategies, and support for systematic crypto investing. The first step is yours to take—and with patience and discipline, the possibility for your own success story awaits.
Join thousands of investors using Token Metrics AI Indices to build wealth systematically. Get started at tokenmetrics.com—access professional-grade research, tailored index strategies, and disciplined portfolios designed to fit your goals and confidence level.
Token Metrics AI Indices are diversified portfolios generated by advanced algorithms. They help investors gain exposure to the crypto market while managing risk through automatic rebalancing, research, and systematic updates tailored to varying risk profiles.
Yes, beginners use AI indices to simplify crypto investing. Guided index strategies help reduce emotional decision-making and time commitment, while still offering educational resources and transparency about risks.
Index portfolios are designed for efficiency. Most investors spend a few hours per month reviewing performance and rebalancing, far less than active trading or researching individual tokens daily.
Token Metrics AI Indices can accommodate a wide range of portfolio sizes. Investors may start small to become familiar with the approach and gradually increase allocations as confidence grows. Always research platform details for up-to-date eligibility.
AI indices are built with systematic risk management—diversifying across assets and following disciplined rebalancing, which helps mitigate emotional reactions and maintain long-term goals, even in volatile markets.
This article is for informational and educational purposes only. It describes the real-world impact of systematic, AI-powered crypto investing, as reported by Token Metrics users. No content should be interpreted as investment advice, recommendations, or financial guarantees. Always research thoroughly and consult qualified professionals before making investment decisions.

Ask most cryptocurrency investors about their strategy, and they'll enthusiastically describe which tokens they bought and why.
Ask them about their rebalancing approach, and you'll likely encounter blank stares or vague responses about "checking in periodically."
This gap between initial portfolio construction and ongoing management represents one of the most significant missed opportunities in crypto investing.
Rebalancing—systematically adjusting portfolio allocations back to target levels—transforms average portfolios into exceptional ones through disciplined profit-taking and value-seeking behavior.
Academic research demonstrates that systematic rebalancing can add 0.5-2% to annual returns while simultaneously reducing volatility.
In cryptocurrency markets where volatility reaches extreme levels and different tokens experience dramatically divergent performance, rebalancing's impact amplifies even further.
Yet most investors struggle with rebalancing.
The decisions feel counterintuitive—selling winners that might keep rising and buying losers that might keep falling.
Emotions interfere with discipline. Tax implications complicate timing. The sheer volatility of crypto markets makes determining appropriate rebalancing triggers difficult.
Token Metrics AI Indices solve the rebalancing challenge through systematic, emotion-free approaches that capture rebalancing's benefits while eliminating the psychological and practical obstacles that prevent individual investors from executing effectively.
This comprehensive guide explores the science and practice of portfolio rebalancing, reveals why it matters more in crypto than traditional markets, and demonstrates how Token Metrics implements intelligent rebalancing that consistently enhances returns.
Without rebalancing, portfolios inevitably drift from target allocations as different holdings perform differently.
Consider a simple example: You construct a portfolio allocating 25% each to Bitcoin, Ethereum, Solana, and Cardano—a balanced four-token portfolio.
Over the next year, Bitcoin returns 50%, Ethereum returns 100%, Solana returns 200%, and Cardano returns 0%.
Your portfolio now holds approximately 19% Bitcoin, 32% Ethereum, 48% Solana, and 1% Cardano—dramatically different from your intended 25% equal weighting.
You've become concentrated in Solana at precisely the moment when its 200% gain makes it more expensive and potentially due for a correction.
Meanwhile, Cardano represents a tiny fraction despite potentially offering more upside from its underperformance.
This drift creates concentration risk—your portfolio's fate increasingly depends on a few holdings.
If Solana crashes 50%, your entire portfolio suffers disproportionately despite initially designing a diversified portfolio.
Rebalancing prevents this dangerous drift, maintaining your intended risk profile.
Rebalancing mechanically enforces profitable investor behavior—selling portions of outperformers (taking profits near peaks) and buying underperformers (accumulating near troughs).
This systematic approach to buying low and selling high removes emotion from timing decisions that defeat most investors.
Research analyzing portfolio rebalancing across various market conditions demonstrates that disciplined rebalancing adds 0.5-2% to annual returns in traditional markets.
In cryptocurrency markets with their extreme volatility and frequent leadership rotations, rebalancing's impact often exceeds 2-5% annually—a substantial performance enhancement from disciplined portfolio management.
Cryptocurrency markets exhibit both mean reversion (where extreme moves tend to reverse) and momentum (where trends persist).
Rebalancing captures both dynamics: it systematically takes profits from momentum runs by trimming outperformers, while positioning for mean reversion by adding to beaten-down assets that may recover.
Token Metrics' AI analyzes market regimes to optimize rebalancing frequency and thresholds.
During strong trending periods, the system may rebalance less frequently to let momentum run.
During choppy, mean-reverting periods, more frequent rebalancing captures oscillations profitably.
Behavioral finance research reveals the "disposition effect"—investors' tendency to sell winning investments too quickly (locking in gains prematurely) while holding losing investments too long (hoping for recovery).
This pattern destroys returns by cutting profits short and letting losses compound.
Counterintuitively, proper rebalancing often requires opposite behavior—holding winners that have appreciated but remain fundamentally strong while selling losers that have declined for valid reasons.
This feels psychologically wrong, which is precisely why systematic approaches outperform gut instinct.
Token Metrics' AI doesn't experience disposition effect.
The algorithms evaluate whether holdings remain attractive based on current fundamentals, technicals, and systematic criteria—not based on whether positions are currently profitable or at a loss.
When a token in your portfolio surges 300%, rebalancing requires selling a portion to restore target allocation.
Your brain immediately screams objection: "But what if it goes up another 300%? I'll miss those gains!"
This FOMO prevents many investors from taking profits systematically.
The reality is that no one can predict whether any asset will continue appreciating.
By rebalancing systematically, you lock in some gains from exceptional performance while maintaining some exposure in case the run continues.
This balanced approach optimizes long-term risk-adjusted returns even if occasionally you rebalance before peaks.
Token Metrics implements this balance automatically, removing the FOMO-driven paralysis that prevents proper profit-taking.
Loss aversion—the psychological pain of losses exceeding the pleasure of equivalent gains—makes rebalancing into declining assets psychologically difficult.
When a token has dropped 50%, buying more feels like "throwing good money after bad."
Yet this value-seeking behavior, when applied to fundamentally sound assets experiencing temporary weakness, proves highly profitable.
Some of the best investment returns come from buying quality assets when they're temporarily out of favor.
Token Metrics' systematic approach evaluates whether underperforming tokens remain fundamentally attractive.
If so, rebalancing into them at depressed prices positions for recovery. If not, the system may reduce or eliminate positions rather than blindly adding to failing investments.
Token Metrics indices employ sophisticated rebalancing triggers that balance trading frequency with optimization.
Rather than arbitrary calendar rebalancing or purely threshold-based approaches, the AI considers multiple factors including:
• Allocation drift from targets (typically rebalancing when positions deviate 5-10% from targets)
• Technical indicators suggesting trend changes or reversals
• Fundamental metric changes affecting token attractiveness
• Market regime shifts altering optimal allocation patterns
This multi-factor approach ensures rebalancing occurs when beneficial while avoiding excessive trading that generates costs without corresponding benefits.
Token Metrics doesn't simply restore positions to arbitrary equal weights.
The AI implements risk-adjusted position sizing where higher-quality, lower-volatility tokens receive larger allocations, while riskier, more volatile tokens receive smaller positions.
This sophisticated weighting optimizes risk-adjusted returns rather than just nominal returns.
When rebalancing, the system recalculates optimal position sizes based on current risk characteristics, fundamentals, and market conditions.
A token that was 10% of the index three months ago might now warrant 8% or 12% based on changing circumstances.
For taxable accounts, Token Metrics considers tax implications when determining optimal rebalancing approaches.
The system may defer selling appreciated positions until long-term capital gains treatment becomes available, utilize tax-loss harvesting to offset gains when appropriate, and consider using new contributions for rebalancing rather than selling existing holdings.
While indices provide rebalancing guidance, users maintain control over implementation and can adapt recommendations to their specific tax situations with professional tax advisor input.
Rebalancing large positions in illiquid tokens can create significant slippage—buying or selling moving prices unfavorably.
Token Metrics prioritizes liquid tokens with deep order books, analyzes trading volumes when determining position sizes, and provides guidance on execution approaches for larger rebalancing trades.
This liquidity focus ensures rebalancing can be implemented efficiently without excessive costs eroding benefits.
During bull markets when most holdings appreciate, rebalancing involves systematically taking profits from the strongest performers.
This feels counterintuitive—why sell your best performers? But disciplined profit-taking during strength achieves several objectives:
• It locks in gains that could evaporate in corrections
• Reduces concentration risk in overvalued positions
• Provides capital for opportunistic additions
• Maintains your target risk profile
Token Metrics indices implement graduated profit-taking during bull markets.
Rather than eliminating positions in strong performers, the system trims them incrementally as they appreciate, maintaining some exposure while reducing risk.
During bear markets when most holdings decline, rebalancing involves adding to positions at depressed prices.
This requires significant discipline—buying when everything is falling feels dangerous.
Yet systematic accumulation during weakness positions portfolios for eventual recovery.
Token Metrics' AI evaluates whether declining tokens remain fundamentally sound and worth accumulating, or whether they're declining for valid reasons suggesting reduced allocation.
This discrimination prevents blindly buying poor projects just because they're cheap.
During range-bound markets, different tokens oscillate within ranges, creating rebalancing opportunities to capture mean reversion.
When Token A rises to range top while Token B falls to range bottom, rebalancing trims A and adds to B. When they reverse, rebalancing adjusts again.
This range-trading aspect of rebalancing proves particularly profitable during extended consolidation periods, generating returns even when overall markets move sideways.
Token Metrics indices have predetermined rebalancing schedules ranging from weekly for high-frequency momentum strategies to quarterly for longer-term value approaches.
When implementing indices personally, establish your own rebalancing schedule based on account type (retirement accounts support more frequent rebalancing), portfolio size (larger portfolios justify more frequent management), and time availability (realistic assessment of attention you can devote).
Most investors find monthly or quarterly rebalancing provides optimal balance between benefits and time commitment.
When rebalancing, the process involves reviewing current portfolio allocations, comparing to target allocations from your chosen Token Metrics indices, calculating percentage and dollar deviations, determining which positions to trim and which to add, and executing trades to restore targets.
Token Metrics platform provides tools simplifying these calculations, showing current vs. target allocations clearly and suggesting specific trades to implement rebalancing.
Effective rebalancing implementation requires attention to execution details including:
• Using limit orders to avoid excessive slippage
• Splitting large trades across multiple orders or days
• Timing trades to avoid extreme volatility periods
• Documenting all transactions for tax purposes
For small portfolios (under $10,000), simple market order execution typically suffices.
For larger portfolios, thoughtful execution preserving capital through reduced trading costs becomes important.
An efficient rebalancing technique involves directing new contributions to underweight positions rather than selling overweight positions.
If you contribute $1,000 monthly to your crypto portfolio and Bitcoin is overweight while Ethereum is underweight, direct the entire $1,000 to Ethereum rather than buying both proportionally.
This approach achieves rebalancing benefits without generating taxable events from selling appreciated assets—particularly valuable in taxable accounts.
Some investors rebalance constantly, adjusting allocations at every minor drift.
This excessive trading generates transaction costs that exceed rebalancing benefits, creates unnecessary tax events, and prevents letting profitable trends develop.
Token Metrics indices balance rebalancing benefits against costs, trading only when systematic criteria justify action.
Individual investors should resist urges to constantly tinker, allowing portfolios time to perform between rebalancing events.
Conversely, neglecting rebalancing allows dangerous concentration to develop.
Some investors set up portfolios then ignore them for years, discovering eventually that they've become inadvertently concentrated in whatever happened to perform best.
Establish systematic rebalancing schedule—quarterly at minimum, monthly for more active management—and adhere to it consistently.
Perhaps the most common mistake involves establishing systematic rebalancing rules then overriding them emotionally.
"I know I should rebalance into Token X, but it's been falling so hard... I'll wait until it stabilizes."
This emotional override defeats the entire purpose of systematic rebalancing.
Trust the process—if your systematic criteria indicate rebalancing is appropriate, execute it regardless of emotional discomfort.
Rebalancing in taxable accounts generates capital gains taxes that can substantially reduce after-tax returns if ignored.
Selling $10,000 of appreciated Bitcoin to rebalance might create $3,000+ tax liability depending on gains and tax bracket.
Always consider tax implications when rebalancing taxable accounts.
Sometimes deferring rebalancing until long-term status is achieved, or using new contributions rather than selling, proves more tax-efficient.
Rather than rebalancing to exact targets, sophisticated investors use bands.
If target allocation is 25% with 5% bands, rebalance only when allocation drifts beyond 20-30% range.
This reduces trading frequency while still preventing excessive drift.
Token Metrics incorporates band approaches in index methodologies, rebalancing when necessary but avoiding unnecessary trades for minor drifts.
Advanced rebalancing considers valuations, becoming more aggressive when assets appear cheap and more conservative when expensive.
Rather than mechanical rebalancing to fixed targets, dynamic approaches adjust targets based on current market conditions.
Token Metrics' AI implements elements of dynamic rebalancing, adjusting index weights based on comprehensive analysis of valuations, momentum, and fundamentals.
For investors with crypto as part of broader portfolios including stocks, bonds, and real estate, rebalancing should consider total portfolio allocation.
When crypto surges from 5% to 10% of total wealth, rebalancing should trim crypto back to 5%, distributing proceeds to other asset classes.
This total portfolio perspective prevents crypto concentration from overwhelming overall risk management, regardless of how well chosen tokens perform.
Track rebalancing impact by comparing portfolio returns to buy-and-hold counterfactual, analyzing transaction costs as percentage of benefits, evaluating whether risk (volatility, drawdowns) decreased, and measuring consistency of returns across periods.
Token Metrics provides analytics showing rebalancing impact, helping users understand value added through disciplined portfolio management.
Portfolio rebalancing represents the clearest example of how discipline and system create investment advantage.
The mathematics are straightforward—maintain target allocations through buying low and selling high.
The psychology is challenging—overcoming FOMO, loss aversion, and emotional attachment to winners.
Token Metrics AI Indices solve the rebalancing challenge through emotion-free systematic implementation that captures rebalancing benefits without succumbing to psychological obstacles that defeat individual investors.
The indices trade based on data-driven criteria, not fear or greed. They take profits during strength and accumulate value during weakness without hesitation or second-guessing.
For crypto investors seeking to optimize returns, proper rebalancing may represent the highest-value activity available.
It requires no market timing genius, no ability to pick winning tokens before they surge, no special information or insights.
It requires only discipline—the discipline to follow systematic rules consistently regardless of emotional state.
Token Metrics provides that discipline at scale, implementing sophisticated rebalancing strategies refined through years of market analysis and AI optimization.
By trusting this systematic approach, investors capture rebalancing's substantial benefits while preserving time and mental energy for other priorities.
Rebalancing isn't glamorous. No one boasts about their disciplined portfolio maintenance.
But portfolios that compound wealth over decades do so through consistent rebalancing discipline, not lucky speculation.
Choose discipline. Choose systematic approaches. Choose Token Metrics.
Ready to harness the power of systematic rebalancing?
Discover how Token Metrics AI Indices implement disciplined portfolio management that turns rebalancing from burdensome chore into consistent alpha generation.
Visit tokenmetrics.com to access AI-powered rebalancing strategies optimized for crypto markets.
Portfolio rebalancing is the process of systematically adjusting your asset allocations back to target weights.
It involves selling some of your portfolio’s outperformers and buying more of the underperformers to maintain a predetermined allocation.
This helps manage risk and capture opportunities as market movements cause allocations to drift from your original plan.
The optimal schedule varies depending on your portfolio type, size, and objectives.
Most investors find monthly or quarterly rebalancing strikes a good balance between keeping allocations in line and minimizing trading costs.
Some strategies benefit from more frequent (e.g., weekly) rebalancing, especially in highly volatile markets.
Research shows systematic rebalancing often increases long-term returns while also reducing risk.
This is achieved by taking profits in outperforming assets and buying underperformers, making the most of volatility and mean reversion in crypto markets.
Consistent rebalancing also helps sustain a diversified risk profile over time.
Token Metrics AI Indices use data-driven rules to trigger rebalancing based on allocation drift, momentum, market regimes, and liquidity.
The indices automate rebalancing to maintain optimal weights, reduce human error, and adapt dynamically to shifting market conditions.
Avoid these pitfalls:
• Rebalancing too frequently and generating unnecessary taxes and fees
• Ignoring rebalancing for long periods
• Letting emotions override systematic rules
• Not accounting for tax implications
• Buying or selling illiquid tokens without regard to slippage
This content is for informational and educational purposes only. It describes systematic approaches to rebalancing and risk management, not specific investment advice or recommendations.
Cryptocurrency investing involves risk, and you should consult a qualified financial advisor or tax professional regarding your own circumstances before making decisions.
Token Metrics does not provide individualized investment, legal, or tax advice.

The landscape of cryptocurrency investing is changing. For many years, the focus remained solely on speculation and price appreciation—the legendary 'number go up' mindset.
Now, innovative protocols and platforms are turning crypto into an income-generating asset class, creating new opportunities for systematic, sustainable yield. Understanding this shift is crucial for anyone seeking more than just capital gains from their crypto portfolios.
Staking is one primary way to earn crypto income. It involves locking up tokens to support a blockchain network's operation and security.
Stakers receive newly minted tokens in return, with yields depending on each network.
Major stakable cryptocurrencies include:
• Ethereum (post-Merge), yielding roughly 3-5% annually
• Cardano (ADA), with 4-6% rewards
• Solana (SOL), at 6-8% yields
• Polkadot (DOT), returning 10-14%
• Cosmos (ATOM), providing 15-20% rewards
Staking provides predictable returns and aligns incentives for network security. There’s also no risk of impermanent loss, unlike liquidity provision.
However, stakers face lock-up periods, possible slashing due to validator misbehavior, and variable yields based on participation rates.
For DeFi lending, platforms like Aave, Compound, and MakerDAO allow crypto holders to lend tokens, earning interest like a traditional bond.
Stablecoins typically generate 2-8% annually, while more volatile assets could see 1-4%, climbing higher during periods of high demand.
Flexible liquidity, diversified asset options, and auto-reinvesting are benefits. Risks include smart contract vulnerabilities, liquidity crunches, and protocol insolvency.
Liquidity provision lets users earn trading fees for supplying pairs to AMMs such as Uniswap, SushiSwap, or PancakeSwap.
Major trading pairs could earn 5-20% annually, but more exotic token pools might offer far higher returns—alongside greater risks.
The largest risk is impermanent loss, which can sometimes outpace fee earnings during high volatility.
Yield aggregators (like Yearn Finance) enable hands-off income by algorithmically finding the highest DeFi yields and managing strategies on users' behalf.
This brings optimization and gas savings but also adds further smart contract risk and possible tax complexity.
Constructing an income-oriented portfolio means balancing yield generation, capital preservation, and growth.
A typical allocation through Token Metrics might use 40-50% in staking assets (such as ETH, ADA, SOL, DOT), 30-40% in stablecoin lending, 10-20% in liquidity provision, and a modest 0-10% in higher-risk yield farming.
This strategy emphasizes stability and sustainability while still benefiting from capital gains and yield variety.
Yield stacking is a tactic where investors combine multiple yield streams from a single holding, such as staking ETH, then lending staked ETH derivatives for an added yield layer.
This can boost total income but may add complexity or stacked risk, so each layer should be carefully evaluated.
Sustainable yields are derived from real economic activity. In contrast, 'unsustainable' yields are often backed only by new token issuance, which can erode value over time.
Token Metrics AI distinguishes between these by analyzing protocol revenues, yield sources, and token supply dynamics.
Smart contract risk is inherent in DeFi income opportunities.
Token Metrics emphasizes diversification across multiple audited protocols, focusing on established providers, and monitoring for new vulnerabilities.
Even with robust precautions, only risk amounts you are prepared to lose entirely in DeFi protocols.
Counterparty and protocol risk also merit attention. Market disruptions can challenge protocol solvency, especially during periods of stress or volatile price swings.
Token Metrics mitigates these exposures by selecting over-collateralized protocols, monitoring reserve funds, managing exposure, and stress-testing scenarios.
Impermanent loss is a key risk for liquidity providers.
The platform favors strategies with highly correlated pairs, sustainable fee offsets, and appropriate allocation size to contain exposure.
Crypto income also brings complex tax obligations. Each yield event (staking, lending, fees) typically triggers a taxable moment, and detailed record-keeping is critical.
Large-Cap Staking Indices:
Token Metrics offers indices focused on leading Proof-of-Stake assets, blending potential appreciation with steady yields. These strategies spotlight established networks, optimize staking selections, and help manage liquidity and risk.
For income-oriented investors, these can provide stable 4-8% annual yields with less downside than purely growth-weighted options—but still more volatility than many traditional products.
DeFi Yield Indices:
Specifically designed to capture lending, liquidity, and aggregation yield opportunities, these indices diversify across protocols and systematically rebalance for optimal results.
They suit those comfortable with DeFi risks and desiring enhanced yield potential (10-20%+ in favorable markets).
Balanced Income and Growth Indices:
Balancing income generators with growth tokens, these indices typically split allocations—for example 60% in appreciation assets, 40% in income-producing holdings.
Moderate yields (3-7%) are common, combining growth upside and consistent cash flow.
Calculating the yield required for income goals is a vital first step. For example, a $1,000,000 portfolio targeting $50,000 annual income requires a 5% yield, while a $500,000 portfolio would require an unsustainable 10%.
Staking can be approached through:
• Direct staking (most technical, highest yields)
• Delegated staking (third-party validators for ease)
• Liquid staking (protocols like Lido for flexibility)
Token Metrics provides tailored advice to optimize staking approach by asset, reflecting yields, lock-up, and user preferences.
Cash flow and reinvestment must be planned systematically—decide withdrawal frequency, reinvestment amounts, tax withholding, and rebalance as life stages shift.
Most investors reinvest during accumulation, then increase withdrawals for retirement or income phases. Token Metrics indices can adapt dynamic allocations accordingly.
Ongoing monitoring is essential. Quarterly reviews of protocol health, comparative yield checks, and timely rebalancing help maintain income sustainability.
Token Metrics’ analytics automate much of this ongoing assessment, flagging notable changes for user action.
Scenario 1 – Supplemental Income:
An employed professional with $300,000 in crypto seeks $1,000-$2,000 monthly and moderate risk. The strategy could include 60% large-cap staking, 30% stablecoin lending, and 10% conservative DeFi, targeting a blended 5-7% annual return.
Scenario 2 – Early Retirement:
A 50-year-old with $1,500,000 in crypto aims for $75,000 per year in five years, with moderate/aggressive risk. A balanced index (50%), DeFi yield index (30%), and large-cap staking (20%) could target a 6-8% yield, blended with capital withdrawals if necessary.
Scenario 3 – Financial Independence:
A 35-year-old with $750,000 targets future independence and a $100,000 annual income. Aggressive growth indices (70%) and DeFi yield indices (30%) may be optimal, directing all current income back into the portfolio for compounding.
Chasing extremely high yields—especially anything above 100%—is the most common misstep among crypto income investors.
Token Metrics systematically screens out these unsustainable offers, instead prioritizing protocols delivering steady, real-economic yields within a safer range.
Focusing excessively on yield without regard to principal protection is another risk. A high yield does not compensate if the asset’s underlying value declines sharply. Total return—combining appreciation and income—is always the bigger picture.
DeFi risks are often correlated. What appears diversified may not truly diversify portfolio risk if protocols are tightly connected.
Token Metrics manages this by combining blockchains (e.g., Ethereum, Solana, Avalanche), different income methods, and balancing DeFi with non-DeFi assets for true diversification.
The maturation of crypto investing delivers new paths toward passive income, not just speculative growth. Thoughtful strategy and risk management are key.
Focus on yields from genuine activity, diversify smartly, and continuously revisit portfolio allocations as conditions change.
Token Metrics AI Indices offer systematic portfolio tools and research for pursuing income. The platform's AI filters opportunities by sustainability, automates complex allocations, and keeps investors informed about evolving protocols and industry risk.
Whether you aim for supplemental income, long-term wealth, or full financial independence, smart use of these tools now puts the future of passive crypto income within reach.
Staking means locking tokens to support a network and earn newly minted rewards, usually tied to Proof-of-Stake blockchains.
DeFi lending involves providing assets to protocols where borrowers pay interest. Staking supports network operations, while lending acts like digital banking for earners.
No, crypto yields are never guaranteed.
Returns depend on protocol economics, market demand, and potential risks, including smart contract issues and overall market volatility.
Token Metrics evaluates and monitors thousands of protocols, rates their risk, analyzes yield sources, and helps users systematically diversify across many strategies to lessen risk.
Each yield event (staking, lending, liquidity provision) may trigger taxable income, which must be reported where required by law.
Keeping careful records and seeking guidance from a crypto-specialized tax expert is strongly advised.
Sustainable income derives from real network use like transaction fees, security rewards, or legitimate borrowing. The most sustainable avenues are usually staking on established blockchains and selectively vetted lending platforms.
Very high yields backed by token inflation, rather than real use, are generally less sustainable.
This blog is for educational and informational purposes. It does not constitute financial, investment, or tax advice.
Cryptocurrency markets are volatile and carry risk. Always conduct your own due diligence and seek independent advice before acting on any information provided herein.

Bitcoin
TL;DR (not financial advice): Token Metrics scenarios put BTC between ~$177k–$219k in an $8T total crypto market, $301k–$427k at $16T, $425k–$635k at $24T, and $548k–$843k at $32T by ~2027.
Baseline long-term view from TM Agent: $100k–$250k if macro stays favorable; $20k–$40k downside in a prolonged risk-off regime.
→ Deep dive & live signals: Bitcoin Token Details
→ Want to buy BTC? Use our partner link: MEXC sign-up
Scenario-driven: BTC outcomes hinge on total crypto market cap. Higher aggregate liquidity/adoption = higher BTC bands.
Fundamentals strong: Fundamental Grade 89.53% (Tokenomics 100%, Exchange 100%, Community 84%).
Tech solid: Technology Grade 69.78% (Repo 79%, Collaboration 70%, Activity 63%).
TM Agent baseline: multi-year $100k–$250k with upside if institutions & macro cooperate; risk to $20k–$40k in a severe risk-off.
This article is education only; not financial advice.
Total Crypto Mkt Cap |
Bear Case |
Base Case |
Moon Case |
$8T |
$176,934 |
$197,959 |
$218,985 |
$16T |
$300,766 |
$363,842 |
$426,918 |
$24T |
$424,598 |
$529,725 |
$634,852 |
$32T |
$548,430 |
$695,608 |
$842,786 |
Current price when modeled: ~$115.6k.
How to read it: Each band blends cycle analogues + market-cap share math and applies TA guardrails.
The base path assumes steady ETF/treasury adoption and neutral-to-positive macro; moon adds a liquidity boom + accelerated institutional flows; bear assumes muted flows and tighter liquidity.
8T MCap Scenario

16T MCap Scenario

24T MCap Scenario
32T MCap Scenario

Spot ETF flows, corporate/treasury allocations, and global liquidity are the swing factors that push BTC between the $100k–$250k baseline and the higher scenario bands.
If real rates fall and risk appetite rises, the system can support $16T–$24T crypto, putting BTC’s base case in the $364k–$530k zone.
Programmatic issuance cuts keep the scarcity story intact; historically, post-halving windows have supported asymmetric upside as demand shocks meet slower new supply.
Fundamental Grade 89.53% with perfect Tokenomics and Exchange access supports liquidity and distribution.
Technology Grade 69.78% (Repo 79%, Collaboration 70%) signals a mature, continuously maintained codebase—even if raw dev “Activity” cycles with market phases.
With price recently around $115k, the $8T path implies a medium-term corridor of $177k–$219k if crypto caps stall near cycle mid.
Reclaims above prior weekly supply zones (mid-$100ks to high-$100ks) would bias toward the $16T track ($301k–$427k).
A macro/liquidity slump that undercuts weekly supports could revisit the TM Agent downside zone ($20k–$40k), though that would require a deep and sustained risk-off.
For live support/resistance levels and signals, open: Bitcoin Token Details.
Fundamental Grade: 89.53%
Community: 84%
Tokenomics: 100%
Exchange availability: 100%
DeFi Scanner: 77%
VC Score: N/A

Technology Grade: 69.78%
Activity: 63%
Repository: 79%
Collaboration: 70%
Security: N/A
DeFi Scanner: 77%
Interpretation: Liquidity/access + pristine token mechanics keep BTC the market’s base collateral; tech metrics reflect a conservative, security-first core with steady maintenance rather than hype-driven burst commits.
• ETF/retirement channel penetration broadens demand beyond crypto-native cohorts.
• Treasury adoption (corporates, macro funds) increases “digital collateral” utility.
• Macro easing / falling real yields can push total crypto mkt cap toward $16T–$24T.
• Global tightening (higher real rates, QT) compresses risk premiums.
• Regulatory shocks curtail flows or custody rails.
• Vol/liquidity pockets amplify drawdowns; deep retests remain possible.
Can BTC hit $200k–$250k?
Yes—those sit inside our $8T–$16T bands (base/mid), contingent on continued institutional adoption and constructive macro. Not guaranteed.
Could BTC reach $500k–$800k?
Those levels map to $24T–$32T total crypto scenarios (base → moon). They require a powerful liquidity cycle plus broader balance-sheet adoption.
What invalidates the bull case?
Sustained high real rates, policy tightening, or adverse regulation that throttles ETF/fiat rails—conditions aligned with the TM Agent $20k–$40k downside.
Track the live grade & signals: Bitcoin Token Details
Set alerts around key breakout/retest levels inside Token Metrics.
Want exposure? Consider our partner: Buy BTC on MEXC
Disclosure & disclaimer: This content is for educational purposes only and not financial advice. Cryptocurrency is volatile; do your own research and manage risk.


9450 SW Gemini Dr
PMB 59348
Beaverton, Oregon 97008-7105 US
.svg)


.png)
Token Metrics Media LLC is a regular publication of information, analysis, and commentary focused especially on blockchain technology and business, cryptocurrency, blockchain-based tokens, market trends, and trading strategies.
Token Metrics Media LLC does not provide individually tailored investment advice and does not take a subscriber’s or anyone’s personal circumstances into consideration when discussing investments; nor is Token Metrics Advisers LLC registered as an investment adviser or broker-dealer in any jurisdiction.
Information contained herein is not an offer or solicitation to buy, hold, or sell any security. The Token Metrics team has advised and invested in many blockchain companies. A complete list of their advisory roles and current holdings can be viewed here: https://tokenmetrics.com/disclosures.html/
Token Metrics Media LLC relies on information from various sources believed to be reliable, including clients and third parties, but cannot guarantee the accuracy and completeness of that information. Additionally, Token Metrics Media LLC does not provide tax advice, and investors are encouraged to consult with their personal tax advisors.
All investing involves risk, including the possible loss of money you invest, and past performance does not guarantee future performance. Ratings and price predictions are provided for informational and illustrative purposes, and may not reflect actual future performance.


%20Price%20Prediction%202025%2C%202030%20-%20Forecast%20Analysis.png)


.png)

%20Price%20Prediction%20.webp)


%20Price%20Prediction.webp)


%20Price%20Prediction%20Analysis%20-%20Can%20it%20Reach%20%24500%20in%20Future_.png)


