


.png)

.png)


.png)


.png)
.png)


.png)


.png)
%201%20(1).png)

.png)


.png)


.png)
.png)


.png)


.png)

.png)
.png)
.png)
.png)
.png)
.png)
.png)
.png)
.png)


.png)


.png)

.png)


.png)


.png)
.png)
.png)
.png)

.png)
.png)


Research
Top Crypto Trading Platforms in 2025
When it comes to crypto trading platforms, Token Metrics is not an exchange, but a crypto analytics and crypto trading intelligence platform powered by AI.
Token Metrics Team
10 min


%201.svg)
%201.svg)
Big news: We’re cranking up the heat on AI-driven crypto analytics with the launch of the Token Metrics API and our official SDK (Software Development Kit). This isn’t just an upgrade – it's a quantum leap, giving traders, hedge funds, developers, and institutions direct access to cutting-edge market intelligence, trading signals, and predictive analytics.
Crypto markets move fast, and having real-time, AI-powered insights can be the difference between catching the next big trend or getting left behind. Until now, traders and quants have been wrestling with scattered data, delayed reporting, and a lack of truly predictive analytics. Not anymore.
The Token Metrics API delivers 32+ high-performance endpoints packed with powerful AI-driven insights right into your lap, including:
Getting started with the Token Metrics API is simple:
At Token Metrics, we believe data should be decentralized, predictive, and actionable.
The Token Metrics API & SDK bring next-gen AI-powered crypto intelligence to anyone looking to trade smarter, build better, and stay ahead of the curve. With our official SDK, developers can plug these insights into their own trading bots, dashboards, and research tools – no need to reinvent the wheel.
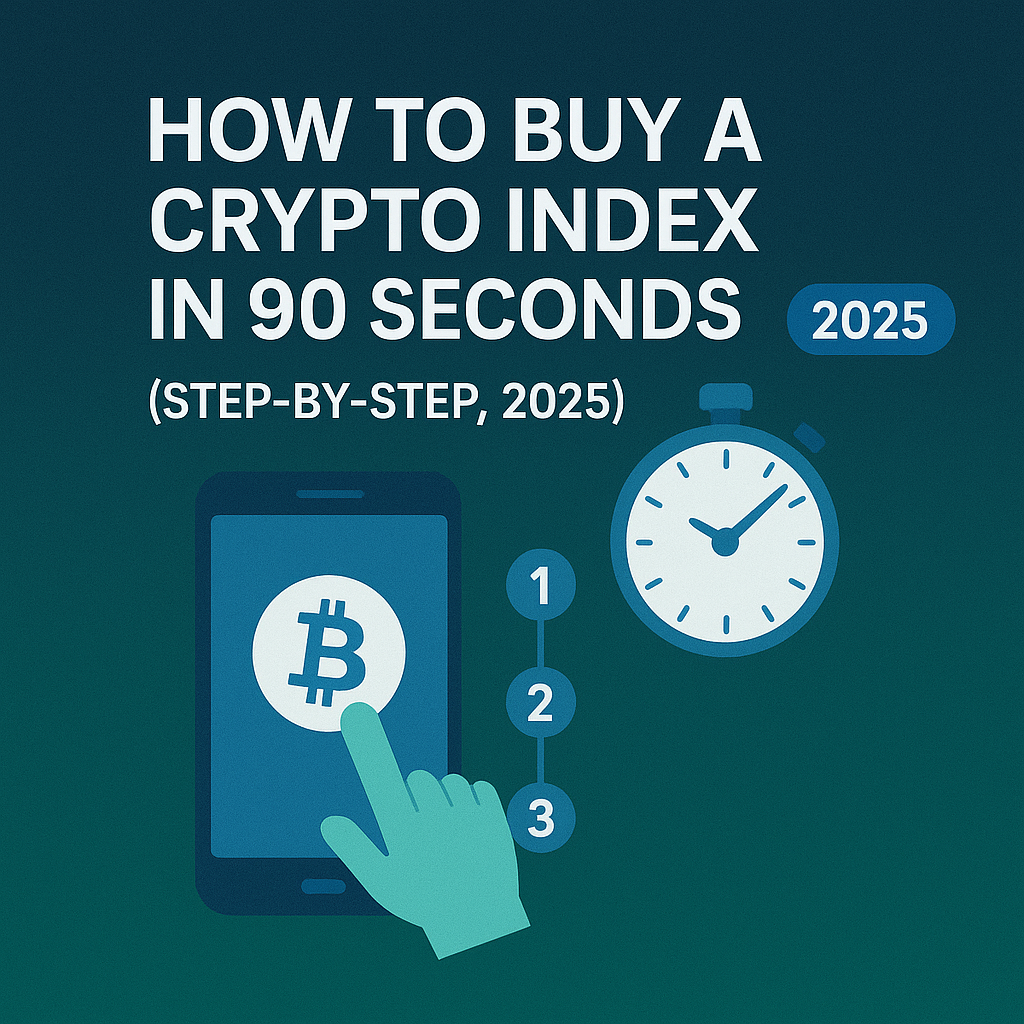
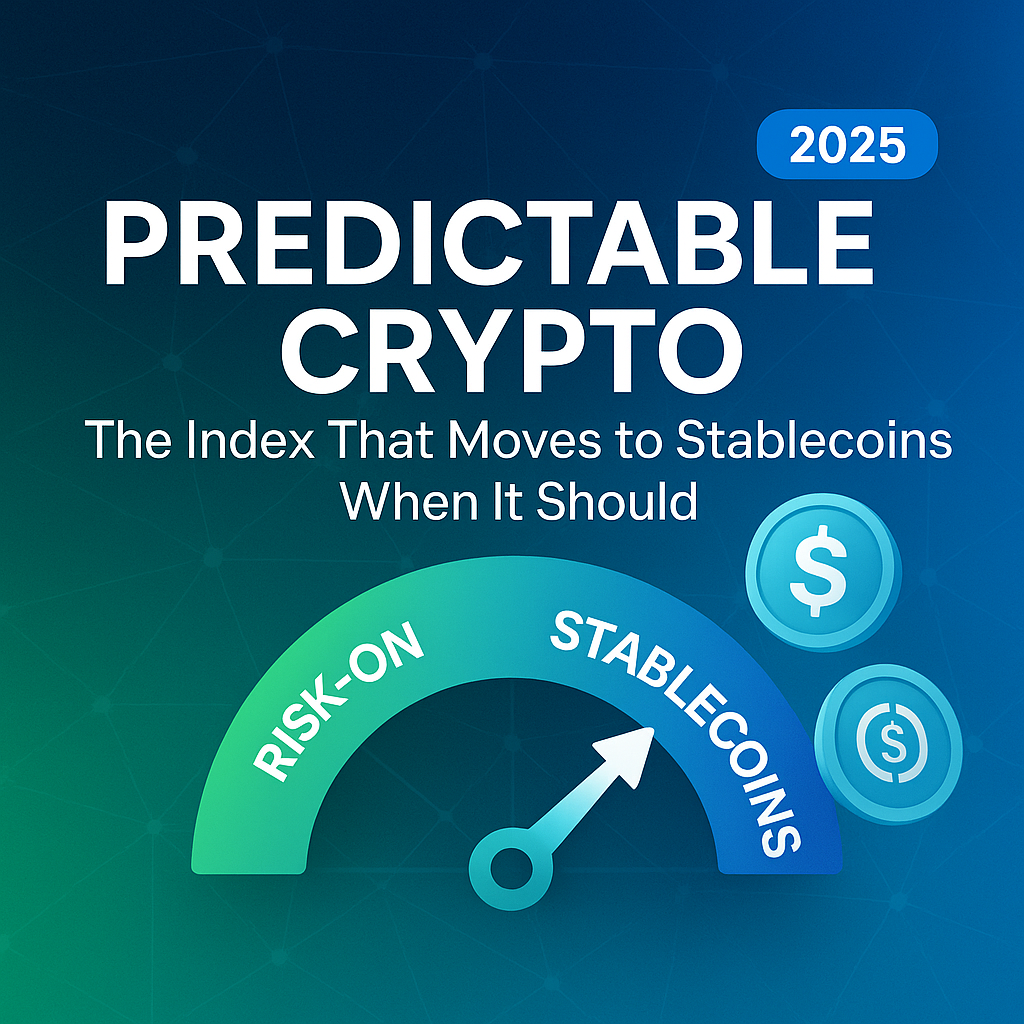
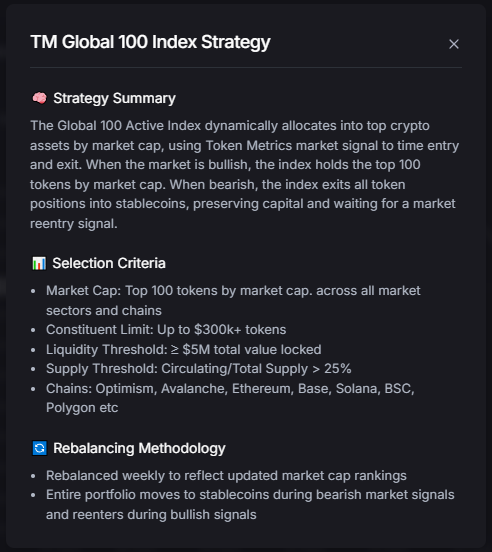
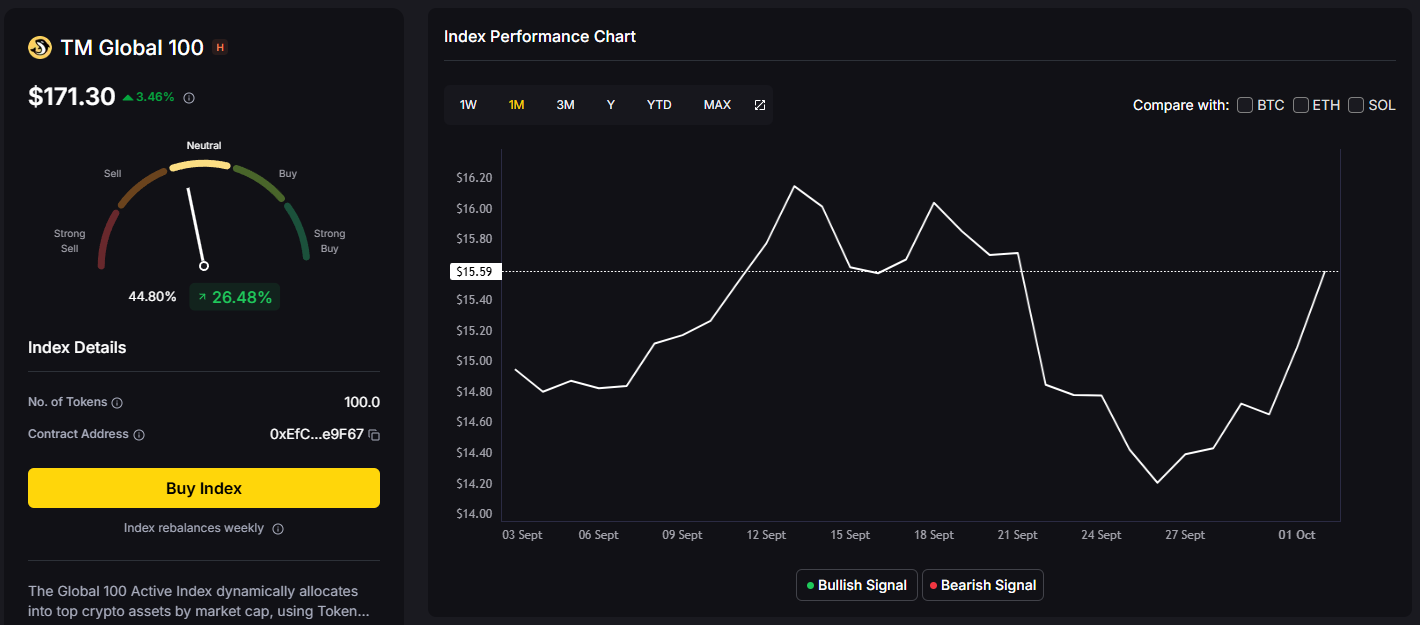
If you want broad crypto exposure without babysitting charts, a top crypto index is the simplest way to participate in the market. TM Global 100 was designed for hands-off portfolios: when conditions are bullish, the index holds the top 100 crypto assets by market cap; when signals turn bearish, it moves to stablecoins and waits. You get weekly rebalancing, transparent holdings and transaction logs, and a 90-second buy flow—so you can spend less time tinkering and more time compounding your life.
→ Join the waitlist to be first to trade TM Global 100.
Volatility is back, and investors are searching for predictable, rules-based ways to capture crypto upside without micromanaging tokens. Search interest for terms like hands-off crypto investing, weekly rebalancing, and regime switching reflects the same intent: “Give me broad exposure with guardrails.”
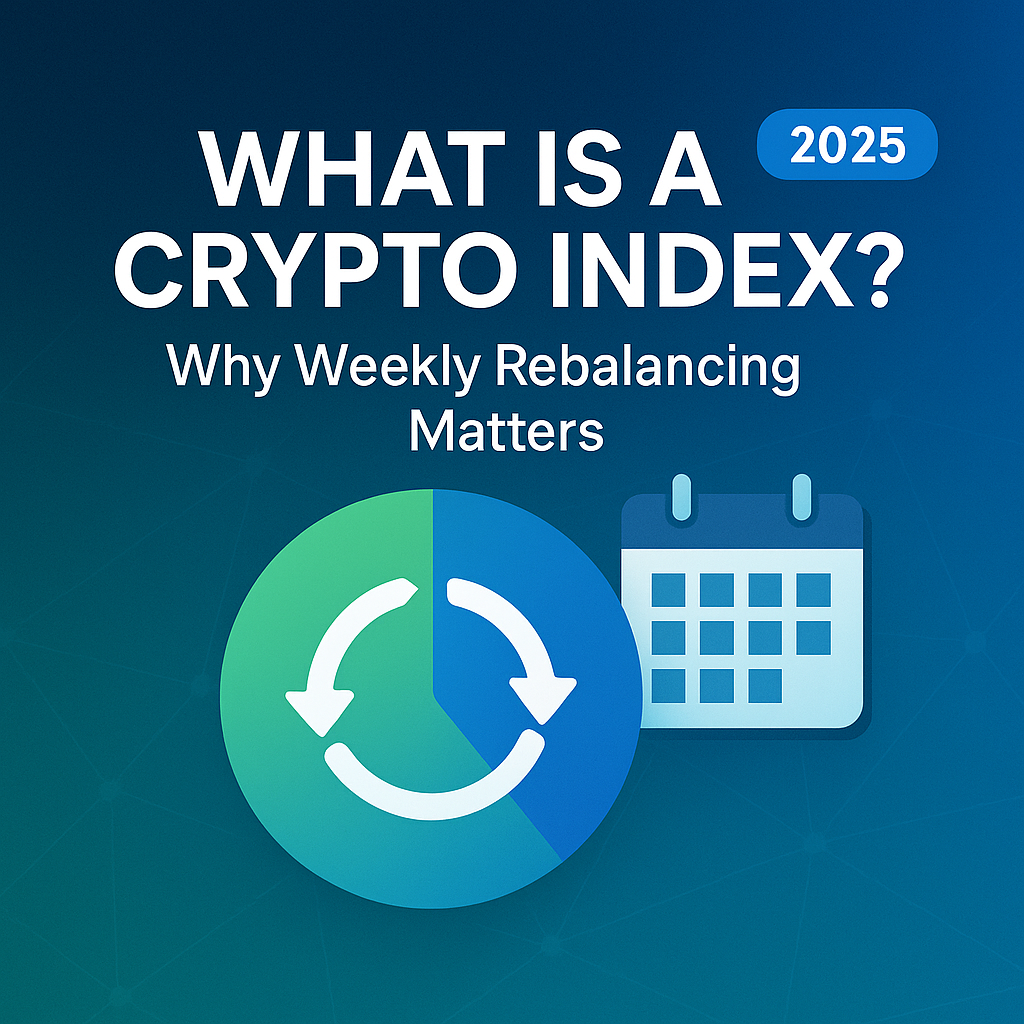
Definition (for snippets): A crypto index is a rules-based basket of digital assets that tracks a defined universe (e.g., top-100 by market cap) with a transparent methodology and scheduled rebalancing.
For 2025’s cycle, a top crypto index helps you participate in uptrends while a regime-switching rule can step aside during drawdowns—removing guesswork and FOMO from day-to-day decisions.
Soft CTA: See the strategy and rules.
→ Join the waitlist to be first to trade TM Global 100.
What is a top crypto index?
A rules-based basket that tracks a defined universe—here, the top 100 assets by market cap—with transparent methodology and scheduled rebalancing.
How often does the index rebalance?
Weekly. Regime switches (tokens ↔ stablecoins) can also occur when the market signal changes.
What triggers the move to stablecoins?
A proprietary market-regime signal. In bearish regimes, the index exits token positions to stablecoins and waits for a bullish re-entry signal.
Can I fund with USDC or fiat?
At launch, the embedded wallet will surface supported funding/settlement options based on your chain/wallet. USDC payout is supported when selling; additional on-ramps may follow.
Is the wallet custodial?
No. It’s an embedded, self-custodial smart wallet—you control the keys.
How are fees shown?
Before confirming, the buy flow shows estimated gas, platform fee, max slippage, and minimum expected value.
How do I join the waitlist?
Visit the Token Metrics Indices hub or the TM Global 100 strategy page and tap Join Waitlist.
Crypto is volatile and can lose value. Past performance is not indicative of future results. This article is for research/education, not financial advice.
If you want hands-off, rules-based exposure to crypto’s upside—with a stablecoin backstop in bears—TM Global 100 is built for you. See the strategy, join the waitlist, and be ready to allocate on launch.
Related Reads
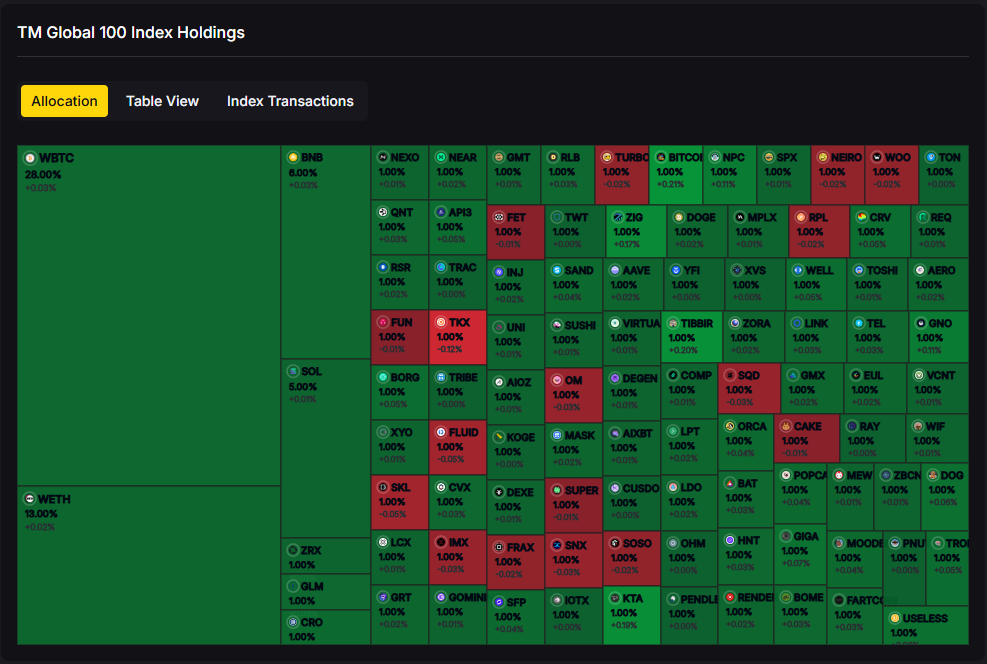
If you’ve tried to “own the market” in crypto, you’ve felt the pain: chasing listings, juggling wallets, and missing rebalances while prices move. A top 100 crypto index aims to fix that—giving you broad exposure when the market is bullish and standing down when it’s not. TM Global 100 is our rules-based version of that idea: it holds the top-100 by market cap in bull regimes, moves to stablecoins in bear regimes, and rebalances weekly. You can see every rule, every holding, and every rebalance—then buy the index in ~90 seconds with an embedded on-chain flow.
→ Join the waitlist to be first to trade TM Global 100.
The market keeps cycling. New leaders emerge quickly. A “set-and-forget” bag can fall behind, while manual baskets burn hours and rack up slippage. Search interest for crypto index, regime switching, and weekly rebalancing keeps growing because people want a simple, disciplined core that adapts.
Definition (for featured snippets): A top 100 crypto index is a rules-based basket that tracks the largest 100 crypto assets by market cap, typically rebalanced on a schedule to keep weights aligned with the market.
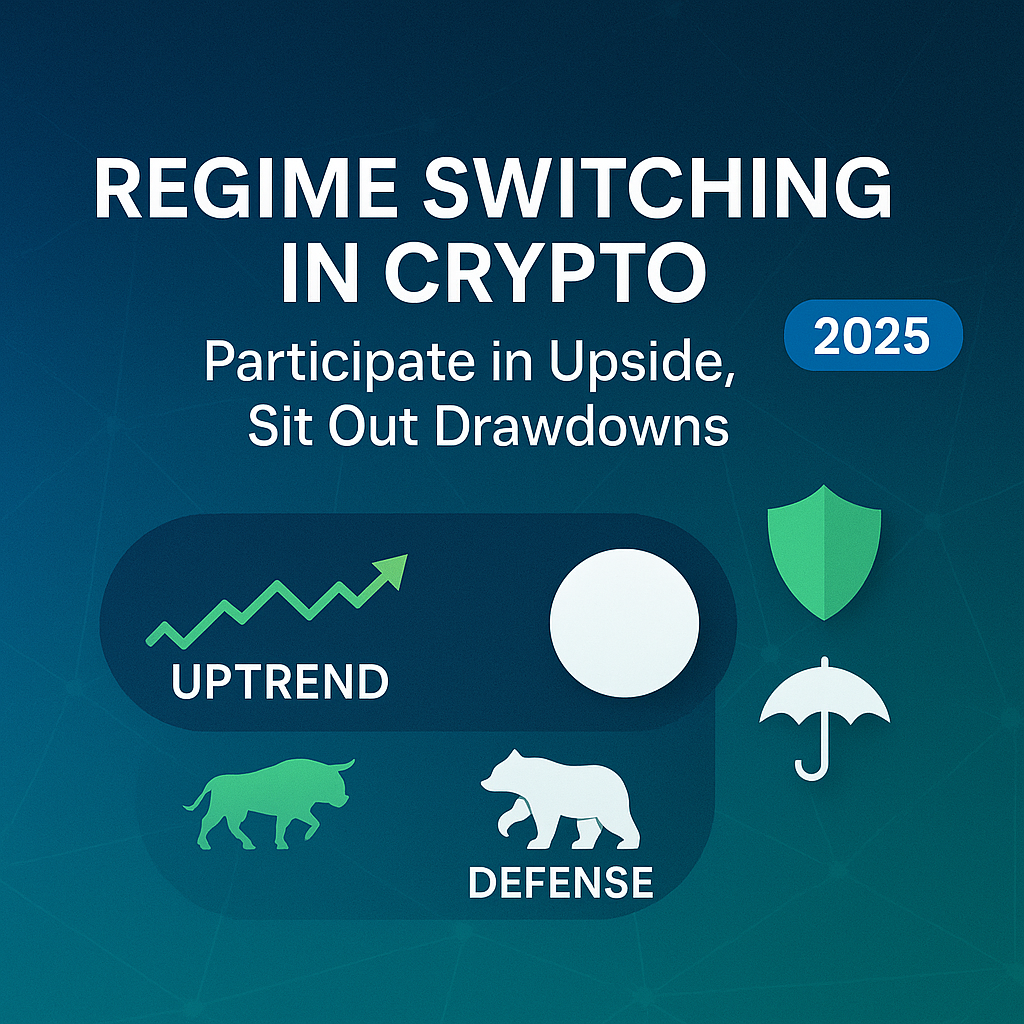
In 2025, that alone isn’t enough. You also need discipline for downtrends. TM Global 100 adds a regime-switching layer to move to stablecoins during bear phases—so you can participate in upside and sit out major drawdowns with a consistent, rules-based approach.
Regime switching:
Weekly rebalancing:
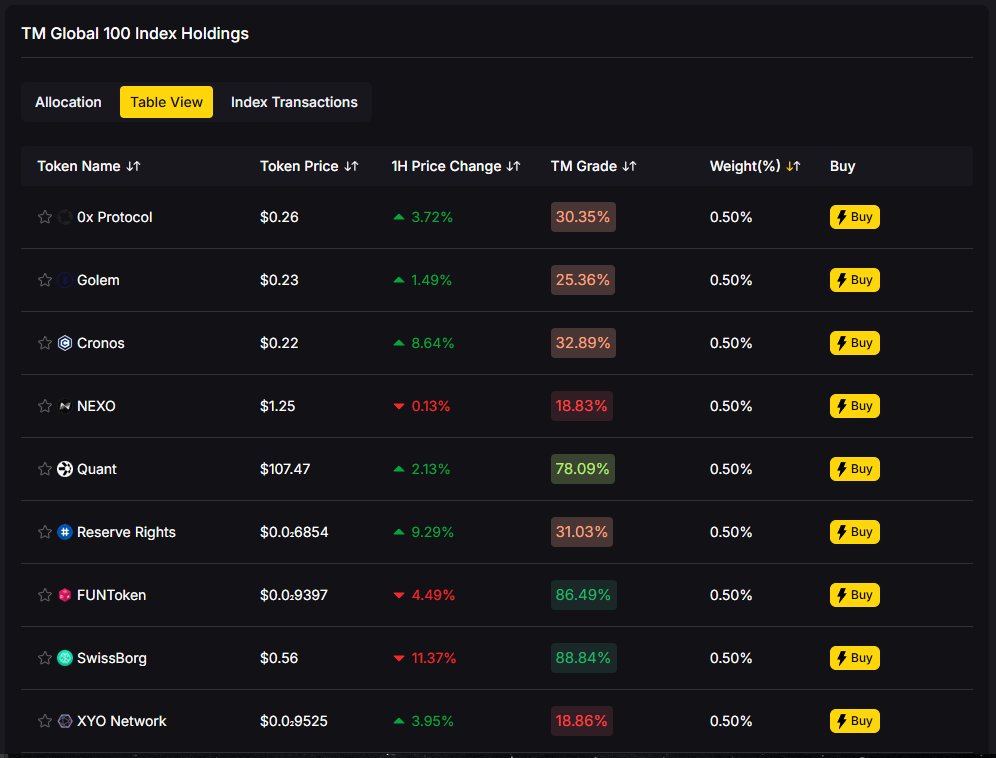
Transparency:
What you’ll see on launch:
Soft CTA: See the strategy and rules.
→ Join the waitlist to be first to trade TM Global 100.
What is a top 100 crypto index?
A rules-based basket tracking the largest 100 assets by market cap, typically with scheduled rebalancing. TM Global 100 adds regime switching to stablecoins during bear markets.
How often does the index rebalance?
Weekly. In addition, if the market signal flips, the entire portfolio may switch between tokens ↔ stablecoins outside the weekly cycle.
What triggers the move to stablecoins?
A proprietary market-regime signal. When it’s bearish, the index exits tokens to stablecoins and waits for a bullish re-entry signal.
Can I fund with USDC or fiat?
On launch, funding options surface based on your connected wallet and supported chains. USDC payouts are supported when selling.
Is the wallet custodial?
The embedded wallet is self-custodial—you control your funds.
How are fees shown?
Before you confirm a buy, you’ll see estimated gas, platform fee, max slippage, and minimum expected value—all up front.
How do I join the waitlist?
Go to the TM Global 100 page or the Indices hub and click Join Waitlist. You’ll get notified at launch with simple steps to buy.
Crypto is volatile and can lose value. Past performance is not indicative of future results. This article is for research/education, not financial advice.
A top 100 crypto index is the simplest path to broad market exposure—if it’s built with discipline. TM Global 100 combines transparent rules, weekly rebalancing, and a regime switch to stablecoins, so you can focus on your strategy while the core maintains itself.
Now’s the time to claim early access.
→ Join the waitlist to be first to trade TM Global 100.
Related Reads
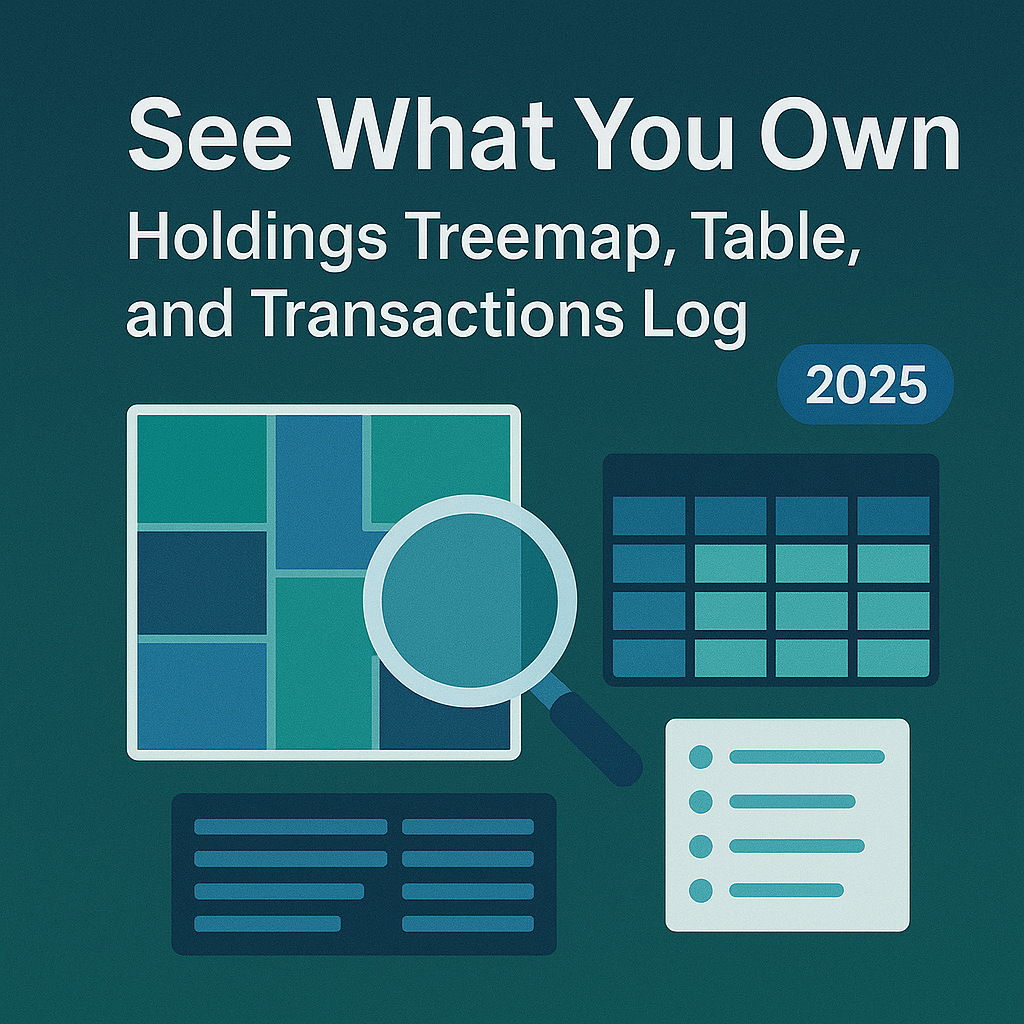
After a whipsaw year, many investors are asking how to stay exposed to crypto’s upside without riding every drawdown. Rules-based crypto indexing is a simple, disciplined answer: follow a transparent set of rules rather than gut feelings. The TM Global 100 puts this into practice—own the top-100 in bullish regimes, rotate to stablecoins in bearish regimes, and rebalance weekly. On top of that, you can see what you own in real time with a Holdings Treemap, Table, and Transactions Log. Less second-guessing, more process.
→ Join the waitlist to be first to trade TM Global 100.
What it is: A rules-based index that holds the top-100 in bull markets and moves to stablecoins in bear markets—paired with transparent holdings and transaction logs.
Why it matters: Weekly rebalances and clear regime logic bring structure after volatile cycles.
Who it’s for: Hands-off allocators and active traders who want a disciplined core with visibility.
Next step: Join the waitlist to be first to trade TM Global 100.
In a volatile cycle, emotion creeps in: chasing winners late, cutting losers early, or missing re-entry after fear. Rules-based crypto indexing applies consistent criteria—constituent selection, weighting, and rebalancing—so you don’t have to improvise in stress.
For readers comparing crypto index options, think of it as a codified playbook. A rules-based crypto index is a methodology-driven basket that follows predefined signals (e.g., market regime) and maintenance schedules (e.g., weekly rebalancing), aiming for repeatable behavior across cycles.
Featured snippet definition: Rules-based crypto indexing is a systematic approach that tracks a defined universe (e.g., top-100 by market cap) and maintains it on a fixed cadence, with explicit rules for when to hold tokens and when to de-risk into stablecoins.
See the strategy and rules. (TM Global 100 strategy)
→ Join the waitlist to be first to trade TM Global 100.
What is a rules-based crypto index?
A methodology-driven basket that follows predefined rules for asset selection, weighting, and maintenance. In TM Global 100, that means top-100 exposure in bullish regimes and stablecoins in bearish regimes, with weekly rebalancing and full transparency.
How often does the index rebalance?
Weekly. This cadence refreshes constituents and weights to align with current market-cap rankings; separate regime switches can move between tokens and stablecoins.
What triggers the move to stablecoins?
A documented market signal. When it turns bearish, the index exits to stablecoins; when bullish resumes, it re-enters the top-100 basket.
Can I fund with USDC or fiat?
Funding options will surface based on your connected wallet and supported rails. USDC settlement on sells is supported; fiat on-ramps may be added over time.
Is the wallet custodial?
No. The embedded wallet is self-custodial—you control your keys and assets.
How are fees shown?
Before confirming a trade, you’ll see estimated gas, platform fee, max slippage, and min expected value—so you can proceed with clarity.
How do I join the waitlist?
Go to the Indices hub, open TM Global 100, and enter your email. You’ll receive a launch-day link to buy.
After a volatile cycle, the edge is process. TM Global 100 combines rules-based crypto indexing, weekly rebalancing, and full transparency so you can participate in upside and step aside during bears—without running your own spreadsheets. If that’s the core you’ve been missing, join the waitlist now.
Related Reads:
.svg)


.png)
Token Metrics Media LLC is a regular publication of information, analysis, and commentary focused especially on blockchain technology and business, cryptocurrency, blockchain-based tokens, market trends, and trading strategies.
Token Metrics Media LLC does not provide individually tailored investment advice and does not take a subscriber’s or anyone’s personal circumstances into consideration when discussing investments; nor is Token Metrics Advisers LLC registered as an investment adviser or broker-dealer in any jurisdiction.
Information contained herein is not an offer or solicitation to buy, hold, or sell any security. The Token Metrics team has advised and invested in many blockchain companies. A complete list of their advisory roles and current holdings can be viewed here: https://tokenmetrics.com/disclosures.html/
Token Metrics Media LLC relies on information from various sources believed to be reliable, including clients and third parties, but cannot guarantee the accuracy and completeness of that information. Additionally, Token Metrics Media LLC does not provide tax advice, and investors are encouraged to consult with their personal tax advisors.
All investing involves risk, including the possible loss of money you invest, and past performance does not guarantee future performance. Ratings and price predictions are provided for informational and illustrative purposes, and may not reflect actual future performance.


%20Price%20Prediction%20.webp)


%20Price%20Prediction.webp)


