Text Link
Text Link
Text Link
Text Link
Thank you! Your submission has been received!
Oops! Something went wrong while submitting the form.

Stop Guessing, Start Trading: The Token Metrics API Advantage

Announcements

Big news: We’re cranking up the heat on AI-driven crypto analytics with the launch of the Token Metrics API and our official SDK (Software Development Kit). This isn’t just an upgrade – it's a quantum leap, giving traders, hedge funds, developers, and institutions direct access to cutting-edge market intelligence, trading signals, and predictive analytics.

Crypto markets move fast, and having real-time, AI-powered insights can be the difference between catching the next big trend or getting left behind. Until now, traders and quants have been wrestling with scattered data, delayed reporting, and a lack of truly predictive analytics. Not anymore.

The Token Metrics API delivers 32+ high-performance endpoints packed with powerful AI-driven insights right into your lap, including:

  • Trading Signals: AI-driven buy/sell recommendations based on real-time market conditions.
  • Investor & Trader Grades: Our proprietary risk-adjusted scoring for assessing crypto assets.
  • Price Predictions: Machine learning-powered forecasts for multiple time frames.
  • Sentiment Analysis: Aggregated insights from social media, news, and market data.
  • Market Indicators: Advanced metrics, including correlation analysis, volatility trends, and macro-level market insights.

Getting started with the Token Metrics API is simple:

  1. Sign up at www.tokenmetrics.com/api
  2. Generate an API key and explore sample requests.
  3. Choose a tier–start with 50 free API calls/month, or stake TMAI tokens for premium access.
  4. Optionally–download the SDK, install it for your preferred programming language, and follow the provided setup guide.

At Token Metrics, we believe data should be decentralized, predictive, and actionable. 

The Token Metrics API & SDK bring next-gen AI-powered crypto intelligence to anyone looking to trade smarter, build better, and stay ahead of the curve. With our official SDK, developers can plug these insights into their own trading bots, dashboards, and research tools – no need to reinvent the wheel.

Research

AAVE Price Prediction 2027: $70-$2,175 Forecast Analysis

Token Metrics Team
9 min read

AAVE Price Prediction 2027: Market Analysis and Scenario-Based Forecasts

Market Context for Aave Price Prediction: The Case for 2027

DeFi protocols are maturing beyond early ponzi dynamics toward sustainable revenue models. Aave operates in this evolving landscape where real yield and proven product-market fit increasingly drive valuations rather than speculation alone. Growing regulatory pressure on centralized platforms creates tailwinds for decentralized alternatives—factors that inform our comprehensive AAVE price prediction framework.

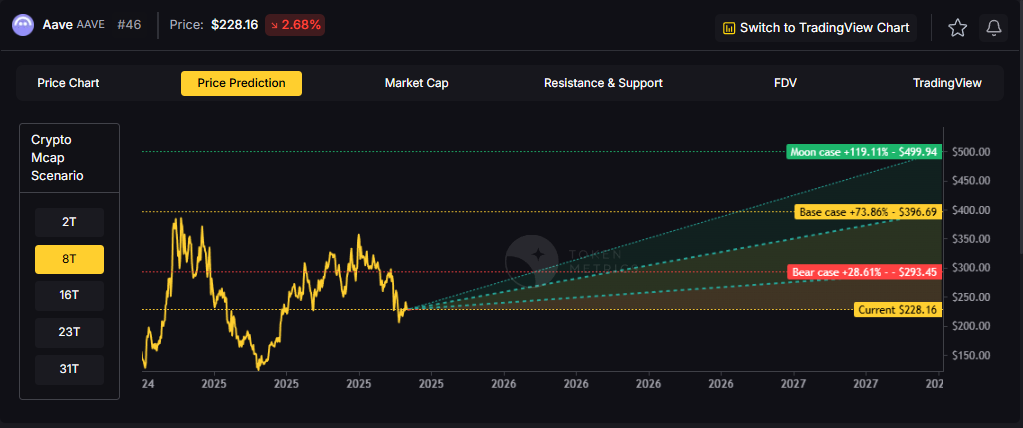
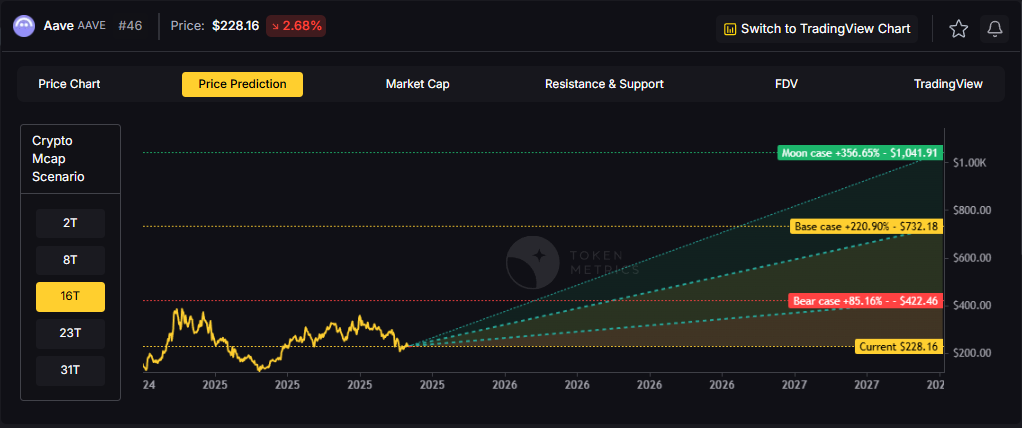
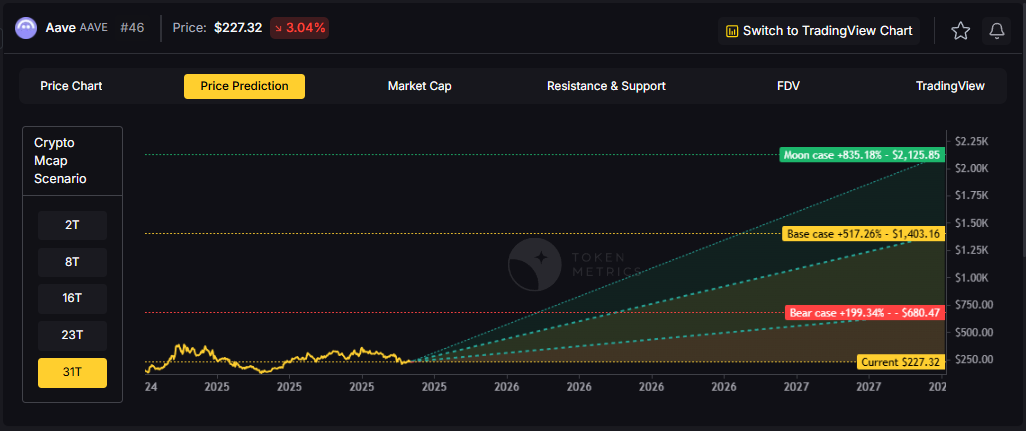
The scenario bands below reflect how AAVE price predictions might perform across different total crypto market cap environments. Each tier represents a distinct liquidity regime, from bear conditions with muted DeFi activity to moon scenarios where decentralized infrastructure captures significant value from traditional finance.


Disclosure

Educational purposes only, not financial advice. Crypto is volatile, do your own research and manage risk.

How to Read This AAVE Price Prediction

Each band blends cycle analogues and market-cap share math with TA guardrails. Base assumes steady adoption and neutral or positive macro. Moon layers in a liquidity boom. Bear assumes muted flows and tighter liquidity.

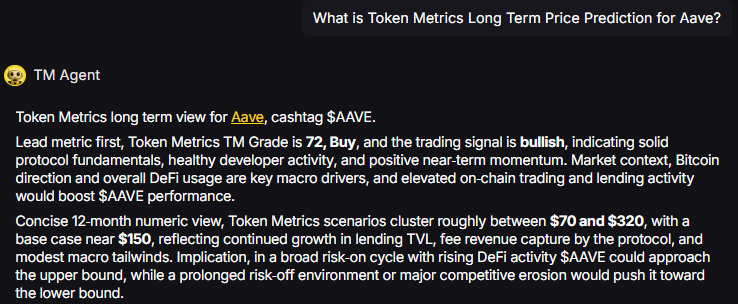
TM Agent baseline: Token Metrics TM Grade is 72, Buy, and the trading signal is bullish, indicating solid protocol fundamentals, healthy developer activity, and positive near-term momentum. Concise twelve-month numeric view, Token Metrics price prediction scenarios cluster roughly between $70 and $320, with a base case near $150, reflecting continued growth in lending TVL, fee revenue capture by the protocol, and modest macro tailwinds.

Live details: Aave Token Details

Affiliate Disclosure: We may earn a commission from qualifying purchases made via this link, at no extra cost to you.

Key Takeaways

  • Scenario driven, outcomes hinge on total crypto market cap, higher liquidity and adoption lift the bands.
  • Fundamentals: Fundamental Grade 75.51% (Community 77%, Tokenomics 100%, Exchange 100%, VC 49%, DeFi Scanner 70%).
  • Technology: Technology Grade 83.17% (Activity 75%, Repository 68%, Collaboration 92%, Security 78%, DeFi Scanner 70%).
  • TM Agent gist: scenarios cluster between $70 and $320 with base near $150, assuming steady lending TVL growth and neutral macro conditions.
  • Education only, not financial advice.

AAVE Price Prediction Scenario Analysis

Our Token Metrics price prediction framework spans four market cap tiers, each representing different levels of crypto market maturity and liquidity:

8T Market Cap - AAVE Price Prediction:

At an 8 trillion dollar total crypto market cap, AAVE projects to $293.45 in bear conditions, $396.69 in the base case, and $499.94 in bullish scenarios.

16T Market Cap - AAVE Price Prediction:

Doubling the market to 16 trillion expands the price prediction range to $427.46 (bear), $732.18 (base), and $1,041.91 (moon).

23T Market Cap - AAVE Price Prediction:

At 23 trillion, the price prediction scenarios show $551.46, $1,007.67, and $1,583.86 respectively.

31T Market Cap - AAVE Price Prediction:

In the maximum liquidity scenario of 31 trillion, AAVE price predictions could reach $680.47 (bear), $1,403.16 (base), or $2,175.85 (moon).

Each tier assumes progressively stronger market conditions, with the base case price prediction reflecting steady growth and the moon case requiring sustained bull market dynamics.

Why Consider the Indices with Top-100 Exposure

Aave represents one opportunity among hundreds in crypto markets. Token Metrics Indices bundle AAVE with top one hundred assets for systematic exposure to the strongest projects. Single tokens face idiosyncratic risks that diversified baskets mitigate.

Historical index performance demonstrates the value of systematic diversification versus concentrated positions.

Join the early access list

What Is Aave?

Aave is a decentralized lending protocol that operates across multiple EVM-compatible chains including Ethereum, Polygon, Arbitrum, and Optimism. The network enables users to supply crypto assets as collateral and borrow against them in an over-collateralized manner, with interest rates dynamically adjusted based on utilization.

The AAVE token serves as both a governance asset and a backstop for the protocol through the Safety Module, where stakers earn rewards in exchange for assuming shortfall risk. Primary utilities include voting on protocol upgrades, fee switches, collateral parameters, and new market deployments.

Token Metrics AI Analysis

Token Metrics AI provides comprehensive context on Aave's positioning and challenges.

Vision: Aave aims to create an open, accessible, and non-custodial financial system where users have full control over their assets. Its vision centers on decentralizing credit markets and enabling seamless, trustless lending and borrowing across blockchain networks.

Problem: Traditional financial systems often exclude users due to geographic, economic, or institutional barriers. Even in crypto, accessing credit or earning yield on idle assets can be complex, slow, or require centralized intermediaries. Aave addresses the need for transparent, permissionless, and efficient lending and borrowing markets in the digital asset space.

Solution: Aave uses a decentralized protocol where users supply assets to liquidity pools and earn interest, while borrowers can draw from these pools by posting collateral. It supports features like variable and stable interest rates, flash loans, and cross-chain functionality through its Layer 2 and multi-chain deployments. The AAVE token is used for governance and as a safety mechanism via its staking program (Safety Module).

Market Analysis: Aave is a leading player in the DeFi lending sector, often compared with protocols like Compound and Maker. It benefits from strong brand recognition, a mature codebase, and ongoing innovation such as Aave Arc for institutional pools and cross-chain expansion. Adoption is driven by liquidity, developer activity, and integration with other DeFi platforms. Key risks include competition from newer lending protocols, regulatory scrutiny on DeFi, and smart contract risks. As a top DeFi project, Aave's performance reflects broader trends in decentralized finance, including yield demand, network security, and user trust. Its multi-chain strategy helps maintain relevance amid shifting ecosystem dynamics.

Fundamental and Technology Snapshot from Token Metrics

Fundamental Grade: 75.51% (Community 77%, Tokenomics 100%, Exchange 100%, VC 49%, DeFi Scanner 70%).


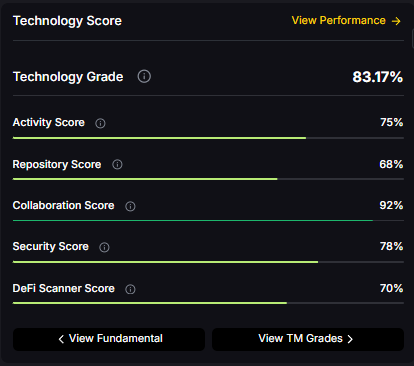
Technology Grade: 83.17% (Activity 75%, Repository 68%, Collaboration 92%, Security 78%, DeFi Scanner 70%).

Catalysts That Skew AAVE Price Predictions Bullish

  • Institutional and retail access expands with ETFs, listings, and integrations
  • Macro tailwinds from lower real rates and improving liquidity
  • Product or roadmap milestones such as upgrades, scaling, or partnerships

Risks That Skew AAVE Price Predictions Bearish

  • Macro risk-off from tightening or liquidity shocks
  • Regulatory actions or infrastructure outages
  • Concentration or competitive displacement in lending

AAVE Price Prediction FAQs

Can AAVE reach $1,000?

Yes. Based on our price prediction scenarios, AAVE could reach $1,007.67 in the 23T base case and $1,041.91 in the 16T moon case. Not financial advice.

Can AAVE 10x from current levels?

At current price of $228.16, a 10x would reach $2,281.60. This falls within the 31T moon case price prediction at $2,175.85 (only slightly below), and would require extreme liquidity expansion. Not financial advice.

What price could AAVE reach in the moon case?

Our moon case price predictions range from $499.94 at 8T to $2,175.85 at 31T. These scenarios assume maximum liquidity expansion and strong Aave adoption. Not financial advice.

What is the AAVE price prediction for 2027?

Our comprehensive 2027 price prediction framework suggests AAVE could trade between $293.45 and $2,175.85, depending on market conditions and total crypto market capitalization. The base case scenario clusters around $396.69 to $1,403.16 across different market cap environments. Not financial advice.

Is AAVE a good investment based on price predictions?

AAVE shows strong fundamentals (75.51% grade) and technology scores (83.17% grade), with bullish trading signals. However, all price predictions involve uncertainty and risk. Always conduct your own research and consult financial advisors before investing. Not financial advice.


Next Steps

Track live grades and signals: Token Details 

Join Indices Early Access

Want exposure? Buy AAVE on MEXC 

Disclosure

Educational purposes only, not financial advice. Crypto is volatile, do your own research and manage risk.

Why Use Token Metrics?

  • AI-driven crypto and DeFi grades for risk management and alpha discovery.
  • Quantitative, on-chain signals and robust scenario modeling for tokens like AAVE.
  • Access in-depth research reports, analyst perspectives, auto-grades, and portfolio tools from Token Metrics.
Research

x402 & HTTP 402 Explained: Why Wallet-Paid API Calls Are Winning (and Where Token Metrics Fits)

Token Metrics Team
10 min read

What Is x402?

x402 is an open-source, HTTP-native payment protocol developed by Coinbase that enables pay-per-call API access using crypto wallets. It leverages the HTTP 402 Payment Required status code to create seamless, keyless API payments.

It eliminates traditional API keys and subscriptions, allowing agents and applications to pay for exactly what they use in real time. It works across Base and Solana with USDC and selected native tokens such as TMAI.

Start using Token Metrics X402 integration here. https://www.x402scan.com/server/244415a1-d172-4867-ac30-6af563fd4d25 

TLDR — The x402 Value Proposition

x402 transforms API access by making payments native to HTTP requests.

Feature

Traditional APIs

x402 APIs

Authentication

API keys, tokens

Wallet signature

Payment Model

Subscription, prepaid

Pay-per-call

Onboarding

Sign up, KYC, billing

Connect wallet

Rate Limits

Fixed tiers

Economic (pay more = more access)

Commitment

Monthly/annual

Zero, per-call only

How to use it: Add x-coinbase-402: true header to any supported endpoint. Sign payment with your wallet. The API responds immediately after confirming micro-payment.

Token Metrics integration: All public endpoints available via x402 with per-call pricing from $0.017 to $0.068 USDC (10% discount with TMAI token).

Explore live agents: https://www.x402scan.com/composer.

How HTTP 402 Payment Required Works — Technical Deep Dive

The Protocol Flow

The HTTP 402 status code was reserved in HTTP/1.1 in 1997 for future digital payment use cases and was never standardized for any specific payment scheme. x402 activates this path by using 402 responses to coordinate crypto payments during API requests.

  1. Step by step: Client makes an API request with the header x-coinbase-402: true.
  2. The server can return 402 with payment details such as amount, recipient, and chain.
  3. The client wallet signs and submits the payment transaction.
  4. The server verifies the payment on-chain, then processes the original request and returns 200 with data.

Why this matters: It eliminates intermediary payment processors, enables true machine-to-machine commerce, and reduces friction for AI agents.

Ecosystem Proof: x402 Is Winning — Three Validation Points

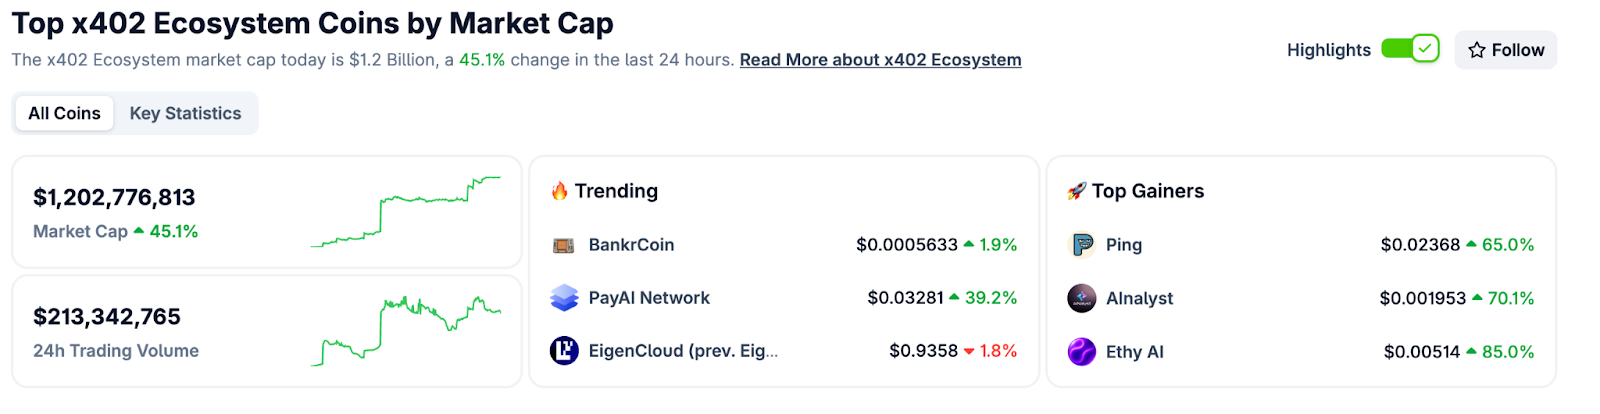
CoinGecko Recognition

CoinGecko launched a dedicated x402 Ecosystem category in October 2025, tracking 700+ projects with over $1 billion market cap and approximately $213 million in daily trading volume. Top performers include PING and Alnalyst, along with established projects like EigenCloud.


Base Network Adoption

Base has emerged as the primary chain for x402 adoption, with 450,000+ weekly transactions by late October 2025, up from near-zero in May. This growth demonstrates real agent and developer usage.

x402scan Composer — Where Agents Pay in Real Time

Composer is x402scan's sandbox for discovering and using AI agents that pay per tool call. Users can open any agent, chat with it, and watch tool calls and payments stream in real time.

Top agents include AInalyst, Canza, SOSA, and NewEra. The Composer feed shows live activity across all agents.


Explore Composer: https://x402scan.com/composer 
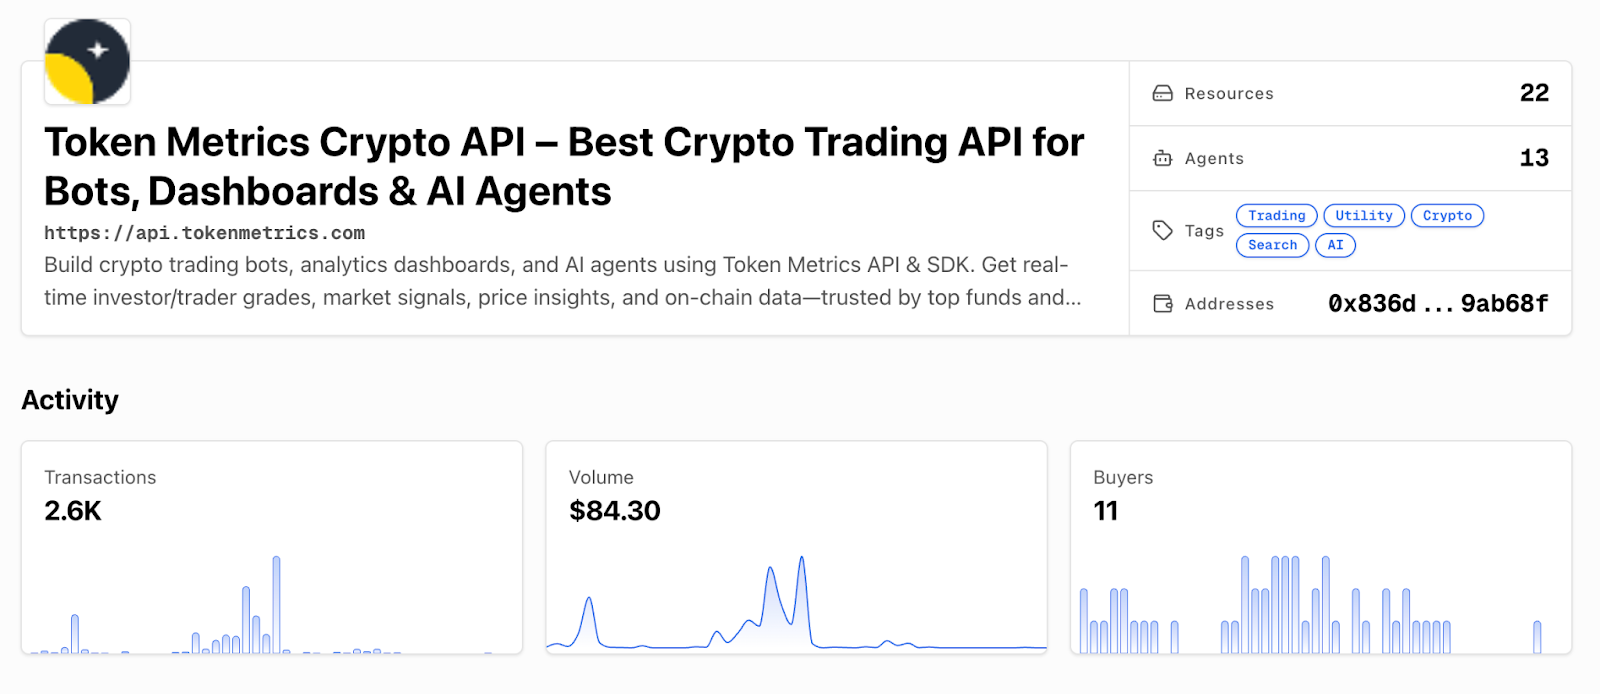
Token Metrics x402 Integration — Concrete Implementation

What We Ship

Token Metrics offers all public API endpoints via x402 with no API key required. Pay per call with USDC or TMAI for a 10 percent discount. Access includes trading signals, price predictions, fundamental grades, technology scores, indices data, and the AI chatbot.

Check out Token Metrics Integration on X402. https://www.x402scan.com/server/244415a1-d172-4867-ac30-6af563fd4d25 


Data as of October, 2025.

Pricing Tiers


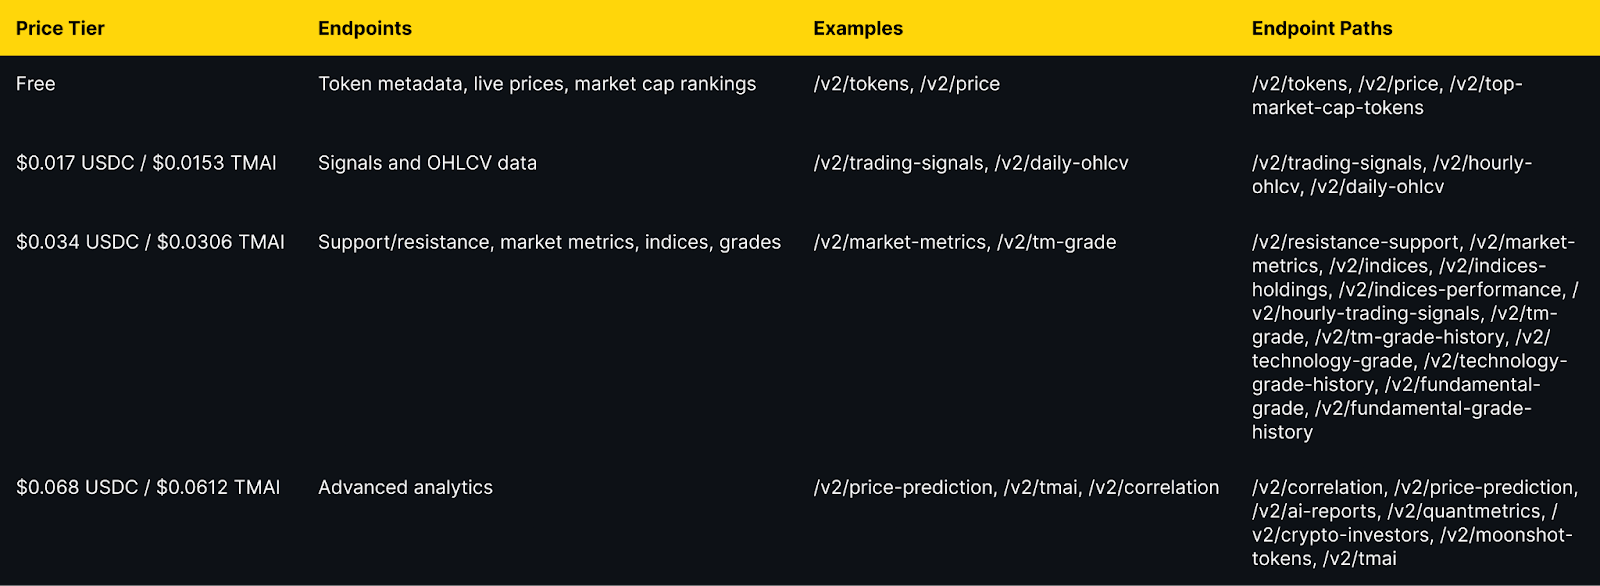
Important note: TMAI Spend Limit: TMAI has 18 decimals. Set max payment to avoid overspending. Example: 200 TMAI = 200 * (10 ** 18) in base units.

Full integration guide: https://api.tokenmetrics.com 

Why x402 Changes Everything for AI Agents

  • Eliminates onboarding friction. Agents can discover and use new APIs instantly without human intervention for API key management or billing setup.
  • Enables true agentic commerce. Agents pay for exactly what they use, which makes micro-transactions economically viable. This unlocks composition of multiple specialized services.
  • Aligns incentives. API providers get paid per call, users only pay for value received, and agents can optimize costs by choosing best-fit providers. Network effects accelerate as more endpoints adopt x402.

Use Cases Already Working

  • Crypto analytics agents: Pull Token Metrics data on demand to answer market questions, generate trade signals, or build custom dashboards.
  • Research automation: Chain together x402 endpoints like Twitter search, Tavily extract, Firecrawl, and Token Metrics to gather and structure data.
  • Portfolio management: Agents monitor positions, fetch real-time prices, calculate risk metrics, and execute rebalancing decisions using paid data sources.
  • Trading strategy backtests: Access historical OHLCV, grades, and signals data via x402 without committing to monthly subscriptions.
  • Multi-chain intelligence: Combine Base and Solana x402 services for cross-chain analysis and arbitrage discovery.

Ecosystem Participants and Tools

Active x402 Endpoints

Key endpoints beyond Token Metrics include Heurist Mesh for crypto intelligence, Tavily extract for structured web content, Firecrawl search for SERP and scraping, Twitter or X search for social discovery, and various DeFi and market data providers.

Infrastructure and Tools

  • x402scan: Explorer and analytics platform tracking all x402 activity across chains.
  • Composer: Hosted sandbox for discovering and using x402-enabled agents.
  • x402-axios and x402-httpx: Client libraries for Node.js and Python.
  • Coinbase Agent Kit: SDK integration for building x402-native agents.
  • LangChain connectors: Framework integration for agent workflows.

Common Questions About x402

How is x402 different from traditional API keys?

x402 uses wallet signatures instead of API keys. Payment happens per call rather than via subscription. No sign-up, no monthly billing, no rate limit tiers. You pay for exactly what you use.

Which chains support x402?

Currently Base and Solana. Most activity is on Base with USDC as the primary payment token. Some endpoints accept native tokens like TMAI for discounts.

Do I need to trust the API provider with my funds?

No. Payments are on-chain and verifiable. You approve each transaction amount. No escrow or prepayment is required.

What happens if a payment fails?

The API returns 402 Payment Required again with updated payment details. Your client retries automatically. You do not receive data until payment confirms.

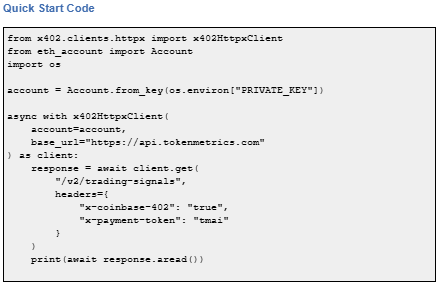
Can I use x402 with existing API clients?

Yes, with x402 client libraries such as x402-axios for Node and x402-httpx for Python. These wrap standard HTTP clients and handle the payment flow automatically.

Getting Started Checklist

  1. Set up a wallet: Create a Base wallet with USDC or TMAI balance.
  2. Install x402 client: npm install x402-axios or pip install x402-httpx.
  3. Choose an endpoint: Browse x402scan or Composer for available APIs.
  4. Write minimal code: Add x-coinbase-402: true header to requests.
  5. Watch payments flow: Monitor transactions in your wallet and on x402scan feed.
  6. Optimize costs: Compare endpoint pricing, use TMAI for 10% discount, cache results when appropriate.

Token Metrics x402 Resources

What's Next for x402

Ecosystem expansion. More API providers adopting x402, additional chains beyond Base and Solana, standardization of payment headers and response formats.

Agent sophistication. As x402 matures, expect agents that automatically discover and compose multiple paid endpoints, optimize costs across providers, and negotiate better rates for bulk usage.

Disclosure

Educational content only, not financial advice. API usage and crypto payments carry risks. Verify all transactions before signing. Do your own research.

Frequently Asked Questions

Research

Top 10 Pump.fun Livestream Tokens by Fees Earned

Token Metrics Team
7 min read


Opening Hook

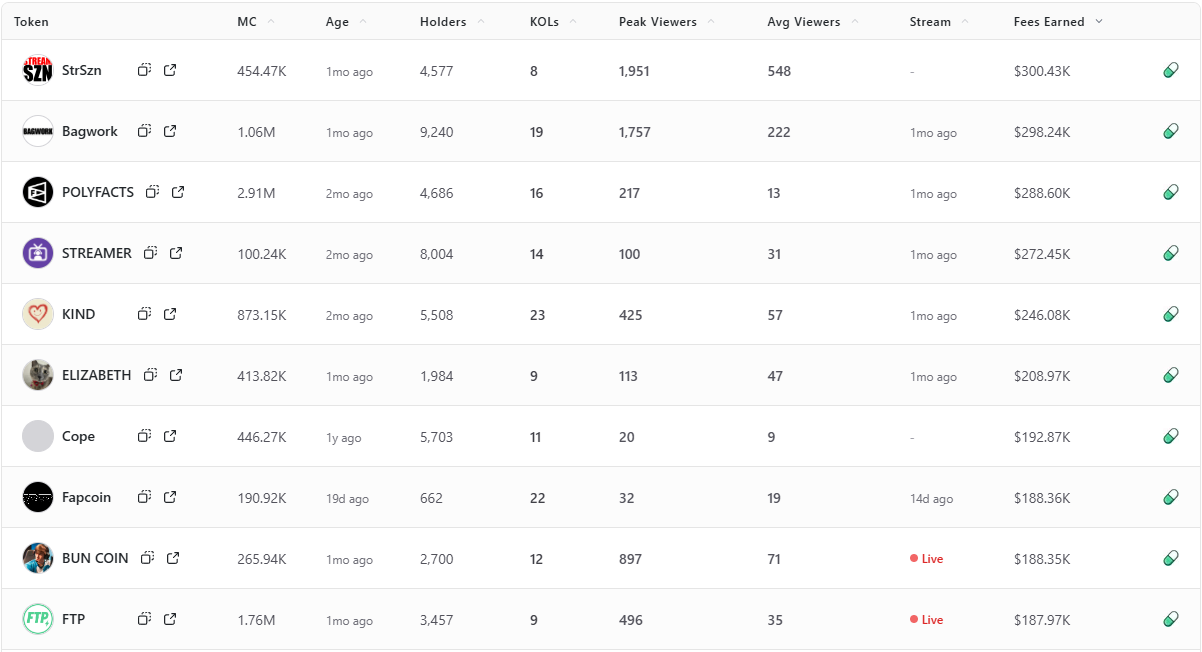
Fees Earned is a clean way to see which livestream tokens convert attention into on-chain activity. This leaderboard ranks the top 10 Pump.fun livestream tokens by Fees Earned using the screenshot you provided.

Selection rule is simple, top 10 by Fees Earned from the screenshot, numbers appear exactly as shown. If a field is not in the image, it is recorded as —.

Entity coverage: project names and tickers are taken as listed on Pump.fun, chain is Solana, sector is livestream meme tokens and creator tokens.

Featured: Token Metrics Live (TMLIVE) — Why We Built on Pump.fun

Token Metrics Live (TMLIVE) brings real time, data driven crypto market analysis to Pump.fun. The team has produced live crypto content for 7 years with a 500K plus audience and a platform of more than 100,000 users. Our public track record includes early coverage of winners like MATIC and Helium in 2018.

TMLIVE Quick Stats, as captured

  • ATH market cap: $291.7K
  • 24 hour volume on day one: $1.7M
  • Holders at capture: ~876
  • Current market cap at capture: $36.1K, displayed price: $0.043, visible chart timestamp: 22:33:49 UTC
  • Ticker: TMLIVE, Chain: Solana, Contract: 8Dxpc8Q8jg7TK8TT1pVntcqunHGofqpetCaP5fEhpump
  • Use these as captured numbers when referencing day one results. If you update screenshots later, swap in the new captures.

TLDR: Fees Earned Leaders at a Glance

  • Fees Earned: StrSzn ranks first with strong peak and average viewership for its size.
  • Fees Earned: Bagwork and POLYFACTS are close behind, both with large holder bases and double digit KOL counts.
  • Fees Earned: KIND shows the biggest KOL presence in the top 10, aligned with solid viewer averages.
  • Fees Earned: Newer names like Fapcoin appear despite modest viewer counts, proof that recency and focused pushes can drive fees.
  • Fees Earned: Live status correlates with short bursts for BUN COIN and FTP, while sustained averages matter over time.

Pump.fun Fees Earned Leaderboard (Top 10)


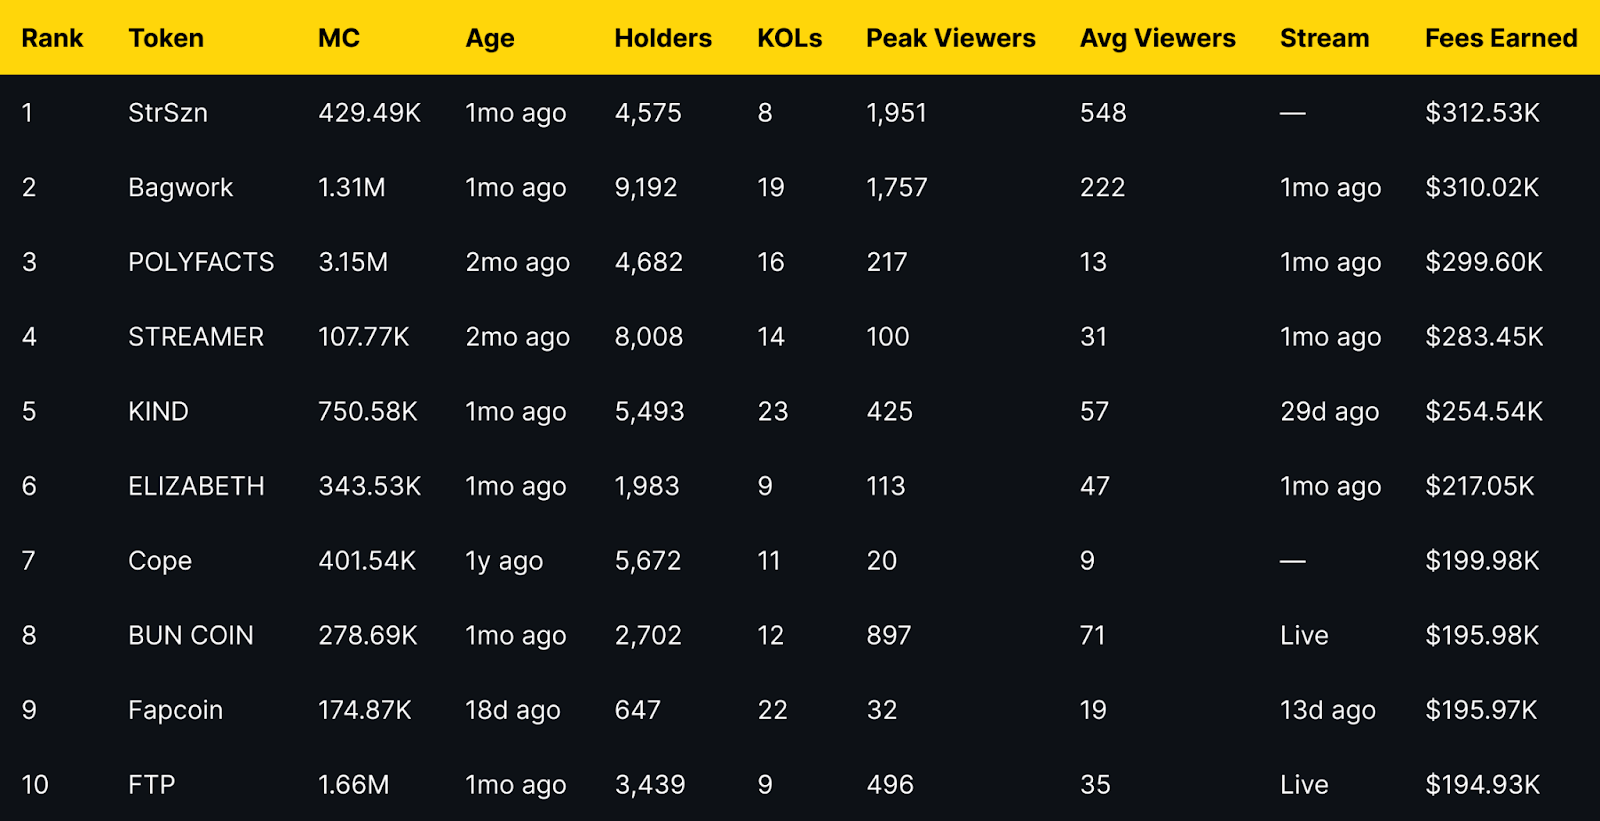
Short distribution note: the top three sit within a narrow band of each other, while mid-table tokens show a mix of older communities and recent streams. Several names with modest average viewers still appear due to concentrated activity during peaks.

Project Snapshots: What Each Token Does

StrSzn

Positioning: Active community meme with consistent viewer base.

Research Blurb: Project details unclear at time of writing. Fees and viewership suggest consistent stream engagement over the last month.

Quick Facts: Chain = Solana, Status = —, Peak Viewers = 1,951, Avg Viewers = 548.


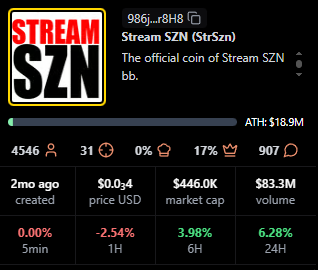
https://pump.fun/coin/986j8mhmidrcbx3wf1XJxsQFvWBMXg7gnDi3mejsr8H8

Bagwork

Positioning: Large holder base with sustained attention.

Research Blurb: Project details unclear at time of writing. Strong holders and KOL presence supported steady audience numbers.

Quick Facts: Chain = Solana, Status = 1mo ago, Holders = 9,192, KOLs = 19.


https://pump.fun/coin/7Pnqg1S6MYrL6AP1ZXcToTHfdBbTB77ze6Y33qBBpump

POLYFACTS

Positioning: Higher market cap with light average viewership.

Research Blurb: Project details unclear at time of writing. High market cap with comparatively low average viewers implies fees concentrated in shorter windows.

Quick Facts: Chain = Solana, Status = 1mo ago, MC = 3.15M, Avg Viewers = 13.


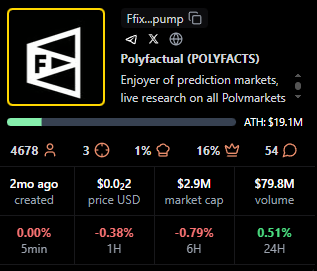
https://pump.fun/coin/FfixAeHevSKBZWoXPTbLk4U4X9piqvzGKvQaFo3cpump

STREAMER

Positioning: Community focused around streaming identity.

Research Blurb: Project details unclear at time of writing. Solid holders and moderate KOL count, steady averages over time.

Quick Facts: Chain = Solana, Status = 1mo ago, Holders = 8,008, KOLs = 14.


https://pump.fun/coin/3arUrpH3nzaRJbbpVgY42dcqSq9A5BFgUxKozZ4npump

KIND

Positioning: Heaviest KOL footprint in the top 10.

Research Blurb: Project details unclear at time of writing. The largest KOL count here aligns with above average view metrics and meaningful fees.

Quick Facts: Chain = Solana, Status = 29d ago, KOLs = 23, Avg Viewers = 57.


https://pump.fun/coin/V5cCiSixPLAiEDX2zZquT5VuLm4prr5t35PWmjNpump

ELIZABETH

Positioning: Mid-cap meme with consistent streams.

Research Blurb: Project details unclear at time of writing. Viewer averages and recency indicate steady presence rather than single spike behavior.

Quick Facts: Chain = Solana, Status = 1mo ago, Avg Viewers = 47, Peak Viewers = 113.


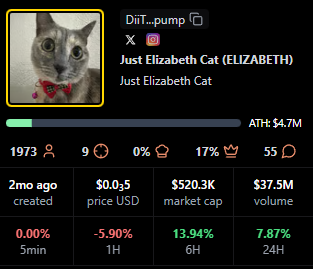
https://pump.fun/coin/DiiTPZdpd9t3XorHiuZUu4E1FoSaQ7uGN4q9YkQupump

Cope

Positioning: Older token with a legacy community.

Research Blurb: Project details unclear at time of writing. Despite low recent averages, it holds a sizable base and meaningful fees.

Quick Facts: Chain = Solana, Status = —, Age = 1y ago, Avg Viewers = 9.


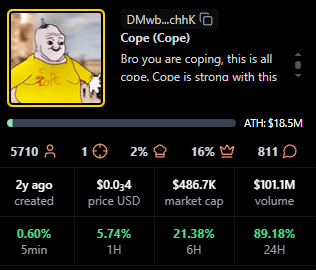
https://pump.fun/coin/DMwbVy48dWVKGe9z1pcVnwF3HLMLrqWdDLfbvx8RchhK

BUN COIN

Positioning: Currently live, strong peaks relative to size.

Research Blurb: Project details unclear at time of writing. Live streaming status often coincides with bursts of activity that lift fees quickly.

Quick Facts: Chain = Solana, Status = Live, Peak Viewers = 897, Avg Viewers = 71.


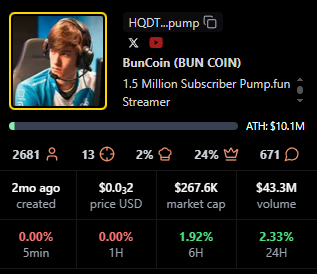
https://pump.fun/coin/HQDTzNa4nQVetoG6aCbSLX9kcH7tSv2j2sTV67Etpump

Fapcoin

Positioning: Newer token with targeted pushes.

Research Blurb: Project details unclear at time of writing. Recent age and meaningful KOL support suggest orchestrated activations that can move fees.

Quick Facts: Chain = Solana, Status = 13d ago, Age = 18d ago, KOLs = 22.


https://pump.fun/coin/8vGr1eX9vfpootWiUPYa5kYoGx9bTuRy2Xc4dNMrpump

FTP

Positioning: Live status with solid mid-table view metrics.

Research Blurb: Project details unclear at time of writing. Peaks and consistent averages suggest an active audience during live windows.

Quick Facts: Chain = Solana, Status = Live, Peak Viewers = 496, Avg Viewers = 35.


https://pump.fun/coin/J2eaKn35rp82T6RFEsNK9CLRHEKV9BLXjedFM3q6pump

Signals From Fees Earned: Patterns to Watch

Fees Earned often rise with peak and average viewers, but timing matters. Several tokens here show concentrated peaks with modest averages, which implies that well timed announcements or coordinated segments can still produce high fees.

Age is not a blocker for this board. Newer tokens like Fapcoin appear due to focused activity, while older names such as Cope persist by mobilizing established holders. KOL count appears additive rather than decisive, with KIND standing out as the KOL leader.

Why Fees Earned Matters for Creators and Traders

For creators, Fees Earned reflects whether livestream moments translate into on-chain action. Design streams around clear calls to action, align announcements with segments that drive peaks, then sustain momentum with repeatable formats that stabilize averages.

For traders, Fees Earned complements market cap, viewers, and age. Look for projects that combine rising averages with consistent peaks, because those patterns suggest repeatable engagement rather than single event spikes.

Watch Real-Time Coverage on TV Live

TV Live is a fast way to follow real-time crypto market news, creator launches, and token breakdowns as they happen. You get context on stream dynamics, audience behavior, and on-chain activity while the story evolves.

CTA: Watch TV Live for real-time crypto market news →TV Live Link

CTA: Follow and enable alerts → TV Live

Why Crypto Investors Trust Token Metrics

Token Metrics is trusted for transparent data, crypto analytics, on-chain ratings, and investor education. Our platform offers cutting-edge signals and market research to empower your crypto investing decisions.

FAQs: Pump.fun Livestream and Fees Earned

What is the best way to track Pump.fun livestream leaders?

Tracking Pump.fun livestream leaders starts with the scanner views that show Fees Earned, viewers, and KOLs side by side, paired with live coverage so you see data and narrative shifts together.

Do higher fees predict higher market cap or sustained viewership?

Higher Fees Earned does not guarantee higher market cap or sustained viewership, it indicates conversion in specific windows, while longer term outcomes still depend on execution and community engagement.

How often do these rankings change?

Rankings can change quickly during active cycles, the entries shown here reflect the exact time of the screenshot.

Next Steps

  • Subscribe to TV Live updates → [NEWSLETTER_OR_ALERTS_LINK]
  • Read the next leaderboard post in this series.
  • Join the community stream on Pump.fun when a link is available.

Disclosure

This article is educational content. Cryptocurrency involves risk. Always do your own research.

Recent Posts

No Item Found
Research

How to Find Low Cap Altcoins with Maximum Growth Potential | Token Metrics Moonshots

Token Metrics Team
8 min

Cryptocurrency is one of the few markets where small investments can turn into life-changing gains—if you know where to look. The secret? Low cap altcoins with strong fundamentals, fresh narratives, and early momentum. These are often called moonshots—tokens that can 10x, 50x, or even 100x your portfolio.

But with thousands of projects launching every year, how do you separate noise from real opportunity?

This is where Token Metrics, the industry’s most powerful crypto analytics platform, gives you a massive edge. In this guide, you’ll learn exactly how to find high-potential low cap altcoins before they explode.

What Are Moonshots?

In crypto, a moonshot refers to a token that’s expected to deliver exponential returns—usually 10x or more—within a short to medium timeframe. These tokens often:

  • Have a market cap below $50 million
  • Are newly launched or under-discovered
  • Operate in trending sectors like AI, DePIN, L2s, or Real-World Assets
  • Are supported by strong narratives or early whale interest

Moonshots are high-risk, high-reward plays. They may not have widespread recognition yet, but they often show early signs of momentum—and if timed correctly, they can outperform even the biggest names in crypto.

How Do Moonshots Work?

Moonshots usually follow a predictable cycle:

1. Discovery Phase

Savvy traders, insiders, or analysts begin accumulating the token quietly. There’s little public attention, but strong fundamentals or a promising narrative.

2. Hype Trigger

Something sparks attention—this could be an influencer tweet, exchange listing, or key milestone. Volume begins to rise.

3. FOMO Phase

Retail investors pour in as the token gains traction. Price rallies dramatically in a short period.

4. Profit-Taking

Early entrants sell, leading to price volatility. If the project has long-term merit, it may consolidate and rally again. If not, it could retrace sharply.

The goal is to get in early—before the FOMO begins. And that’s where Token Metrics shines.

Why Token Metrics Is the Best Platform for Finding Moonshots

Token Metrics is an AI-powered crypto research platform that filters through thousands of tokens daily to highlight only those with real upside potential. Its proprietary Moonshots feature is specifically designed to uncover undervalued low cap altcoins before they trend on X (Twitter), YouTube, or Telegram.

Key Benefits:

  • AI-powered ratings based on technical, on-chain, and fundamental data
  • Real-time moonshot detection with transparent performance tracking
  • Seamless trading integration for quick entries
  • Past Moonshot ROI tracking to evaluate model accuracy
  • Bullish signal alerts and whale activity monitoring

Token Metrics doesn’t just show you what's trending—it shows you what’s about to trend.

How to Use Token Metrics to Find Moonshots

Here’s a step-by-step guide to using Token Metrics to discover low cap altcoins with maximum growth potential:

✅ Step 1: Go to the Ratings Page

  • From your Token Metrics dashboard, click on the “Ratings” tab.
  • This is where thousands of tokens are ranked daily based on Trader Grade (short-term upside) and Investor Grade (long-term fundamentals).

These scores are derived using over 80 data points, including:

  • Price momentum
  • Volume analysis
  • Sentiment scores
  • On-chain activity
  • Developer and GitHub activity

✅ Step 2: Click on the “Moonshots” Tab

At the top of the Ratings page, you’ll see the Moonshots tab—click it.

This tab highlights AI-flagged altcoins with breakout potential. These tokens are typically:

  • Low to mid-cap
  • Recently showing an upward trend in volume or price
  • Exhibiting bullish on-chain signals
  • Gaining attention in social channels

These are the best candidates for fast and explosive growth.

✅ Step 3: Review Key Metrics

Each token in the Moonshots section displays several key data points:

  • Trader Grade and its change over time
  • 24-Hour Volume – is attention building?
  • Market Cap – lower cap means higher potential upside
  • Date of Entry – when the token was first flagged
  • Live ROI Since Entry – how the pick has performed since being listed

You can also switch to the Past Moonshots tab to review historical picks and how they played out over 7–14 days. This transparency gives you confidence in the AI’s track record.

✅ Step 4: Choose a Token to Explore

Click on any token to open its Token Details Page.

Here, you’ll get in-depth analysis, including:

  • Live price chart
  • Key technical indicators (MACD, RSI, moving averages)
  • Tokenomics and utility breakdown
  • Whale wallet activity and top holders
  • Fundamental metrics like team, roadmap, and ecosystem

Use this data to perform a quick due diligence check before buying. This helps reduce risk and boost conviction.

✅ Step 5: Buy in Seconds

Once you’ve selected a moonshot you like:

  • Click the “Buy” button directly from the Moonshots page.
  • A swap widget will open, allowing you to purchase the token using your connected wallet.
  • You can buy directly from decentralized exchanges (DEXs) without leaving the platform.

This seamless flow—from research to execution—makes it incredibly easy to act quickly, which is crucial in fast-moving markets.

Real Examples of Moonshots That Delivered

Here are just a few examples of tokens previously flagged in Token Metrics Moonshots:

  • Gorbagana – Gained over 50% in a day
  • Useless Coin – Jumped 40% in 24 hours
  • Startup Coin – Delivered a 9x return over a month

These weren’t hyped on mainstream platforms—Token Metrics identified them early using AI-based indicators and on-chain data.

Final Thoughts: Find Your Next 100x

Finding low cap altcoins with maximum growth potential doesn’t have to be based on luck or hype. With the right tools, strategy, and platform, you can identify moonshots before they go parabolic.

Token Metrics Moonshots gives you the insights, data, and tools needed to make smarter, faster, and more confident trading decisions. From AI-powered ratings to seamless swap integration, it’s your all-in-one dashboard for finding the next big crypto opportunity.

So if you're serious about building wealth in the next bull run, don’t just follow the herd—get ahead of it.

🚀 Start your 7-day free trial at and unlock real-time access to Moonshots.

Crypto Basics

How to Find Undervalued Altcoins That Could 100x | Token Metrics Moonshots

Token Metrics Team
8 min

In the fast-paced world of crypto, finding an altcoin before it explodes is every investor’s dream. The reality? Most people arrive too late—after the hype, after the parabolic move, and after the gains are gone. But what if there was a way to spot these undervalued altcoins before they skyrocket?

In this guide, we’ll show you how to find 100x altcoins early using a proven strategy powered by Token Metrics Moonshot Ratings. Whether you're a seasoned trader or a curious beginner, this step-by-step framework will help you identify tokens that are flying under the radar—but not for long.

What Are Moonshots?

In crypto, a moonshot is a token with the potential to deliver extraordinary returns, sometimes as high as 100x or even 1000x. These tokens typically start with:

  • Low market cap
  • High volatility
  • Speculative narratives
  • Early-stage community engagement

While some moonshots are driven by memes or hype, the best ones are backed by emerging narratives, strong tokenomics, and real momentum. The trick is to find them before they hit mainstream attention.

How Moonshot Altcoins Work

Moonshots follow a pattern:

  1. Early Accumulation Phase
    Smart money—whales, insiders, or savvy analysts—start quietly buying the token while it’s still underpriced and unknown.
  2. Sentiment + Volume Spike
    Word begins to spread. Crypto Twitter, Telegram groups, and early backers begin to create buzz. This brings in more liquidity and attention.
  3. Parabolic Price Action
    As FOMO (Fear of Missing Out) kicks in, the price goes vertical. Retail investors pile in. This is when the token moons.
  4. Top and Correction
    The token either consolidates, retraces, or crashes as early investors take profits and late entrants get burned.

Your goal? Enter in Phase 1 or early Phase 2, before everyone else sees the opportunity.

So how do you do that? With data—not hype.

How to Use Token Metrics to Find Moonshots

Token Metrics is one of the most powerful AI-driven platforms for crypto research. It helps you filter out the noise and identify undervalued altcoins with moonshot potential based on over 80 data points including technicals, fundamentals, on-chain activity, and sentiment.

Here’s a step-by-step guide to using Token Metrics’ Moonshots feature:

✅ Step 1: Go to the Ratings Page

Once you log in to Token Metrics, head over to the Ratings tab.

This is the heart of the platform, where every token is scored using:

  • Trader Grade – Best for short-term price action predictions
  • Investor Grade – Better for long-term conviction

You’ll see a ranked list of tokens with up-to-date analytics based on market behavior.

Tip: Sort by Trader Grade change to find tokens gaining momentum fast.

✅ Step 2: Click on the “Moonshots” Tab

Inside the Ratings page, look for the Moonshots tab near the top.

This is where Token Metrics highlights altcoins with breakout potential, flagged by proprietary AI models that monitor price anomalies, trend shifts, volume surges, and social indicators.

Only tokens that meet strict short-term upside criteria make it into this section.

✅ Step 3: Review Key Metrics

Each token in the Moonshots tab is presented with a powerful summary:

  • Trader Grade + % change
  • 24H Volume – Is money flowing in?
  • Market Cap – Lower cap = more potential for exponential growth
  • Date of Entry – How long has it been flagged as a moonshot?
  • Live ROI Since Entry – See how the token has performed since it was added to the list

Want to verify the track record? Switch to “Past Moonshots” to see historical picks and their 7–14 day performance.

✅ Step 4: Choose a Token to Explore

Click on a token to open its Token Details Page—this is where the real research begins.

You'll find:

  • Live chart and price action
  • On-chain data and sentiment
  • Top holders (including whales and smart wallets)
  • AI-generated technical indicators
  • Narrative tags (e.g., AI, DePIN, L2, Gaming)

This page helps you validate whether a moonshot token is worth the risk.

Is the project active on GitHub? Is the community growing? Are whales accumulating? All signs that a moonshot may be ready to launch.

✅ Step 5: Buy in Seconds

Found a token you like?

Token Metrics makes it easy to act:

  • Just click the Buy button from the Moonshots page.
  • This launches a swap widget integrated with top decentralized exchanges.
  • Choose your wallet, confirm the trade, and you're in—without ever leaving the platform.

This removes friction and saves time, especially when speed is critical.

Why Token Metrics Moonshots Beat Traditional Research

There are thousands of altcoins on the market—and most of them are noise. Token Metrics uses machine learning, real-time market signals, and historical backtesting to filter the noise and show you only the most promising tokens.

Key Advantages:

  • AI-Driven: Eliminates emotional bias
  • Real-Time Updates: Stay ahead of the crowd
  • Transparent ROI: Know which Moonshots actually delivered
  • Built-In Execution: One-click buy function saves time

Whether you're a degen chasing 10x tokens or a professional building a data-backed portfolio, Token Metrics gives you the edge.

Final Thoughts

Finding undervalued altcoins that can 100x isn’t about luck—it’s about information, timing, and execution.

Moonshots happen often in crypto. The problem is: most people are late. By the time you see it trending on X or featured in a YouTube video, the gains are gone.

Using a platform like Token Metrics, you can identify these tokens early, analyze them with confidence, and take action fast—all in one place.

If you're serious about leveling up your crypto trading game, start with the Moonshots feature on Token Metrics. Your next 100x altcoin could already be on the list.

✅ Ready to Hunt Moonshots?

Sign up for a 7-day free trial at www.tokenmetrics.com and unlock your edge in crypto today.

Research

How to Find the Next 100x Cryptocurrency Before Everyone Else | Token Metrics Moonshots

Token Metrics Team
8 min

In the world of crypto, timing is everything. If you’re trying to turn $100 into $10,000, the holy grail is finding the next 100x altcoin before the masses catch on. These explosive opportunities are rare, but with the right tools and strategy, they’re not impossible to uncover.

In this guide, we’ll show you exactly how to identify moonshot tokens—those under-the-radar gems that have the potential to skyrocket. You’ll also learn how to use Token Metrics, one of the most powerful AI-driven platforms, to spot them before they take off.

What Are Moonshot Cryptocurrencies?

“Moonshot” is a crypto-native term that refers to a low-cap cryptocurrency with the potential to deliver outsized returns, often 10x, 50x, or even 100x. These tokens may start unnoticed, trading at fractions of a penny, but once they gain traction, they can make early adopters massive profits in a very short period of time.

Key Traits of Moonshots:

  • Market cap under $50 million
  • High volatility with strong upward price potential
  • Community-driven marketing or narrative
  • Emerging sectors like AI, DePIN, Web3 infrastructure, or meme coins
  • Limited exchange listings (often only on DEXs)

Moonshots are risky—but with smart research and analytics, they can be strategic bets rather than blind gambles.

How Moonshots Work

Most 100x altcoins follow a predictable life cycle:

  1. Early Accumulation – Whales and savvy investors quietly accumulate before the public is aware.
  2. Trigger Catalyst – A social media trend, influencer mention, exchange listing, or big partnership sparks interest.
  3. Volume Surge – Trading activity spikes, liquidity increases, and price begins to move.
  4. Parabolic Rally – The token “moons” as retail investors jump in.
  5. Top Formation and Correction – Early investors take profits; latecomers often buy the top.

Catching a moonshot before Step 3 is your goal. You want to be in position before the breakout, not chasing after it.

This is where Token Metrics becomes invaluable.

Why Token Metrics Is the Best Tool for Discovering Moonshots

Token Metrics is a crypto analytics platform powered by AI, machine learning, and real-time data. It monitors thousands of tokens and ranks them using quantitative models, helping traders and investors find opportunities before they trend.

With features like:

  • Trader Grade and Investor Grade rankings
  • AI-generated signals
  • Real-time ROI tracking
  • Integrated trading functionality

…Token Metrics helps you act fast and stay ahead of the crowd.

Let’s walk through exactly how to use Token Metrics to find the next 100x cryptocurrency.

How to Use Token Metrics to Find Moonshots

Here’s a step-by-step guide to using Token Metrics’ Moonshot system to uncover high-potential altcoins.

✅ Step 1: Go to the Ratings Page

Once logged into the Token Metrics platform:

  • Navigate to the “Ratings” tab from the main dashboard.
  • This section ranks thousands of cryptocurrencies based on AI-calculated Trader Grade and Investor Grade.

Trader Grade is especially important for short-term breakout potential—it reflects the strength of a token’s momentum and technical setup.

✅ Step 2: Click on the “Moonshots” Tab

In the Ratings interface:

  • Click the “Moonshots” tab at the top.
  • This filters the token list to show only those identified as moonshot candidates by Token Metrics’ AI models.

These tokens are selected using proprietary algorithms that scan for:

  • Sudden volume surges
  • Rising trader grades
  • Favorable technical and social signals
  • Market cap anomalies

These are the coins flying just below the radar—with massive breakout potential.

✅ Step 3: Review Key Metrics

Each token in the Moonshots tab includes real-time, high-signal data to guide your decision-making:

  • Trader Grade: How strong is this token’s short-term setup?
  • Change in Trader Grade: Is momentum building?
  • 24-Hour Volume: Is there growing interest or liquidity?
  • Market Cap: The smaller the cap, the more upside (and risk).
  • Date of Entry: When was this token added to the Moonshots list?
  • Live ROI Since Moonshot: Has the token already moved—or is it still early?

You can also switch to Past Moonshots to see historical performance. Many past Moonshots have shown gains of 3x–20x within days of being listed.

✅ Step 4: Choose a Token to Explore

Click on any token from the Moonshots list to open its Token Details Page.

Here’s what you’ll find:

  • Live charts with technical indicators
  • Token fundamentals like supply, utility, and project roadmap
  • Top holder data to spot whales or early VC involvement
  • Sentiment scores and momentum shifts

This is where you do your research. Look for projects with:

  • Increasing community engagement
  • Clear narratives (e.g., AI, DePIN, meme, Layer 2)
  • Early whale accumulation
  • Undiscovered by influencers or major Twitter accounts

✅ Step 5: Buy in Seconds

Once you’ve found a token you like:

  • Hit the “Buy” button right from the Moonshots interface.
  • A swap widget will open inside Token Metrics.
  • Connect your wallet and execute the trade within seconds—no need to leave the platform.

This frictionless experience allows you to act immediately before the market catches on.

Pro Tips for Moonshot Hunting

Finding the next 100x crypto is part art, part science. Here are a few tips to sharpen your strategy:

  • Don’t Chase Pumps: Look for tokens with fresh momentum, not ones that are already up 500%.
  • Use On-Chain Data: Look for early accumulation, token holder growth, and low exchange balances.
  • Diversify: Don’t go all in on a single moonshot—spread risk across 3–5 plays.
  • Set Targets: Know your entry and exit strategy. Moonshots can reverse fast.

Final Thoughts

The next 100x altcoin won’t look obvious at first. It will likely be a small-cap token with limited press, an emerging narrative, and strong community energy.

By combining smart research, disciplined entries, and tools like Token Metrics Moonshots, you give yourself a major edge in spotting breakout coins before the explosion.

So stop guessing. Start using AI-powered insights to track moonshots, monitor early signals, and make informed trades that could change your portfolio—and your life.

🎯 Try Token Metrics now and unlock the Moonshots tab.
Visit: www.tokenmetrics.com

Crypto Basics

How to Find 100x Altcoins Before They Explode | Token Metrics Moonshot Guide

Token Metrics Team
8 min

In the world of cryptocurrency, the term “moonshot” isn’t just slang—it’s the dream. A moonshot is that rare token that delivers 100x or even 1000x returns, turning small investments into massive profits. But the real question is: how do you find these altcoins before they explode?

In this guide, we’ll break down what moonshots are, how they work, and most importantly, how to use Token Metrics—the leading AI-powered crypto analytics platform—to discover hidden gems before the crowd catches on.

What Are Moonshot Altcoins?

Moonshots are low market cap altcoins with high growth potential. These tokens often start under the radar, trading at fractions of a cent, and then experience explosive price action fueled by community hype, technical breakthroughs, or big news.

Common Traits of Moonshot Altcoins:

  • Market Cap < $50M – Small enough to grow exponentially
  • High Volatility – Swings of 20–100% daily are not unusual
  • Speculative Narrative – Often driven by trend cycles like AI, DePIN, or meme coin mania
  • Community Driven – Strong social momentum via X (Twitter), Telegram, or Discord
  • Limited Listings – Usually launched on decentralized exchanges (DEXs) before hitting major CEXs

These tokens carry high risk but also high reward. Timing and information are everything—and that’s where Token Metrics comes in.

How Moonshot Altcoins Work

The mechanics behind a moonshot typically follow a cycle of accumulation, hype, breakout, and profit-taking:

  1. Early Accumulation – Smart money (including whales and insiders) buys in at low prices.
  2. Volume Spike – Trading activity picks up as new investors notice price movements.
  3. Parabolic Move – Price jumps rapidly due to FOMO and social media hype.
  4. Peak & Correction – Early buyers take profits, causing volatility or sharp retracement.

Catching the token in Phase 1 or 2 is crucial. If you're entering during the parabolic move, the risk/reward ratio is much worse.

That’s why traders and investors rely on data and AI-powered tools like Token Metrics to identify moonshots before they explode.

How to Use Token Metrics to Find Moonshots

Token Metrics offers a dedicated Moonshots feature powered by machine learning models trained on thousands of historical signals. It helps you find high-potential altcoins before they go mainstream.

Here’s a step-by-step guide to finding moonshot tokens using Token Metrics:

✅ Step 1: Go to the Ratings Page

  • From your Token Metrics dashboard, navigate to the “Ratings” tab.
  • This is where tokens are scored using Trader Grade and Investor Grade, based on factors like:
    • Technical indicators
    • On-chain activity
    • Market momentum
    • Social sentiment

Trader Grade is especially important for identifying short-term opportunities and moonshot candidates.

✅ Step 2: Click on the “Moonshots” Tab

Inside the Ratings page:

  • Click the “Moonshots” tab at the top.
  • This filters tokens identified by the platform’s AI as having short-term explosive potential.

These are not random picks—they are selected based on:

  • Sharp trader grade increases
  • Unusual volume and price action
  • Sentiment spikes
  • Market cap vs. performance anomalies

The Moonshots page refreshes in real-time to capture fast-moving opportunities.

✅ Step 3: Review Key Metrics

Each token listed in the Moonshots section includes crucial data to guide your decisions:

  • Trader Grade (with % change over time)
  • 24-Hour Trading Volume – Helps gauge interest and momentum
  • Market Cap – Smaller cap = higher potential upside
  • Date of Entry – Know exactly when the token was flagged
  • Live ROI Since Moonshot – See how it’s performed since it was listed

Want to see past winners? Just switch to “Past Moonshots” to view previous AI picks and how they performed over 7–14 days. Many tokens in this category have delivered 5x–20x returns in a matter of days.

✅ Step 4: Choose a Token to Explore

Click on any token from the list to open its Token Details Page.

Here, you can:

  • View a real-time price chart
  • Read a breakdown of fundamentals, including tokenomics, roadmap, and sector
  • See top holders (whales, insiders, or project wallets)
  • Review technical indicators, volume trends, and volatility

This deep-dive view gives you everything you need to make an informed decision—not just guesswork.

✅ Step 5: Buy in Seconds

Once you’ve done your due diligence:

  • Click the “Buy” button directly on the Moonshots page.
  • This opens a swap widget that connects to top DEXs.
  • Choose your wallet, confirm the swap, and you’re done—no need to leave the platform.

This seamless process saves time and allows you to act quickly in a fast-moving market.

Why Token Metrics Is the Best Tool for Moonshot Hunting

Finding 100x altcoins is about timing, data, and confidence. Token Metrics gives you all three:

🔍 Data-Backed Confidence

No more relying on anonymous influencers or Telegram groups. Token Metrics backs every moonshot with quantifiable metrics.

🧠 AI-Powered Predictions

The platform’s models constantly analyze price, volume, sentiment, and chain activity to spot anomalies and early breakouts.

📈 Transparent Track Record

You can review past Moonshots and their ROI—transparency that few platforms offer.

💡 Trade-Ready UI

With integrated swap functionality, you can go from discovery to execution in under a minute.

Final Thoughts

Finding the next 100x altcoin is never easy—but with the right tools, your odds improve dramatically.

Moonshots are real, and they happen frequently in crypto. But they’re only lucrative if you find them early, analyze them rationally, and manage your risk.

With Token Metrics, you don’t have to chase hype—you can rely on real-time analytics, AI-powered ratings, and actionable insights to guide your moonshot hunting.

If you're serious about catching the next 100x gem, start using Token Metrics today.

🚀 Start your free trial and unlock the Moonshots tab at TokenMetrics.com

Research

Andrena and the Rise of DePIN: Decentralized Internet in 2025

Token Metrics Team
8 min

Introduction:
Decentralized Physical Infrastructure Networks (DePINs) are rapidly emerging as one of the most transformative sectors in the blockchain space. In 2025, projects like Andrena are pushing the boundaries of what’s possible by bridging real-world hardware with decentralized protocols. This blog takes a closer look at the DePIN thesis, Andrena’s approach, and why this project is on the radar of top investors and analysts.

What Is DePIN?

DePIN stands for Decentralized Physical Infrastructure Networks. It refers to blockchain-powered networks that coordinate real-world infrastructure using token-based incentives. Use cases include:

  • Wireless internet (e.g., Helium)
  • Sensor networks (e.g., WeatherXM)
  • Storage and compute (e.g., Filecoin, Akash, Arweave)
  • Energy grids (e.g., PowerPod)

In short, DePINs decentralize infrastructure deployment and management using blockchain-based coordination tools.

Why DePIN Matters in 2025

  1. Infrastructure Gaps: Billions remain unconnected to the internet or lack access to basic digital services. DePINs offer a way to close these gaps without reliance on centralized telecoms.
  2. Token Incentives for Network Participation: Hardware operators are rewarded for contributing bandwidth, compute, or coverage—creating a new economic model.
  3. Real-World Utility: Unlike speculative tokens, DePIN projects often provide visible, tangible value from day one.

Introducing Andrena: The Helium of the Internet?

Andrena is a DePIN project building a decentralized internet backbone through a combination of physical devices and blockchain protocols. The project is developing a hardware device called Black Box, expected to launch in July.

Key features:

  • Distributed, peer-to-peer wireless coverage
  • Web3 native incentives for node operators
  • No reliance on centralized ISPs
  • Tentative deployments in New York City, Mexico City, and Accra
  • Deep integration with Helium Network and its infrastructure

Andrena aims to give individuals and communities the power to run their own internet access points and be compensated in a decentralized system.

Why It’s Generating Buzz

Token Metrics researchers flagged Andrena as a top pick for long-term infrastructure exposure. Here's why:

  • Backed by Top VCs: In its upcoming Series B, Andrena is reportedly raising funds from major firms including Polychain Capital, Archetype, Wintermute, and Coinbase Ventures.
  • Mass Market Vision: The goal is not just to serve crypto-native users, but also everyday consumers who simply want affordable, decentralized internet access.
  • Multi-layered Integration: Andrena will offer both physical routers and a browser extension, enabling different levels of participation.

Strategic Partnerships and Rollout

The project is currently in soft-launch mode with localized pilots and is pursuing exchange listings later this year. While details remain limited, the focus is on building a global decentralized ISP layer—a radical shift from the existing internet access model.

Why Andrena Could Succeed Where Others Struggled

Previous attempts at decentralized internet often failed due to:

  • Poor hardware UX
  • Limited adoption outside of crypto users
  • Unclear monetization models

Andrena appears to be addressing these pain points with:

  • Consumer-grade devices
  • Partner integrations (e.g., Helium)
  • Clear token utility tied to network usage and coverage
  • A well-capitalized, experienced founding team

Risks and Unknowns

As with all early-stage infrastructure projects, there are risks:

  • Uncertain regulatory frameworks around ISPs
  • Capital intensity of hardware production and distribution
  • Network growth dependent on physical deployment
  • Limited token utility details at this stage

Investors and builders should stay informed as more information becomes public.

How Token Metrics Is Tracking DePIN Growth

The Token Metrics platform is actively monitoring the DePIN space through metrics such as:

  • TVL (Total Value Locked) in related ecosystems
  • Developer activity and GitHub velocity
  • On-chain signal strength and token accumulation
  • Fundamental and technical ratings

Projects like Andrena and its ecosystem partners are closely watched for early indicators of momentum.

Final Thoughts

DePIN is one of the most compelling frontiers in crypto. It offers real-world, real-time applications that go far beyond speculation. Andrena is at the center of this movement, blending telecom hardware, Web3 incentives, and global deployment.

While it's still early, the signs are promising. From reputable backers to ambitious global plans, Andrena is a project worth watching in 2025 and beyond.

Research

Meme Coins in 2025: Why They’re Still Outperforming the Crypto Market

Token Metrics Team
8 min

Introduction:
Even in a sluggish crypto market, meme coins continue to outperform many other asset classes. In 2025, these highly speculative assets are not only surviving—some are thriving. This blog examines the current state of the meme coin market, what’s driving the activity, and how on-chain data and crypto analytics can help decode the chaos.

Meme Coins: Still Relevant in 2025?

Despite a broadly bearish macro environment, meme coins remain among the few bright spots in the crypto market. In the latest Token Metrics research webinar, several meme tokens showed outsized returns, including:

  • Gorbagana – up over 50% in a day
  • Useless Coin – jumped 40% in 24 hours
  • Startup Coin – nearly 9x returns over the past month

These tokens operate at low market caps and often launch with little or no formal whitepaper or utility. However, the power of narrative, social engagement, and rapid speculation continues to drive short-term gains.

Why Meme Coins Are Performing in a Bear Market

1. Low Liquidity, High Volatility:
Small-cap meme tokens can easily generate parabolic moves with modest capital inflows.

2. Community-Led Narratives:
Tokens like Useless Coin and Startup thrive on viral momentum from crypto-native communities, particularly on X (Twitter) and Telegram.

3. Whale Activity as a Signal:
Token Metrics analysts observed that whales have been accumulating select meme coins. This isn’t an endorsement—but it’s a data point. Monitoring on-chain whale behavior offers clues about where smart money is moving.

The Gobagana Case Study

Gobagana was cited as a high-risk Solana fork with minimal public information, yet it rapidly gained traction. On-chain analysis revealed:

  • Whale wallets accumulating in the early phase
  • Early VC insiders (e.g., those connected to Big Brain VC) engaging with the token
  • Rapid social engagement despite a small follower base

The takeaway? Even opaque meme coins can trigger major rallies—particularly if accumulation patterns align with social volume.

Risk Management and Red Flags

The meme coin market is not without risk. The Token Metrics team emphasized several cautions:

  • Illiquidity: Many meme tokens have low volume and limited exchange listings.
  • Exit scams or soft rugs: Teams can abandon the project after price pumps.
  • Price discovery volatility: Tokens may have no clear valuation baseline and can retrace sharply.

As such, these assets are often best approached with a high-risk tolerance and clear entry/exit rules.

How to Track Meme Coins Like a Quant

Using crypto analytics platforms like Token Metrics can help make sense of meme coin volatility. Tools that help include:

  • Real-time sentiment analysis
  • Whale wallet tracking
  • Price-to-volume anomaly detection
  • Bullish/bearish signal tracking

In 2025, data is more important than hype. While memes may dominate the narrative, only data reveals when the momentum shifts.

Meme Coins vs. Infrastructure Projects

Interestingly, while meme coins have been surging, many infrastructure or protocol tokens remain flat. This divergence suggests that retail attention is still focused on short-term speculation.

That said, once Bitcoin breaks key resistance levels, we could see capital rotate into AI, DeFi, and infrastructure themes. Meme coins may be the “canary in the coal mine” indicating renewed retail appetite.

Final Thoughts

Meme coins remain the wild west of crypto—but they aren’t going away. In fact, they’re becoming more sophisticated, with deeper liquidity pools, faster launches, and increased integration with social media bots and automated token creators.

As always, meme coin trading demands discipline, skepticism, and a robust toolkit. Watch the whales, follow the data, and never trade what you don’t understand.

Research

How to Find Hidden Crypto Gems with 100x Potential (Step-by-Step Guide) | Token Metrics Moonshots

Token Metrics Team
8 min

In the fast-paced world of cryptocurrency, discovering hidden gems—often called moonshots—can lead to life-changing returns. But the real challenge lies in separating hype from actual potential. In this guide, we’ll break down what crypto moonshots are, how they work, and how you can use Token Metrics to reliably find tokens with 100x upside.

What Are Moonshot Tokens?

The term moonshot comes from the idea of a crypto token “going to the moon,” or rapidly increasing in price. These are usually low-cap tokens with a compelling narrative, innovative technology, or early-stage market presence that give them high upside potential.

Key Characteristics of Moonshot Tokens:

  • Market Cap Below $50M – Smaller market caps have more room to grow.
  • High Risk / High Reward – Volatility is expected, but the upside can be enormous.
  • Early Entry – Timing matters. Getting in early before mainstream awareness is key.
  • Backed by Fundamentals – Even moonshots need solid technology, use cases, or backing.

How Do Crypto Moonshots Work?

Moonshots rely on the combination of innovation, market timing, and community adoption. They often start unnoticed, then experience exponential growth once crypto traders and influencers catch on.

The Lifecycle of a Typical Moonshot:

  1. Discovery Phase – A few savvy investors or analysts spot the token.
  2. Accumulation Phase – Early adopters buy in quietly, keeping prices low.
  3. Breakout Phase – News spreads, and trading volume spikes.
  4. Parabolic Run – FOMO (Fear of Missing Out) kicks in, driving price up rapidly.
  5. Profit-Taking or Collapse – Smart traders exit with gains; latecomers may be left holding the bag.

To avoid the trap of hype-driven tokens, it's essential to use data and analytics, not emotions. That’s where Token Metrics becomes your secret weapon.

How to Use Token Metrics to Find Monshots?

Token Metrics is an AI-powered crypto analytics platform that helps you discover high-potential tokens with real-time data, grades, and backtested indicators. Here’s a step-by-step guide to using Token Metrics to uncover 100x opportunities:

Step 1: Go to the Ratings Page

Start from the main dashboard of the Token Metrics app.

  • Navigate to the “Ratings” tab.
  • This page ranks thousands of tokens using AI-based Trader Grade and Investor Grade, factoring in technical indicators, on-chain metrics, sentiment, and more.

Pro Tip: Look for tokens with rising Trader Grades and strong historical performance.

Step 2: Click on the “Moonshots” Tab

Once you’re in the Ratings section:

  • Click the “Moonshots” tab at the top of the page.
  • This will filter the list down to tokens the AI model flags as having moonshot potential—i.e., tokens likely to perform exceptionally well in the short term.

These are automatically generated by Token Metrics AI models using over 80+ data points, including:

  • Price momentum
  • On-chain activity
  • Sentiment analysis
  • Volume spikes
  • Market structure

Step 3: Review Key Moonshot Metrics

Each Moonshot token is presented with a rich dataset to help you make informed decisions:

  • Trader Grade (with % change in past 24h or 7d)
  • 24H Trading Volume – Gauge market interest
  • Market Cap – Lower caps typically offer more upside
  • Date of Entry – See when the token was first flagged
  • Live ROI Since Moonshot – Know exactly how past picks performed

Bonus Feature: Toggle to “Past Moonshots” to review previous winners and assess the track record of the platform.

Step 4: Choose a Token to Explore

Click on any token in the Moonshots list to open its Token Details Page.

Here, you can:

  • Analyze real-time charts
  • Review fundamentals, like project utility, tokenomics, roadmap, and team
  • See top holders and whale activity
  • Examine price volatility and volume patterns

This is where research and intuition meet. Use the available data to decide if this token fits your risk tolerance and investment thesis.

Step 5: Buy in Seconds

Token Metrics makes the process seamless:

  • Just click the “Buy” button on the Moonshots page.
  • This opens a swap widget powered by integrated DEX aggregators.
  • Choose your wallet, approve the transaction, and you're done—no need to leave the platform.

This integration eliminates the hassle of going to third-party platforms to execute trades, saving time and reducing risk.

Why Use Token Metrics for Finding Moonshots?

Token Metrics isn’t just about flashy picks—it’s about using data science and AI to gain an edge.

Key Benefits:

  • AI-Driven Insights – No emotional bias; just pure data analysis.
  • Transparency – View past moonshot performance, live ROI, and update dates.
  • Speed to Trade – Instant buy options right from the dashboard.
  • Performance Tracking – Evaluate your results based on entry/exit signals.

Real Examples: Token Metrics in Action

  • Euler Finance was flagged as a Moonshot before its 30% rally—validated by a bullish AI signal.
  • Morpho gained traction after appearing in the Moonshots list, later becoming a top TVL gainer.
  • Hyperliquid made the list before capturing major perp trading market share.

By combining early AI alerts with your own due diligence, you can position yourself ahead of the crowd.

Final Thoughts

Finding the next 100x crypto gem doesn’t have to be a guessing game. While the crypto space remains volatile, tools like Token Metrics help stack the odds in your favor. From real-time ratings to instant buy options and performance metrics, you have everything you need to make smart, data-driven bets on the future of crypto.

So if you're serious about turning small investments into big wins, start using Token Metrics to uncover moonshots before they go mainstream.

Try Token Metrics today and unlock the power of AI-driven crypto investing.

Research

DeFi 3.0 and the Rise of Permissionless Lending – What's Changing in 2025?

Token Metrics Team
8 min

Introduction:
The DeFi landscape is evolving rapidly, and 2025 is shaping up to be a pivotal year. With innovations like permissionless lending, the ecosystem is transitioning into what many are calling DeFi 3.0. This blog explores what’s driving the shift, the platforms leading the charge, and what investors and developers need to know about this new wave.

What Is DeFi 3.0?

Decentralized finance (DeFi) has experienced two major innovation cycles:

  • DeFi 1.0 was defined by protocols like Uniswap, which revolutionized decentralized trading through automated market makers (AMMs).
  • DeFi 2.0 introduced concepts like protocol-owned liquidity, led by projects like OlympusDAO.

Now in DeFi 3.0, the focus has shifted to permissionless lending, advanced tokenomics, and integrated liquidity solutions.

The Core Drivers of DeFi 3.0

  1. Decentralization of Lending Access:
    Traditional DeFi lending platforms like AAVE require users to hold governance tokens or pass internal gatekeeping to create new markets. DeFi 3.0 protocols remove those barriers, allowing anyone to participate more freely.

  2. Integrated Liquidity and Lending:
    New platforms are enabling liquidity provision and borrowing from the same pool—merging the utility of DEXs with money markets.

  3. Improved Capital Efficiency:
    DeFi 3.0 focuses on optimizing the use of locked capital. Through smart contract automation, platforms allow users to earn on idle funds, reduce slippage, and optimize collateral.

Leading Platforms in the DeFi 3.0 Movement

1. Euler Finance
Euler has grown to over $1B in total value locked (TVL) and is rolling out a key innovation: EulerSwap. This module lets protocols provide liquidity for both swaps and borrowing in a single pool.
Key features:

  • Dual-purpose liquidity (swap + lending)
  • “Just-in-time” borrowing mechanisms
  • Smart contract automation for optimized usage

2. Morpho
Morpho is another high-growth player. With support from Coinbase and over $4B in TVL, it's becoming a serious challenger to AAVE. Its permissionless lending architecture and novel liquidity provisioning model stand out.

3. Hyperliquid
While not a lender per se, Hyperliquid’s approach to perpetuals (perps) trading is noteworthy. It has captured 11% of Binance’s perp market share, signaling DeFi’s growing ability to challenge centralized platforms.

Why Permissionless Lending Matters

The benefits of removing centralized control over lending markets include:

  • Faster innovation and product launches
  • Greater financial inclusion for emerging projects
  • Risk-based pricing by the market, not centralized governance
  • Enhanced decentralization and resilience

However, challenges remain. The risk of undercollateralized positions and protocol exploits still exist. That’s why security—such as smart contract audits and on-chain firewalls—is critical.

The Role of Token Metrics in Tracking DeFi 3.0

During the webinar, the Token Metrics team highlighted how their platform tracks the performance of DeFi 3.0 projects using metrics like:

  • TVL growth rate
  • Trader grade and investor grade
  • Bullish or bearish signals based on 80+ data points

For example, Euler’s bullish signal flipped just before a 30% price rise, demonstrating the value of data-driven insight in volatile markets.

What's Next for DeFi?

As the cycle evolves, we expect:

  • A proliferation of permissionless lending protocols across L1s and L2s
  • Better capital efficiency tools
  • Greater interoperability across EVM chains and Solana
  • On-chain integrations with tokenized real-world assets

Final Thoughts

DeFi 3.0 is not just hype—it represents a fundamental shift in how decentralized finance operates. Permissionless lending, composable liquidity, and institutional-grade risk controls are turning DeFi into a more mature, scalable ecosystem.

As always, perform your own due diligence and keep an eye on platform fundamentals, smart contract risk, and ecosystem adoption.

Research

Top 5 AI Tokens in 2025: Revolutionizing Crypto with Artificial Intelligence

Token Metrics Team
8 min

Artificial intelligence has transformed every corner of the crypto industry—from trading and analytics to sentiment tracking and smart contract automation. In 2025, AI-powered crypto platforms have surged in popularity, delivering real-time insights, automation, and efficiency that were previously unimaginable.

In this article, we highlight the top 5 AI tokens in 2025: Token Metrics ($TMAI), Kaito AI ($KAITO), Cookie.fun ($COOKIE), Arkham Intelligence ($ARKM), and ChainGPT ($CGPT)—and show why Token Metrics stands out as the gold standard.

1. Token Metrics ($TMAI): The Smartest AI Trading Platform in Crypto

Token Metrics is leading the AI revolution in crypto investing. Known for its AI-powered analytics, signals, and portfolio tools, the platform is a go-to resource for retail and institutional traders alike.

Key Features:

  • AI Buy/Sell Signals: Trained on historical price, sentiment, and on-chain data, Token Metrics generates bullish and bearish calls across thousands of crypto assets.
  • Trader & Investor Grades: Each token receives real-time AI-based scores (0–100), offering a clear snapshot of short-term momentum and long-term strength.
  • AI Chatbot: A conversational interface that lets users ask natural-language queries about market trends, token grades, and price forecasts.
  • Trading Bot: Users can automate execution based on Token Metrics’ signals, either on centralized exchanges or via self-custody strategies.
  • MCP Server Integration: Connects with ChatGPT, Claude, Cursor IDE, and more—enabling developers and analysts to pull Token Metrics data across multiple tools.

$TMAI Token Utility:

  • Unlock premium analytics and signal tiers
  • Staking rewards and fee discounts
  • Governance and roadmap input
  • Developer API access and automation credits

Why $TMAI Is the Best AI Crypto Token:

Unlike other platforms focused on niche utilities, Token Metrics delivers a full-stack AI solution. Its analytics engine is transparent, quantifiable, and tested—used by hedge funds, crypto pros, and AI researchers. The $TMAI token ties everything together with utility, access, and community incentives. In a market full of hype, Token Metrics offers data-driven, AI-validated decisions—a must-have edge for serious traders.

2. Kaito AI ($KAITO): Web3’s Information Aggregator

Kaito AI is a specialized platform tackling one of crypto’s biggest problems: information overload. It uses a custom Large Language Model (LLM) to aggregate and analyze content from X (Twitter), news sites, blogs, and community forums.

Core Features:

  • Mindshare Tracking: Monitors which tokens dominate conversation and sentiment across platforms
  • Sentiment Analysis: Real-time mood scores derived from influencers, headlines, and user engagement
  • Yaps Program: Users earn points for sharing useful content, which may convert into $KAITO tokens

$KAITO Token Utility:

  • Platform access and insights
  • Governance voting
  • Community curation rewards

Strengths:

  • Early identification of narrative shifts
  • Deep focus on information flow and crowd psychology

Limitations:

While Kaito is excellent at detecting narrative momentum, it lacks predictive analytics or execution tools, making it more of a research layer than an active trading solution. Still, it’s an important piece for sentiment-aware investors.

3. Cookie.fun ($COOKIE): Gamified Trading Meets AI

Cookie.fun is a Gen-Z-targeted platform that fuses AI-powered trading insights with gamified investing experiences.

Notable Features:

  • Telegram AI Assistant: Provides user-specific trading signals and alerts
  • Gamified Leaderboards: Trade to climb ranks and win $COOKIE tokens
  • Social Trading Features: Users can mimic top traders or form groups to pool strategies

$COOKIE Token Utility:

  • In-app rewards and incentives
  • Staking for power-ups
  • Marketplace for NFT avatars and in-game tools

Who It’s For:

Cookie.fun’s lighthearted UX and AI-enhanced suggestions appeal to newer, casual investors. It doesn’t match Token Metrics’ analytical depth but makes crypto accessible and fun—an important factor for onboarding the next wave of retail users.

4. Arkham Intelligence ($ARKM): AI for On-Chain Forensics

Arkham Intelligence offers one of the most advanced AI-powered blockchain intelligence platforms, designed to uncover hidden relationships and wallet identities.

Core Capabilities:

  • ULTRA AI Engine: Links pseudonymous wallets to real-world identities
  • Intel Exchange: A decentralized data marketplace for buying/selling wallet intelligence
  • Dashboards & Alerts: Monitor whale wallets, smart money flows, and suspicious activity

$ARKM Token Utility:

  • Access to the Intel Exchange
  • Bounty rewards
  • Platform governance

Ideal Use Cases:

  • Whales tracking and forensic analysis
  • Scam detection and compliance reporting
  • Portfolio flow transparency

Trade-Offs:

Arkham is laser-focused on on-chain visibility, not market timing or trade execution. For users who want to know who’s moving money—and why—Arkham is unmatched. But it doesn’t replace a complete AI trading platform like Token Metrics.

5. ChainGPT ($CGPT): AI Tools for Smart Contract Automation

ChainGPT offers a suite of AI-powered tools for developers, traders, and researchers in the crypto space.

Highlight Features:

  • AI Chat Assistant: Similar to ChatGPT but trained on blockchain topics
  • Smart Contract Generator: Auto-generates and audits Solidity code
  • Trading Assistant: Analyzes charts and on-chain data to produce trade suggestions
  • News Aggregator: AI-summarized crypto headlines

$CGPT Token Utility:

  • Access to tools and premium models
  • Developer credits
  • Ecosystem governance

Audience:

ChainGPT is ideal for technical users, developers, and power traders looking for coding help, risk management support, and project analysis. While useful, its trading tools aren’t as focused or optimized for performance as Token Metrics’ core offerings.

Why Token Metrics Dominates the AI Crypto Landscape

Token Metrics combines AI-grade analytics, execution, automation, and alerts, all under one unified system. It supports custom index building, signals, dashboards, rebalancing agents, and integrations with every major AI tool in the developer ecosystem.

🏁 Final Thoughts

The AI crypto boom is well underway in 2025. Each of the platforms covered—Kaito AI, Cookie.fun, Arkham, ChainGPT—offers specialized tools and insights. But for investors and traders seeking a complete, AI-first trading stack, Token Metrics ($TMAI) is the undisputed leader.

Whether you're a seasoned investor or a crypto newcomer, $TMAI gives you the intelligence, precision, and automation needed to thrive in today’s volatile markets.

Thank you! Your submission has been received!
Oops! Something went wrong while submitting the form.

Featured Posts

Crypto Basics Blog

Research Blogs

Announcement Blogs

Unlock the Secrets of Cryptocurrency

Sign Up for the Newsletter for the Exclusive Updates