


.png)


.png)
.png)


.png)


.png)
%201%20(1).png)

.png)


.png)


.png)
.png)


.png)


.png)

.png)
.png)
.png)
.png)
.png)
.png)
.png)
.png)
.png)


.png)


.png)

.png)
.png)


.png)


.png)
.png)
.png)
.png)

.png)
.png)


Research
Top Crypto Trading Platforms in 2025
When it comes to crypto trading platforms, Token Metrics is not an exchange, but a crypto analytics and crypto trading intelligence platform powered by AI.
Token Metrics Team
10


%201.svg)
%201.svg)
Big news: We’re cranking up the heat on AI-driven crypto analytics with the launch of the Token Metrics API and our official SDK (Software Development Kit). This isn’t just an upgrade – it's a quantum leap, giving traders, hedge funds, developers, and institutions direct access to cutting-edge market intelligence, trading signals, and predictive analytics.
Crypto markets move fast, and having real-time, AI-powered insights can be the difference between catching the next big trend or getting left behind. Until now, traders and quants have been wrestling with scattered data, delayed reporting, and a lack of truly predictive analytics. Not anymore.
The Token Metrics API delivers 32+ high-performance endpoints packed with powerful AI-driven insights right into your lap, including:
Getting started with the Token Metrics API is simple:
At Token Metrics, we believe data should be decentralized, predictive, and actionable.
The Token Metrics API & SDK bring next-gen AI-powered crypto intelligence to anyone looking to trade smarter, build better, and stay ahead of the curve. With our official SDK, developers can plug these insights into their own trading bots, dashboards, and research tools – no need to reinvent the wheel.
Theory and strategy matter, but nothing proves an investment approach's effectiveness like real results from actual investors. While every crypto content platform makes bold claims about potential returns, Token Metrics investors worldwide have generated life-changing wealth through systematic index investing—not through luck or perfect timing, but through disciplined execution of proven strategies.
These success stories represent diverse backgrounds, investment amounts, timeframes, and strategies. Some investors started with thousands, others with hundreds. Some invested aggressively, others conservatively. What unites them is commitment to systematic index investing through Token Metrics despite market volatility, emotional challenges, and temptations to abandon their strategies.
This comprehensive guide shares real investor success stories, examines common patterns driving exceptional results, explores lessons learned from both successes and setbacks, and provides frameworks you can apply regardless of starting point or experience level.
Background: Jennifer, 34, worked as a marketing director earning $120,000 annually. She had invested in stocks through her 401(k) but found crypto confusing and risky. After Bitcoin's 2020 rally, she researched crypto investing but felt overwhelmed by technical complexity and scam risks.
Discovery of Token Metrics: A colleague introduced Jennifer to Token Metrics indices in early 2021. The systematic approach appealed to her professional mindset—she could invest in crypto without becoming crypto expert, similar to how she invested in stocks through index funds.
Strategy Implementation:
Results: By early 2025, Jennifer's portfolio exceeded $1.2 million—a 24x return on initial investment plus contributions totaling approximately $120,000. Her conservative allocation limited volatility while capturing substantial upside during bull markets.
Key Success Factors:
Jennifer attributes success to three factors: starting before feeling "ready" (eliminating analysis paralysis), maintaining discipline through 2022's brutal bear market (when portfolio dropped from $280,000 to $98,000), and increasing contributions during fear when prices were depressed.
Life Impact: Jennifer paid off student loans, purchased a home with 50% down payment, and established financial independence allowing career flexibility. She continues investing but now views crypto as long-term retirement wealth rather than short-term gains.
Background: Marcus, 27, graduated college with $45,000 student debt and $3,000 savings. Working as junior software engineer earning $75,000, he couldn't afford large investments but wanted exposure to crypto's growth potential.
Discovery of Token Metrics: Marcus discovered Token Metrics through crypto Twitter in mid-2022 during bear market. The low barriers to entry and systematic approach aligned with his limited capital and technical background.
Strategy Implementation:
Results: Within three years, Marcus's portfolio reached $127,000—far exceeding expectations. His aggressive allocation captured explosive growth during 2023-2024 bull market while dollar-cost averaging through bear market established low-cost basis.
Key Success Factors:
Marcus credits consistency over capital. Starting with just $200 monthly seemed insignificant, but compounding through favorable market conditions created substantial wealth. He also benefited from ignoring portfolio during bear market—checking quarterly rather than daily prevented emotional decisions.
Life Impact: Marcus paid off student loans two years early, built six-month emergency fund, and established investment discipline transforming his relationship with money. He now views himself as serious investor rather than just starting out.
Background: David, 52, had built $800,000 portfolio through traditional stock investing over 25 years. Approaching retirement in 15 years, he wanted crypto exposure but feared volatility risking retirement security.
Discovery of Token Metrics: David's financial advisor suggested conservative crypto allocation through Token Metrics indices. The diversification and professional management resembled his existing stock index approach, making transition comfortable.
Strategy Implementation:
Results: After three years, David's crypto allocation reached $180,000 (still only 12% of now $1.5M total portfolio). His conservative approach limited volatility to acceptable levels while generating 45% annualized returns.
Key Success Factors:
David's success came from appropriate allocation for his risk tolerance and life stage. He never allocated amounts creating anxiety or sleepless nights. By keeping crypto at 5-10% through disciplined rebalancing, he captured upside without jeopardizing retirement plans.
Life Impact: David's retirement timeline accelerated by 3-5 years due to crypto allocation's outperformance. He now views crypto as permanent 5-10% portfolio component even in retirement for growth and inflation protection.
Background: Sarah, 29, spent two years day trading crypto individually, turning initial $50,000 into $250,000 during 2021 bull run. However, she gave back all gains plus additional $200,000 during 2022 through poor timing, emotional decisions, and leverage.
Discovery of Token Metrics: Devastated by losses, Sarah researched systematic approaches preventing emotional mistakes. Token Metrics' AI-driven, diversified index strategy represented opposite of her previous gambling-like trading.
Strategy Implementation:
Results: Within four years, Sarah's portfolio exceeded $500,000 through consistent contributions, favorable market timing (starting in bear market), and eliminating costly emotional trading. Her systematic approach generated 68% annualized returns.
Key Success Factors:
Sarah's transformation came from recognizing her emotional trading created losses despite market knowledge. Systematic index investing removed emotion from process. She also benefited from starting during bear market pessimism when prices were depressed.
Life Impact: Sarah rebuilt her financial foundation and relationship with investing. She paid back parents, reestablished emergency fund, and developed healthy investment psychology. Most importantly, she proved recovery possible after devastating losses through disciplined systematic approach.
Background: Carlos, 38, lived in Brazil earning modest income by Western standards but comfortable locally. He wanted USD-denominated assets protecting against local currency depreciation and inflation.
Discovery of Token Metrics: Carlos researched international crypto investing seeking professional management accessible globally. Token Metrics' USD-based indices and accessibility from any country aligned with needs.
Strategy Implementation:
Results: Over five years, Carlos's portfolio grew to $385,000 USD. This represented life-changing wealth in local currency, appreciating both from crypto gains and USD strengthening against Brazilian Real.
Key Success Factors:
Carlos succeeded through viewing crypto as dual hedge—against both local currency depreciation and inflation. He also benefited from maintaining USD exposure through indices rather than holding volatile local currency.
Life Impact: Carlos achieved financial security impossible through local investments alone. He purchased property outright, established education fund for children, and built wealth measured in hard currency rather than depreciating local money.
Analyzing success stories reveals consistent patterns:
These success stories aren't luck—they're replicable through systematic implementation:
Step 1: Establish Clear Financial Foundation
Step 2: Determine Appropriate Allocation
Step 3: Select Index Strategy Matching Goals
Step 4: Automate Systematic Contributions
Step 5: Maintain Discipline Through Cycles
Step 6: Optimize Tax Efficiency
Skeptics question whether success stories are genuine or cherry-picked. Valid concerns:
Key insight: these results weren't easy, but they were achievable for ordinary investors following systematic strategies through complete market cycles.
Every investor profiled here started from different circumstances with varying capital, experience, and goals. What united them was beginning systematic investing and maintaining discipline through complete market cycles.
Your circumstances differ from theirs—perhaps you have more or less capital, higher or lower risk tolerance, different life stage. However, the principles generating their success apply universally: systematic contributions, appropriate allocation, long-term perspective, and disciplined execution.
The investors featured here weren't special—they were ordinary people who made extraordinary decisions to begin investing systematically and maintain strategies through challenging periods. You can replicate their success through similar commitment.
Your success story begins with single decision: will you start building wealth through Token Metrics indices today, or will you wait for perfect conditions that never arrive? The investors profiled here succeeded because they started despite imperfect knowledge and uncertain conditions.
Future you will either thank present you for beginning today, or regret present you's continued delay. Which legacy will you create?
Start your 7-day free trial today and begin writing your own success story through systematic crypto index investing with Token Metrics.
Question: Are these success stories real, or are they cherry-picked/made up by Token Metrics?
Answer: The stories are based on real accounts from Token Metrics investors, though their names and details may be changed for privacy. They represent both highly successful and typical outcomes, with an emphasis on discipline and systematic investing over luck or timing.
Question: Can I expect the same results if I use Token Metrics indices?
Answer: Past performance does not guarantee future results. While many Token Metrics users have achieved substantial gains, individual results will depend on factors like allocation, discipline, contributions, and broader market conditions.
Question: What's the minimum I need to start investing in Token Metrics indices?
Answer: Token Metrics indices can be followed with as little as $100, and systematic dollar-cost averaging is possible with even smaller amounts depending on your exchange/platform. Larger initial investments may accelerate compounding.
Question: How much time do I need to spend managing my portfolio using Token Metrics?
Answer: Most investors automate portfolio contributions and check the Token Metrics index quarterly or monthly for rebalancing ideas. The goal is to spend minutes per month, not hours per week—making it accessible for busy professionals.
Question: Can Token Metrics indices work for international investors?
Answer: Yes. Many Token Metrics index users are outside the U.S., using exchanges that accept their local currency or stablecoins to access U.S. dollar-denominated crypto indices. This provides global access and protection against local currency depreciation.
Generating impressive returns through Token Metrics crypto indices represents only half the wealth-building equation. The other half—often overlooked by investors focused solely on performance—involves minimizing taxes that can consume 30-50% of your gains. Every dollar paid unnecessarily in taxes is a dollar that can't compound into future wealth.
Cryptocurrency taxation presents unique complexities that differ significantly from traditional investments. However, these complexities also create optimization opportunities unavailable with stocks or bonds. Understanding and implementing sophisticated tax strategies can add 2-5 percentage points to your effective annual returns—enough to transform good investment outcomes into exceptional ones over decades.
This comprehensive guide explores tax optimization for crypto index investors, examining current tax treatment, strategies for minimizing tax liability, retirement account advantages, loss harvesting techniques, and long-term tax planning that maximizes after-tax wealth accumulation.
Before implementing optimization strategies, understand how crypto indices are taxed.
The single most powerful tax optimization strategy involves using retirement accounts for crypto index investing when possible.
Roth IRAs offer unmatched tax advantages for crypto indices:
Strategy: Maximize Roth IRA contributions annually ($7,000 for 2024, or $8,000 if age 50+) allocating these funds to crypto indices. If crypto appreciates 40% annually for 30 years, that initial $7,000 grows to over $10 million completely tax-free.
Traditional IRAs offer different but still valuable benefits:
Strategy: If current tax bracket is high, contribute to traditional IRA for immediate deduction. Later, convert to Roth IRA during years with lower income (perhaps early retirement before Social Security begins), paying taxes at reduced rates.
Standard IRA custodians often don't support cryptocurrency. Self-directed IRA custodians like Alto, iTrustCapital, or BitcoinIRA specifically facilitate crypto holdings within retirement accounts.
These specialized custodians charge higher fees than traditional brokers but the tax benefits far exceed fee costs. Research custodians thoroughly, understanding fee structures, supported cryptocurrencies, and withdrawal processes before opening accounts.
Some employers now offer cryptocurrency options in 401(k) plans. If available, consider allocating portions of 401(k) contributions to crypto indices, capturing tax advantages while maintaining employer matching benefits.
If employer plans don't support crypto, maximize employer match in 401(k), then open self-directed IRA for crypto allocation. This ensures you capture free employer money while still achieving desired crypto exposure in tax-advantaged accounts.
Crypto volatility creates frequent opportunities for tax-loss harvesting—deliberately selling positions at losses to offset gains elsewhere in your portfolio.
When you sell investments at losses, those losses offset capital gains dollar-for-dollar. If losses exceed gains, you can deduct up to $3,000 annually against ordinary income, carrying forward excess losses to future years indefinitely.
Example: Your index appreciates $50,000 during the year (creating potential $50,000 gain when sold). Another index declined $20,000. By selling the losing position, you harvest $20,000 in losses reducing your taxable gain to $30,000 and saving $4,000-7,400 in taxes depending on your bracket.
Stock investors face "wash sale rules" preventing them from selling securities at losses and repurchasing identical or substantially identical securities within 30 days. This rule prevents gaming the system through artificial loss harvesting.
Currently, cryptocurrency is not subject to wash sale rules. You can sell Bitcoin at a loss and immediately repurchase it, maintaining market exposure while harvesting tax losses. This provides enormous optimization opportunities unavailable with traditional securities.
Note: Proposed legislation may extend wash sale rules to crypto in the future. Consult tax professionals about current regulations when implementing strategies.
Bear markets present exceptional loss harvesting opportunities. As indices decline 50-70%, systematically harvest losses while maintaining exposure through immediate repurchases or similar but not identical indices.
Strategy: During significant market declines, harvest losses in aggressive growth indices while simultaneously purchasing conservative indices. This maintains crypto exposure while capturing substantial tax losses. Reverse the process during recovery, moving back to aggressive indices.
Review portfolio in November-December identifying loss harvesting opportunities before year-end. Tax losses must be realized by December 31st to count for current tax year.
However, don't let tax tail wag investment dog—never sell positions solely for tax purposes if doing so undermines long-term strategy. Harvest losses strategically within context of overall investment plan.
Accurate cost basis tracking enables optimizing which specific shares you sell, minimizing taxes on each transaction.
Donating appreciated crypto to qualified charities creates powerful tax advantages.
Donating appreciated crypto held over one year to 501(c)(3) charities provides:
Strategy: If planning charitable giving, donate appreciated crypto instead of cash. This optimization is especially powerful during high-income years where deductions provide maximum value.
Donor-advised funds (DAFs) through Fidelity Charitable, Schwab Charitable, or specialized crypto DAF providers accept cryptocurrency donations, providing immediate tax deductions while allowing you to recommend grants to charities over time.
Strategy: During exceptionally profitable years, donate substantial appreciated crypto to DAF, capturing large tax deduction. Then distribute to charities gradually over subsequent years based on your philanthropic priorities.
While this doesn't apply to crypto directly, investors over age 70½ can make qualified charitable distributions from IRAs up to $100,000 annually. These distributions satisfy required minimum distributions while excluding amounts from taxable income.
Strategy: Use QCDs for charitable giving from traditional IRAs while preserving appreciated crypto in Roth IRAs for tax-free growth.
Controlling when you recognize taxable income significantly impacts lifetime tax burden.
Tax rates vary year-to-year based on income. Strategic timing of crypto sales can minimize rates paid:
Strategy: If taking year off or experiencing income decline, sell appreciated crypto indices locking in gains at 0-15% rates. Then immediately repurchase, establishing higher cost basis for future sales.
Converting traditional IRA crypto holdings to Roth IRAs triggers taxable income. However, strategic timing minimizes tax costs:
Strategy: During crypto bear markets, convert traditional IRA crypto holdings to Roth when values are temporarily depressed. Pay taxes on depressed values, then enjoy full recovery tax-free inside Roth.
State taxes significantly impact after-tax returns. No-income-tax states (Alaska, Florida, Nevada, South Dakota, Tennessee, Texas, Washington, Wyoming) tax only at federal level. High-tax states like California (13.3%), New York (10.9%), and New Jersey (10.75%) add substantial state taxes on crypto gains.
Strategic Relocation: High earners sometimes relocate to no-tax states before realizing substantial gains. Moving from California to Texas before selling $5 million in appreciated crypto saves $665,000 in state taxes. However, states scrutinize such moves—establishing legitimate domicile requires genuine ties including residence, voter registration, driver's license, and spending majority of year in new state. Consult tax attorneys about timing and requirements.
Crypto tax complexity exceeds most investors' expertise. Professional guidance prevents costly mistakes and identifies optimization opportunities you'd otherwise miss.
Consider specialized crypto tax professionals if you:
Generic accountants often lack crypto expertise. Seek specialists with demonstrated cryptocurrency tax experience through credentials like the Certified Public Accountant (CPA) designation plus crypto-specific training.
Professional crypto tax planning costs $500-5,000+ annually depending on complexity. However, identifying even single optimization opportunity often saves multiples of professional fees.
Example: CPA costs $2,000 annually but identifies loss harvesting opportunity saving $8,000 in taxes, Roth conversion strategy saving $15,000 over five years, and charitable giving optimization saving $5,000. Total value: $28,000 for $2,000 investment.
Tax optimization isn't about gaming the system or taking questionable positions—it's about structuring investments to legally minimize taxes within established rules. The difference between paying 37% short-term capital gains rates versus 0-15% long-term rates, or paying no taxes via Roth IRAs, compounds into hundreds of thousands or millions over decades.
Token Metrics indices provide world-class investment performance, but keeping more of those returns through strategic tax planning determines your actual wealth accumulation. A 45% annual return becomes 28% after-tax at high ordinary income rates—but remains 45% tax-free in Roth IRA.
Begin implementing tax optimization strategies today. Maximize tax-advantaged account contributions, implement systematic loss harvesting, track cost basis meticulously, time income recognition strategically, and work with qualified professionals for complex situations.
Your future self will appreciate the six-figure or seven-figure tax savings generated through disciplined tax optimization as much as the strong investment returns from Token Metrics indices. Combined, they create unstoppable wealth accumulation.
Start your 7-day free trial today and begin building tax-efficient crypto wealth through Token Metrics indices combined with strategic tax optimization.
The Layer 1 competitive landscape is consolidating as markets recognize that specialization matters more than being a generic alternative to Ethereum. Avalanche positions itself in this multi-chain world with specific technical and ecosystem advantages. Infrastructure maturity around custody, bridges, and developer tooling makes alternative L1s more accessible heading into 2026.
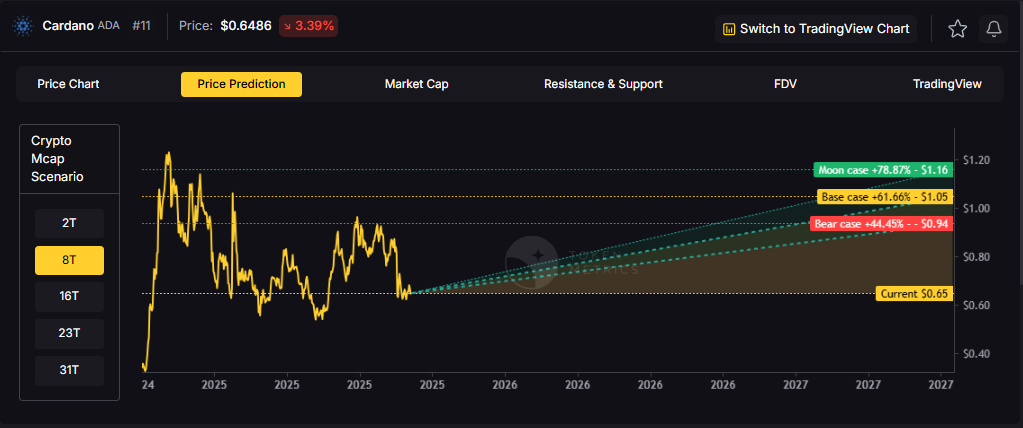
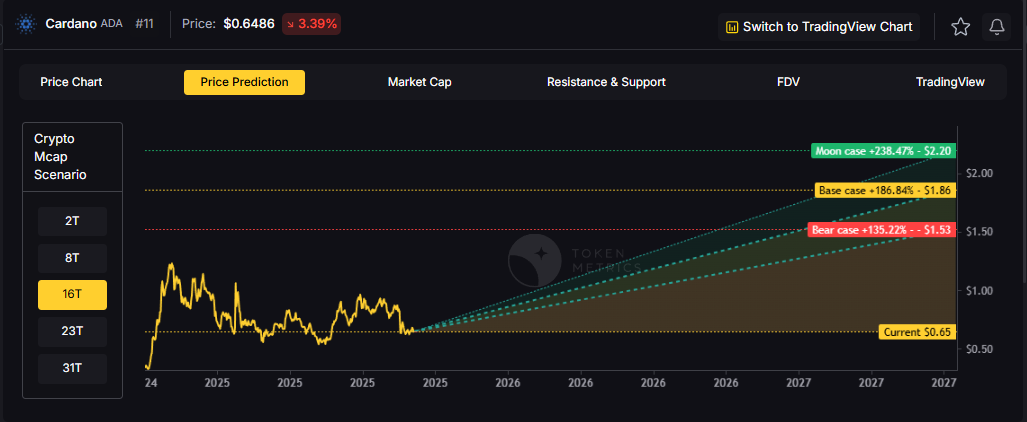
The scenario projections below map different market share outcomes for AVAX across varying total crypto market sizes. Base cases assume Avalanche maintains current ecosystem momentum, while moon scenarios factor in accelerated adoption, and bear cases reflect increased competitive pressure.

Disclosure
Educational purposes only, not financial advice. Crypto is volatile, do your own research and manage risk.
How to read it: Each band blends cycle analogues and market-cap share math with TA guardrails. Base assumes steady adoption and neutral or positive macro. Moon layers in a liquidity boom. Bear assumes muted flows and tighter liquidity.
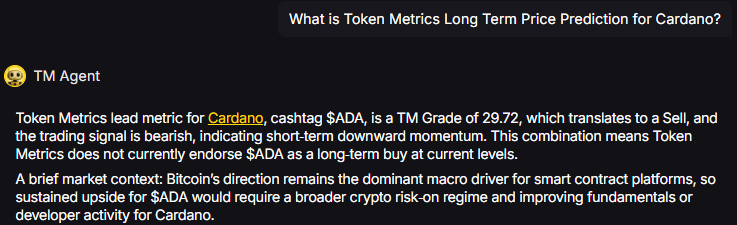
TM Agent baseline: Token Metrics lead metric for Avalanche, cashtag $AVAX, is a TM Grade of 66.2%, which maps to Hold, and the trading signal is bearish, indicating short-term downward momentum. Concise long-term numeric view, 12-month horizon: Token Metrics’ scenarios center around a price band roughly between $15 and $40, with a base case near $25. Market context: Bitcoin’s direction remains the primary market driver, so broader crypto risk-on conditions are required for $AVAX to reach the higher scenario.
Live details: Avalanche Token Details
Affiliate Disclosure: We may earn a commission from qualifying purchases made via this link, at no extra cost to you.
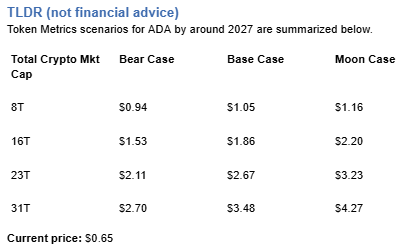
Token Metrics scenarios span four market cap tiers, each representing different levels of crypto market maturity and liquidity:
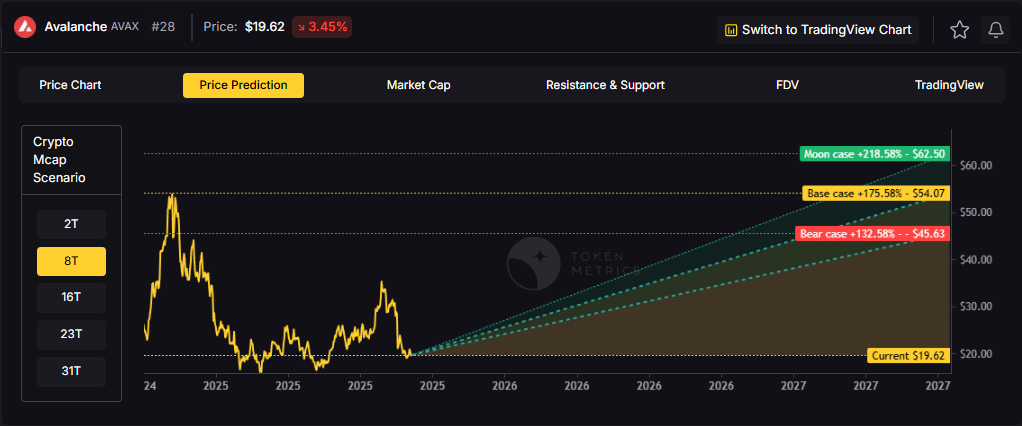
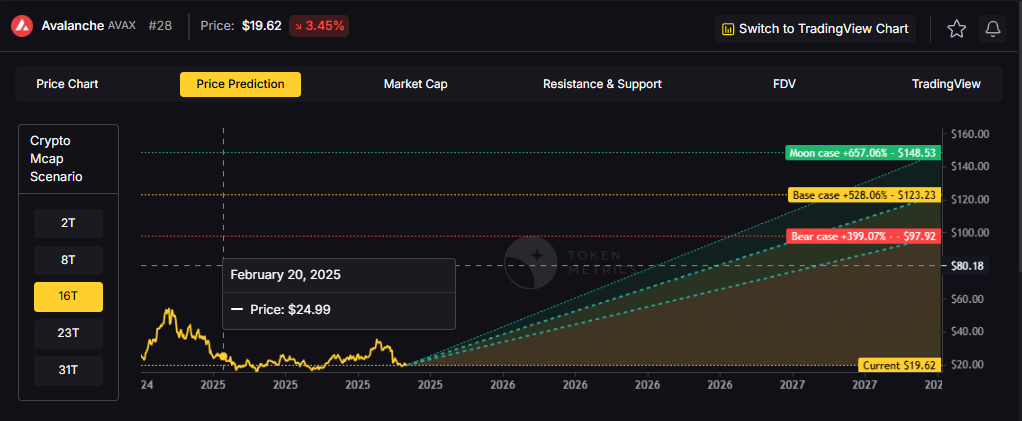

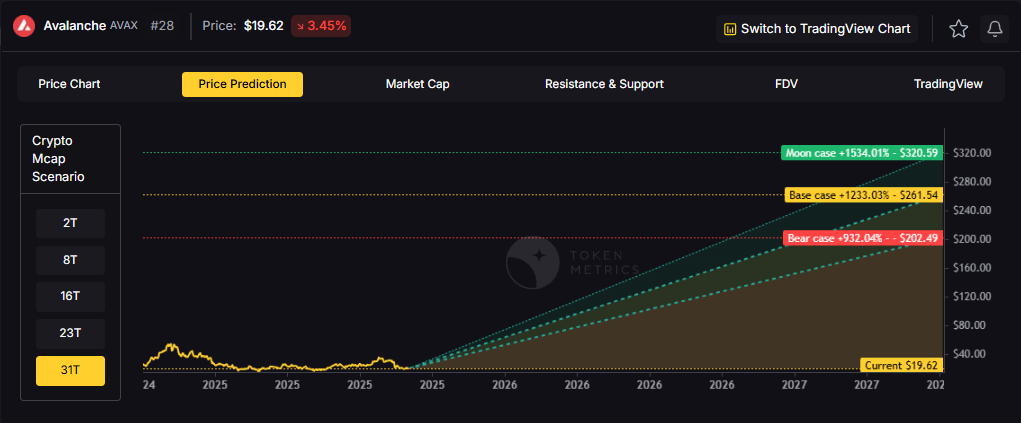
Each tier assumes progressively stronger market conditions, with the base case reflecting steady growth and the moon case requiring sustained bull market dynamics.
Avalanche represents one opportunity among hundreds in crypto markets. Token Metrics Indices bundle AVAX with top one hundred assets for systematic exposure to the strongest projects. Single tokens face idiosyncratic risks that diversified baskets mitigate.
Historical index performance demonstrates the value of systematic diversification versus concentrated positions.
What Is Avalanche?
Avalanche is a smart-contract platform known for high throughput, low latency, and a modular subnet architecture. It aims to support decentralized finance, gaming, and enterprise applications with fast finality and cost-efficient transactions.
AVAX is the native token used for fees, staking, and network security, and it powers activity across application subnets. The ecosystem positions Avalanche among leading Layer 1s competing for developer mindshare and user adoption.
Token Metrics AI provides comprehensive context on Avalanche's positioning and challenges.
Vision: Avalanche aims to provide a highly scalable, secure, and decentralized platform for launching custom blockchains and decentralized applications. Its vision centers on enabling a global, open financial system and supporting a diverse ecosystem of interoperable blockchains.
Problem: Many blockchain networks face trade-offs between speed, security, and decentralization, often resulting in high fees and slow transaction times during peak demand. Avalanche addresses the need for a scalable and efficient infrastructure that can support widespread adoption of dApps and enterprise use cases without compromising on performance or security.
Solution: Avalanche uses a novel consensus mechanism that achieves rapid finality with low energy consumption, differentiating it from traditional Proof-of-Work systems. It employs a three-chain architecture—Exchange Chain (X-Chain), Platform Chain (P-Chain), and Contract Chain (C-Chain)—to separate functions like asset creation, staking, and smart contract execution, enhancing efficiency and scalability.
Market Analysis: Avalanche operates in the competitive Layer 1 blockchain space. It differentiates itself through its consensus protocol and support for subnet-based custom blockchains. Adoption is influenced by developer activity, partnerships, and integration with major DeFi protocols, with risks from technological shifts and regulatory developments.
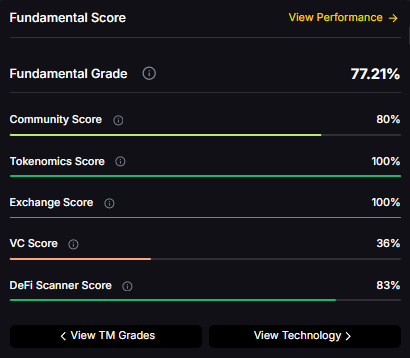
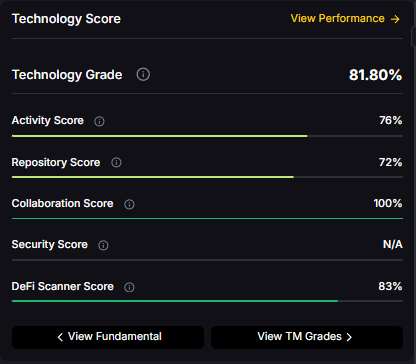
Fundamental Grade: 91.63% (Community 82%, Tokenomics 100%, Exchange 100%, VC 97%, DeFi Scanner 83%).
Technology Grade: 80.52% (Activity 80%, Repository 72%, Collaboration 93%, Security 59%, DeFi Scanner 83%).
Can AVAX reach $200?
Answer: Based on the scenarios, AVAX could reach $200 in the 31T bear case at $202.49. The 31T tier also shows $261.54 in the base case and $320.59 in the moon case. Not financial advice.
Can AVAX 10x from current levels?
Answer: At a current price of $19.62, a 10x would reach $196.20. This falls within the 31T bear, base, and moon cases, and the 23T moon case at $234.56. Bear in mind that 10x returns require substantial market cap expansion. Not financial advice.
Should I buy AVAX now or wait?
Answer: Timing depends on your risk tolerance and macro outlook. Current price of $19.62 sits below the 8T bear case at $45.63. Dollar-cost averaging may reduce timing risk. Not financial advice.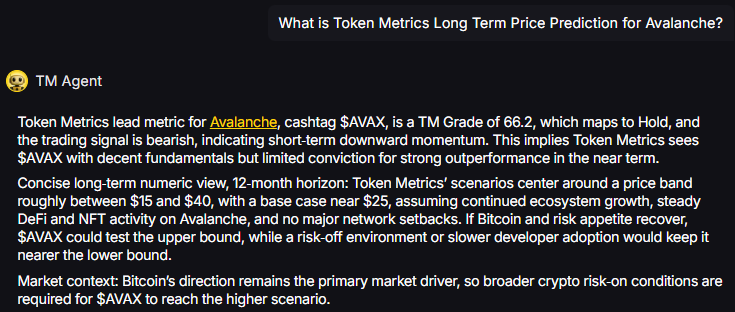
Disclosure
Educational purposes only, not financial advice. Crypto is volatile, do your own research and manage risk.
Our team delivers scenario-driven price projections, in-depth grades, and actionable indices to empower smarter crypto investing—with both human and AI insights.
.svg)


.png)
Token Metrics Media LLC is a regular publication of information, analysis, and commentary focused especially on blockchain technology and business, cryptocurrency, blockchain-based tokens, market trends, and trading strategies.
Token Metrics Media LLC does not provide individually tailored investment advice and does not take a subscriber’s or anyone’s personal circumstances into consideration when discussing investments; nor is Token Metrics Advisers LLC registered as an investment adviser or broker-dealer in any jurisdiction.
Information contained herein is not an offer or solicitation to buy, hold, or sell any security. The Token Metrics team has advised and invested in many blockchain companies. A complete list of their advisory roles and current holdings can be viewed here: https://tokenmetrics.com/disclosures.html/
Token Metrics Media LLC relies on information from various sources believed to be reliable, including clients and third parties, but cannot guarantee the accuracy and completeness of that information. Additionally, Token Metrics Media LLC does not provide tax advice, and investors are encouraged to consult with their personal tax advisors.
All investing involves risk, including the possible loss of money you invest, and past performance does not guarantee future performance. Ratings and price predictions are provided for informational and illustrative purposes, and may not reflect actual future performance.


%20Price%20Prediction%202025%2C%202030%20-%20Forecast%20Analysis.png)


.png)

%20Price%20Prediction%20.webp)


%20Price%20Prediction.webp)


%20Price%20Prediction%20Analysis%20-%20Can%20it%20Reach%20%24500%20in%20Future_.png)


