


.png)


.png)
.png)


.png)


.png)
%201%20(1).png)

.png)


.png)


.png)
.png)


.png)


.png)

.png)
.png)
.png)
.png)
.png)
.png)
.png)
.png)
.png)


.png)


.png)

.png)
.png)


.png)


.png)
.png)
.png)
.png)

.png)
.png)


Research
Top Crypto Trading Platforms in 2025
When it comes to crypto trading platforms, Token Metrics is not an exchange, but a crypto analytics and crypto trading intelligence platform powered by AI.
Token Metrics Team
10


%201.svg)
%201.svg)
Big news: We’re cranking up the heat on AI-driven crypto analytics with the launch of the Token Metrics API and our official SDK (Software Development Kit). This isn’t just an upgrade – it's a quantum leap, giving traders, hedge funds, developers, and institutions direct access to cutting-edge market intelligence, trading signals, and predictive analytics.
Crypto markets move fast, and having real-time, AI-powered insights can be the difference between catching the next big trend or getting left behind. Until now, traders and quants have been wrestling with scattered data, delayed reporting, and a lack of truly predictive analytics. Not anymore.
The Token Metrics API delivers 32+ high-performance endpoints packed with powerful AI-driven insights right into your lap, including:
Getting started with the Token Metrics API is simple:
At Token Metrics, we believe data should be decentralized, predictive, and actionable.
The Token Metrics API & SDK bring next-gen AI-powered crypto intelligence to anyone looking to trade smarter, build better, and stay ahead of the curve. With our official SDK, developers can plug these insights into their own trading bots, dashboards, and research tools – no need to reinvent the wheel.
Shiba Inu operates as a community-driven meme token where price action stems primarily from social sentiment, attention cycles, and speculative trading rather than fundamental value drivers. SHIB exhibits extreme volatility with no defensive characteristics or revenue-generating mechanisms typical of utility tokens. Token Metrics scenarios below provide technical Price Predictions across different market cap environments, though meme tokens correlate more strongly with viral trends and community engagement than systematic market cap models. Positions in SHIB should be sized as high-risk speculative bets with potential for total loss.

Disclosure
Educational purposes only, not financial advice. Crypto is volatile, do your own research and manage risk.
How to read it: Each band blends cycle analogues and market-cap share math with TA guardrails. Base assumes steady adoption and neutral or positive macro. Moon layers in a liquidity boom. Bear assumes muted flows and tighter liquidity. For meme tokens, actual outcomes depend heavily on social trends and community momentum beyond what market cap models capture.
TM Agent baseline: Token Metrics TM Grade is 24.1%, Sell, with a bearish trading signal. The concise 12‑month numeric view centers between
TM Agent numeric view: scenarios center roughly between $0.000005 and $0.000035, with a base case near $0.000012.
Token Metrics scenarios provide technical price bands across market cap tiers:
8T: At 8 trillion total crypto market cap, SHIB projects to $0.041998 (bear), $0.042366 (base), and $0.042734 (moon).
16T: At 16 trillion total crypto market cap, SHIB projects to $0.043973 (bear), $0.045077 (base), and $0.046182 (moon).
23T: At 23 trillion total crypto market cap, SHIB projects to $0.045948 (bear), $0.047789 (base), and $0.049629 (moon).
31T: At 31 trillion total crypto market cap, SHIB projects to $0.047923 (bear), $0.051050 (base), and $0.051307 (moon).
These technical ranges assume meme tokens maintain market cap share proportional to overall crypto growth. Actual outcomes for speculative tokens typically exhibit higher variance and stronger correlation to social trends than these models predict.
Shiba Inu is a meme-born crypto project that centers on community and speculative culture. Unlike utility tokens with specific use cases, SHIB operates primarily as a speculative asset and community symbol. The project focuses on community engagement and entertainment value.
SHIB has demonstrated viral moments and community loyalty within the broader meme token category. The token trades on community sentiment and attention cycles more than fundamentals. Market performance depends heavily on social media attention and broader meme coin cycles.
Token Metrics provides technical analysis, scenario math, and rigorous risk evaluation for hundreds of crypto tokens. Want to dig deeper? Explore our powerful AI-powered ratings and scenario tools here.
Will SHIB 10x from here?
Answer: At current price of $0.041027, a 10x reaches $0.41027. This level does not appear in any of the listed bear, base, or moon scenarios across 8T, 16T, 23T, or 31T tiers. Meme tokens can 10x rapidly during viral moments but can also lose 90%+ just as quickly. Position sizing for potential total loss is critical. Not financial advice.
What are the biggest risks to SHIB?
Answer: Primary risks include attention shifting to newer memes, community fragmentation, developer abandonment, regulatory crackdowns, and liquidity collapse during downturns. Unlike utility tokens with defensive characteristics, SHIB has zero fundamental floor. Price can approach zero if community interest disappears. Total loss is a realistic outcome. Not financial advice.
Next Steps
Disclosure
Educational purposes only, not financial advice. SHIB is a highly speculative asset with extreme volatility and high risk of total loss. Meme tokens operate as entertainment and gambling instruments rather than investments. Only allocate capital you can afford to lose entirely. Do your own research and manage risk appropriately.
Exchange tokens like WhiteBIT Coin offer leveraged exposure to overall market activity, creating concentration risk around a single platform's success. While WBT can deliver outsized returns during bull markets with high trading volumes, platform-specific risks like regulatory action, security breaches, or competitive displacement amplify downside exposure. Portfolio theory suggests balancing such concentrated bets with broader sector exposure.
The scenarios below show how WBT might perform across different crypto market cap environments. Rather than betting entirely on WhiteBIT Coin's exchange succeeding, diversified strategies blend exchange tokens with L1s, DeFi protocols, and infrastructure plays to capture crypto market growth while mitigating single-platform risk.
Portfolio theory teaches that diversification is the only free lunch in investing. WBT concentration violates this principle by tying your crypto returns to one protocol's fate. Token Metrics Indices blend WhiteBIT Coin with the top one hundred tokens, providing broad exposure to crypto's growth while smoothing volatility through cross-asset diversification. This approach captures market-wide tailwinds without overweighting any single point of failure.
Systematic rebalancing within index strategies creates an additional return source that concentrated positions lack. As some tokens outperform and others lag, regular rebalancing mechanically sells winners and buys laggards, exploiting mean reversion and volatility. Single-token holders miss this rebalancing alpha and often watch concentrated gains evaporate during corrections while index strategies preserve more gains through automated profit-taking.
Beyond returns, diversified indices improve the investor experience by reducing emotional decision-making. Concentrated WBT positions subject you to severe drawdowns that trigger panic selling at bottoms. Indices smooth the ride through natural diversification, making it easier to maintain exposure through full market cycles. Get early access: https://docs.google.com/forms/d/1AnJr8hn51ita6654sRGiiW1K6sE10F1JX-plqTUssXk/preview.

Disclosure
Educational purposes only, not financial advice. Crypto is volatile, do your own research and manage risk.
How to read it: Each band blends cycle analogues and market-cap share math with TA guardrails. Base assumes steady adoption and neutral or positive macro. Moon layers in a liquidity boom. Bear assumes muted flows and tighter liquidity.
TM Agent baseline: Token Metrics long term view for WhiteBIT Coin, cashtag $WBT. Lead metric first, Token Metrics TM Grade is 52.5%, Hold, and the trading signal is bearish, indicating short-term downward momentum. Concise 12-month numeric view: Token Metrics scenarios center roughly between $10 and $85, with a base case near $40.
Token Metrics scenarios span four market cap tiers, each representing different levels of crypto market maturity and liquidity:
8T: At an 8 trillion dollar total crypto market cap, WBT projects to $54.50 in bear conditions, $64.88 in the base case, and $75.26 in bullish scenarios.
16T: Doubling the market to 16 trillion expands the range to $78.61 (bear), $109.75 (base), and $140.89 (moon).
23T: At 23 trillion, the scenarios show $102.71, $154.61, and $206.51 respectively.
31T: In the maximum liquidity scenario of 31 trillion, WBT could reach $126.81 (bear), $199.47 (base), or $272.13 (moon).
These ranges illustrate potential outcomes for concentrated WBT positions, but investors should weigh whether single-asset exposure matches their risk tolerance or whether diversified strategies better suit their objectives.
WhiteBIT Coin is the native exchange token associated with the WhiteBIT ecosystem. It is designed to support utility on the platform and related services.
WBT typically provides fee discounts and ecosystem benefits where supported. Usage depends on exchange activity and partner integrations.
Token Metrics AI provides comprehensive context on WhiteBIT Coin's positioning and challenges.
Vision: The stated vision for WhiteBIT Coin centers on enhancing user experience within the WhiteBIT exchange ecosystem by providing tangible benefits such as reduced trading fees, access to exclusive features, and participation in platform governance or rewards programs. It aims to strengthen user loyalty and engagement by aligning token holders’ interests with the exchange’s long-term success. While not positioned as a decentralized protocol token, its vision reflects a broader trend of exchanges leveraging tokens to build sustainable, incentivized communities.
Problem: Centralized exchanges often face challenges in retaining active users and differentiating themselves in a competitive market. Users may be deterred by high trading fees, limited reward mechanisms, or lack of influence over platform developments. WhiteBIT Coin aims to address these frictions by introducing a native incentive layer that rewards participation, encourages platform loyalty, and offers cost-saving benefits. This model seeks to improve user engagement and create a more dynamic trading environment on the WhiteBIT platform.
Solution: WhiteBIT Coin serves as a utility token within the WhiteBIT exchange, offering users reduced trading fees, staking opportunities, and access to special events such as token sales or airdrops. It functions as an economic lever to incentivize platform activity and user retention. While specific governance features are not widely documented, such tokens often enable voting on platform upgrades or listing decisions. The solution relies on integrating the token deeply into the exchange’s operational model to ensure consistent demand and utility for holders.
Market Analysis: Exchange tokens like WhiteBIT Coin operate in a competitive landscape led by established players such as Binance Coin (BNB) and KuCoin Token (KCS). While BNB benefits from a vast ecosystem including a launchpad, decentralized exchange, and payment network, WBT focuses on utility within its native exchange. Adoption drivers include the exchange’s trading volume, security track record, and the attractiveness of fee discounts and staking yields. Key risks involve regulatory pressure on centralized exchanges and competition from other exchange tokens that offer similar benefits.
Fundamental Grade: 52.35% (Community 82%, Tokenomics 60%, Exchange 50%, VC —, DeFi Scanner N/A).
Can WBT reach $100?
Answer: Based on the scenarios, WBT could reach $100 in the 16T base case. The 16T tier projects $109.75 in the base case. Achieving this requires both broad market cap expansion and WhiteBIT Coin maintaining competitive position. Not financial advice.
What's the risk/reward profile for WBT?
Answer: Risk and reward span from $54.50 in the lowest bear case to $272.13 in the highest moon case. Downside risks include regulatory actions and competitive displacement, while upside drivers include expanding access and favorable macro liquidity. Concentrated positions amplify both tails, while diversified strategies smooth outcomes.
What gives WBT value?
Answer: WBT accrues value through fee discounts, staking rewards, access to special events, and potential participation in platform programs. Demand drivers include exchange activity, user growth, and security reputation. While these fundamentals matter, diversified portfolios capture value accrual across multiple tokens rather than betting on one protocol's success.
Disclosure
Educational purposes only, not financial advice. Crypto is volatile, concentration amplifies risk, and diversification is a fundamental principle of prudent portfolio construction. Do your own research and manage risk appropriately.
Layer 1 tokens capture value through transaction fees and miner economics. Litecoin processes blocks every 2.5 minutes using Proof of Work, targeting fast, low-cost payments. The scenarios below model LTC outcomes across different total crypto market sizes, reflecting network adoption and transaction volume.

Disclosure
Educational purposes only, not financial advice. Crypto is volatile, do your own research and manage risk.
How to read it: Each band blends cycle analogues and market-cap share math with TA guardrails. Base assumes steady adoption and neutral or positive macro. Moon layers in a liquidity boom. Bear assumes muted flows and tighter liquidity.
TM Agent baseline: Token Metrics scenarios center roughly between $35 and $160, with a base case near $75, assuming gradual adoption, occasional retail rotation into major alts, and no major network issues. In a broad crypto rally LTC could test the upper bound, while in risk-off conditions it would likely drift toward the lower bound.
Token Metrics scenarios span four market cap tiers reflecting different crypto market maturity levels:
8T: At an 8 trillion dollar total crypto market cap, LTC projects to $115.80 in bear conditions, $137.79 in the base case, and $159.79 in bullish scenarios.
16T: At 16 trillion, the range expands to $154.54 (bear), $220.52 (base), and $286.50 (moon).
23T: The 23 trillion tier shows $193.28, $303.25, and $413.21 respectively.
31T: In the maximum liquidity scenario at 31 trillion, LTC reaches $232.03 (bear), $385.98 (base), or $539.92 (moon).
Litecoin is a peer-to-peer cryptocurrency launched in 2011 as an early Bitcoin fork. It uses Proof of Work with Scrypt and targets faster settlement, processing blocks roughly every 2.5 minutes with low fees.
LTC is the native token used for transaction fees and miner rewards. Its primary utilities are fast, low-cost payments and serving as a testing ground for Bitcoin-adjacent upgrades, with adoption in retail payments, remittances, and exchange trading pairs.
Token Metrics AI provides additional context on Litecoin's technical positioning and market dynamics.
Vision: Litecoin's vision is to serve as a fast, low-cost, and accessible digital currency for everyday transactions. It aims to complement Bitcoin by offering quicker settlement times and a more efficient payment system for smaller, frequent transfers.
Problem: Bitcoin's relatively slow block times and rising transaction fees during peak usage make it less ideal for small, frequent payments. This creates a need for a cryptocurrency that maintains security and decentralization while enabling faster and cheaper transactions suitable for daily use.
Solution: Litecoin addresses this by using a 2.5-minute block time and the Scrypt algorithm, which initially allowed broader participation in mining and faster transaction processing. It functions primarily as a payment-focused blockchain, supporting peer-to-peer transfers with low fees and high reliability, without the complexity of smart contract functionality.
Market Analysis: Litecoin operates in the digital payments segment of the cryptocurrency market, often compared to Bitcoin but positioned as a more efficient medium of exchange. While it lacks the smart contract capabilities of platforms like Ethereum or Solana, its simplicity, long-standing network security, and brand recognition give it a stable niche. It competes indirectly with other payment-focused cryptocurrencies like Bitcoin Cash and Dogecoin. Adoption is sustained by its integration across major exchanges and payment services, but growth is limited by the broader shift toward ecosystems offering decentralized applications.
Fundamental Grade: 83.98% (Community 79%, Tokenomics 100%, Exchange 100%, VC —, DeFi Scanner 57%).
Technology Grade: 46.67% (Activity 51%, Repository 72%, Collaboration 60%, Security 20%, DeFi Scanner 57%).![]()
For comprehensive Litecoin ratings, on-chain analysis, AI-powered price forecasts, and trading signals, go to Token Metrics.
What is LTC used for?
Answer: Primary use cases include fast peer-to-peer payments, low-cost remittances, and exchange settlement/liquidity pairs. LTC holders primarily pay transaction fees and support miner incentives. Adoption depends on active addresses and payment integrations.
What price could LTC reach in the moon case?
Answer: Moon case projections range from $159.79 at 8T to $539.92 at 31T. These scenarios require maximum market cap expansion and strong adoption dynamics. Not financial advice.
Next Steps
• Track live grades and signals: Token Details
Disclosure
Educational purposes only, not financial advice. Crypto is volatile, do your own research and manage risk.

Exchange tokens desrive value from trading volume and platform revenue, creating linkage between crypto market activity and LEO price action. LEO Token delivers utility through reduced trading fees and enhanced platform services on Bitfinex and iFinex across Ethereum and EOS. Token Metrics scenarios below model LEO outcomes across different total crypto market cap environments.

Disclosure
Educational purposes only, not financial advice. Crypto is volatile, do your own research and manage risk.
How to read it: Each band blends cycle analogues and market-cap share math with TA guardrails. Base assumes steady adoption and neutral or positive macro. Moon layers in a liquidity boom. Bear assumes muted flows and tighter liquidity.
TM Agent baseline: Token Metrics probabilities favor a modest range between about $5 and $15, with a base case around current levels near $9, conditional on exchange token utility remaining steady, and downside risk if centralized exchange macro pressure increases.
Token Metrics scenarios span four market cap tiers reflecting different crypto market maturity levels:


LEO Token is the native utility token of the Bitfinex and iFinex ecosystem, designed to provide benefits like reduced trading fees, enhanced lending and borrowing terms, and access to exclusive features on the platform. It operates on both Ethereum (ERC-20) and EOS blockchains, offering flexibility for users.
The primary role of LEO is to serve as a utility token within the exchange ecosystem, enabling fee discounts, participation in token sales, and other platform-specific advantages. Common usage patterns include holding LEO to reduce trading costs and utilizing it for enhanced platform services, positioning it primarily within the exchange token sector.
What gives LEO value?
LEO accrues value through reduced trading fees and enhanced platform services within the Bitfinex and iFinex ecosystem. Demand drivers include exchange usage and access to platform features, while supply dynamics follow the token’s exchange utility design. Value realization depends on platform activity and user adoption.
What price could LEO reach in the moon case?
Moon case projections range from $14.48 at 8T to $43.63 at 31T. These scenarios require maximum market cap expansion and strong exchange activity. Not financial advice.
Curious how these forecasts are made? Token Metrics delivers LEO on-chain grades, forecasts, and deep research on 6,000+ tokens. Instantly compare fundamentals, on-chain scores, and AI-powered predictions.
Disclosure
Educational purposes only, not financial advice. Crypto is volatile, do your own research and manage risk.

Layer 1 tokens like Sui represent bets on specific blockchain architectures winning developer and user mindshare. SUI carries both systematic crypto risk and unsystematic risk from Sui's technical roadmap execution and ecosystem growth. Multi-chain thesis suggests diversifying across several L1s rather than concentrating in one, since predicting which chains will dominate remains difficult.
The projections below show how SUI might perform under different market cap scenarios. While Sui may have strong fundamentals, prudent portfolio construction balances L1 exposure across Ethereum, competing smart contract platforms, and Bitcoin to capture the sector without overexposure to any single chain's fate.

Disclosure
Educational purposes only, not financial advice. Crypto is volatile, do your own research and manage risk.
Each band blends cycle analogues and market-cap share math with TA guardrails. Base assumes steady adoption and neutral or positive macro. Moon layers in a liquidity boom. Bear assumes muted flows and tighter liquidity.
TM Agent baseline: Token Metrics lead metric for Sui, cashtag $SUI, is a TM Grade of 67.4%, which maps to a Hold, and the trading signal is bearish, indicating short-term downward momentum. This suggests Token Metrics sees $SUI as having reasonable fundamentals but not yet strong conviction for substantial outperformance, while near-term momentum is negative and could limit rallies. Market context, brief: Bitcoin’s price direction is currently the primary market driver, and a risk-off Bitcoin environment increases downside pressure on layer-1 tokens like $SUI.
Professional investors across asset classes prefer diversified exposure over concentrated bets for good reason. Sui faces numerous risks - technical vulnerabilities, competitive pressure, regulatory targeting, team execution failure - any of which could derail SUI performance independent of broader market conditions. Token Metrics Indices spread this risk across one hundred tokens, ensuring no single failure destroys your crypto portfolio.
Diversification becomes especially critical in crypto given the sector's nascency and rapid evolution. Technologies and narratives that dominate today may be obsolete within years as the space matures. By holding SUI exclusively, you're betting not only on crypto succeeding but on Sui specifically remaining relevant. Index approaches hedge against picking the wrong horse while maintaining full crypto exposure.
Early access to Token Metrics Indices
Token Metrics scenarios span four market cap tiers, each representing different levels of crypto market maturity and liquidity:


These ranges illustrate potential outcomes for concentrated SUI positions, but investors should weigh whether single-asset exposure matches their risk tolerance or whether diversified strategies better suit their objectives.
Sui is a layer-1 blockchain network designed for general-purpose smart contracts and scalable user experiences. It targets high throughput and fast settlement, aiming to support applications that need low-latency interactions and horizontal scaling.
SUI is the native token used for transaction fees and staking, aligning validator incentives and securing the network. It underpins activity across common crypto sectors such as NFTs and DeFi while the ecosystem builds developer tooling and integrations.
Vision: Sui aims to create a highly scalable and low-latency blockchain platform that enables seamless user experiences for decentralized applications. Its vision centers on making blockchain technology accessible and efficient for mainstream applications by removing traditional bottlenecks in transaction speed and cost.
Problem: Many existing blockchains face trade-offs between scalability, security, and decentralization, often resulting in high fees and slow transaction finality during peak usage. This limits their effectiveness for applications requiring instant settlement, frequent interactions, or large user bases, such as games or social platforms. Sui addresses the need for a network that can scale horizontally without sacrificing speed or cost-efficiency.
Solution: Sui uses a unique object-centric blockchain model and the Move programming language to enable parallel transaction processing, allowing high throughput and instant finality for many operations. Its consensus mechanism, Narwhal and Tusk, is optimized for speed and scalability by decoupling transaction dissemination from ordering. The network supports smart contracts, NFTs, and decentralized applications, with an emphasis on developer ease and user experience. Staking is available for network security, aligning with common proof-of-stake utility patterns.
Market Analysis: Sui competes in the layer-1 blockchain space with platforms like Solana, Avalanche, and Aptos, all targeting high-performance decentralized applications. It differentiates itself through its object-based data model and parallel execution, aiming for superior scalability in specific workloads. Adoption drivers include developer tooling, ecosystem incentives, and integration with wallets and decentralized exchanges. The broader market for high-throughput blockchains is driven by demand for scalable Web3 applications, though it faces risks from technical complexity, regulatory uncertainty, and intense competition.
Fundamental Grade: 77.60% (Community 80%, Tokenomics 60%, Exchange 100%, VC 76%, DeFi Scanner 75%).
Technology Grade: 79.06% (Activity 77%, Repository 72%, Collaboration 89%, Security N/A, DeFi Scanner 75%).
Token Metrics empowers you to analyze Sui and hundreds of digital assets with AI-driven ratings, on-chain and fundamental data, and index solutions to manage portfolio risk smartly in a rapidly evolving crypto market.
What price could SUI reach in the moon case?
Moon case projections range from $7.94 at 8T to $40.61 at 31T. These scenarios assume maximum liquidity expansion and strong Sui adoption. Diversified strategies aim to capture upside across multiple tokens rather than betting exclusively on any single moon scenario. Not financial advice.
What's the risk/reward profile for SUI?
Risk/reward spans from $4.64 to $40.61. Downside risks include regulatory pressure and competitive displacement, while upside drivers include ecosystem growth and favorable liquidity. Concentrated positions amplify both tails, while diversified strategies smooth outcomes.
What are the biggest risks to SUI?
Key risks include regulatory actions, technical issues, competitive pressure from other L1s, and adverse market liquidity. Concentrated SUI positions magnify exposure to these risks. Diversified strategies spread risk across tokens with different profiles, reducing portfolio vulnerability to any single failure point.
Disclosure
Educational purposes only, not financial advice. Crypto is volatile, concentration amplifies risk, and diversification is a fundamental principle of prudent portfolio construction. Do your own research and manage risk appropriately.

Most investors understand that diversification matters—the famous "don't put all your eggs in one basket" principle. However, understanding diversification conceptually differs dramatically from implementing it effectively. Poor diversification strategies create illusions of safety while concentrating risk in hidden ways. True diversification requires sophisticated allocation across multiple dimensions simultaneously.
Token Metrics AI Indices provide professional-grade diversification tools, but maximizing their power requires strategic allocation decisions. How much total capital should you allocate to crypto? How should you split that allocation across different indices? How do you balance crypto with traditional assets? What role should conservative versus aggressive indices play?
This comprehensive guide explores portfolio allocation mastery, examining the principles of effective diversification, specific allocation frameworks for different investor profiles, tactical adjustments for changing conditions, and avoiding common diversification mistakes that undermine portfolio performance.
Many investors believe diversification simply means holding many assets. True diversification requires deeper strategic thinking.
Crypto represents one component of comprehensive financial planning. Optimal allocation requires considering how crypto fits within total wealth.
Appropriate crypto allocation varies dramatically based on age, income stability, and financial obligations.
Ages 20-35 (Aggressive Accumulation Phase):
Ages 35-50 (Balanced Growth Phase):
Ages 50-65 (Pre-Retirement Transition):
Ages 65+ (Retirement Distribution):
These frameworks provide starting points—adjust based on individual risk tolerance, wealth level, and financial obligations.
Never invest emergency funds or money needed within 3-5 years in cryptocurrency. Maintain 6-12 months of living expenses in high-yield savings accounts or money market funds completely separate from investment portfolios.
This liquidity buffer prevents forced selling during market crashes. Without adequate emergency reserves, unexpected expenses force liquidating crypto holdings at worst possible times—turning temporary paper losses into permanent realized losses.
High-interest debt (credit cards, personal loans above 8-10%) should be eliminated before aggressive crypto investing. The guaranteed "return" from eliminating 18% credit card interest exceeds expected crypto returns on risk-adjusted basis.
However, low-interest debt (mortgages below 4-5%) can coexist with crypto investing—no need to delay investing until mortgage-free. The opportunity cost of waiting decades to invest exceeds the modest interest savings from accelerated mortgage payments.
Once you've determined total crypto allocation, the next decision involves distributing that allocation across Token Metrics' various indices.
Structure crypto allocation across three risk tiers creating balanced exposure:
Conservative Tier (40-50% of crypto allocation):
Conservative indices emphasizing Bitcoin, Ethereum, and fundamentally strong large-cap tokens. This tier provides stability and reliable exposure to crypto's overall growth while limiting volatility.
Suitable indices: Bitcoin-weighted indices, large-cap indices, blue-chip crypto indices
Balanced Tier (30-40% of crypto allocation):
Balanced indices combining established tokens with growth-oriented mid-caps. This tier balances stability and growth potential through strategic diversification.
Suitable indices: Diversified market indices, multi-sector indices, smart contract platform indices
Aggressive Tier (20-30% of crypto allocation):
Aggressive growth indices targeting smaller-cap tokens with highest upside potential. This tier drives outperformance during bull markets while limited position sizing contains downside risk.
Suitable indices: Small-cap growth indices, sector-specific indices (DeFi, gaming, AI), emerging ecosystem indices
Different crypto sectors outperform during different market phases. Tactical sector rotation within your allocation captures these rotations:
Token Metrics indices provide sector-specific options allowing tactical overweighting of sectors positioned for outperformance while maintaining diversified core holdings.
Blockchain ecosystems exhibit different characteristics and growth trajectories. Diversifying across multiple ecosystems prevents concentration in single platform risk:
Token Metrics indices spanning multiple ecosystems provide automatic geographic and platform diversification preventing single-ecosystem concentration risk.
Markets move constantly, causing allocations to drift from targets. Systematic rebalancing maintains desired risk exposure and forces beneficial "buy low, sell high" discipline.
The simplest approach rebalances on fixed schedules regardless of market conditions:
More frequent rebalancing captures opportunities faster but triggers more taxable events in non-retirement accounts. Less frequent rebalancing reduces trading costs but allows greater allocation drift.
More sophisticated approaches rebalance when allocations drift beyond predetermined thresholds:
Threshold rebalancing responds to actual market movements rather than arbitrary calendar dates, potentially improving timing while reducing unnecessary transactions.
In taxable accounts, coordinate rebalancing with tax considerations:
This tax awareness preserves more wealth for compounding rather than sending it to tax authorities.
Effective diversification includes position sizing rules preventing excessive concentration even within diversified portfolios.
Establish maximum position sizes preventing any single index from dominating:
These guardrails maintain diversification even when particular indices perform extremely well, preventing overconfidence from creating dangerous concentration.
While crypto indices should be held long-term through volatility, establish strategic loss limits for total crypto allocation relative to overall portfolio:
These strategic boundaries prevent crypto volatility from creating portfolio-level instability while maintaining beneficial long-term exposure.
Beyond basic frameworks, advanced strategies optimize allocation for specific goals and market conditions.
The barbell approach combines extremely conservative and extremely aggressive positions while avoiding middle ground:
This approach provides downside protection through conservative core while capturing maximum upside through concentrated aggressive positions—potentially delivering superior risk-adjusted returns versus balanced approaches.
Maintain stable core allocation (70% of crypto) in diversified indices while using tactical satellite positions (30%) rotated based on market conditions and opportunities:
This approach combines buy-and-hold stability with active opportunity capture.
Rather than allocating by dollar amounts, allocate by risk contribution ensuring each index contributes equally to portfolio volatility:
This sophisticated approach prevents high-volatility positions from dominating portfolio risk even with modest dollar allocations.
Portfolio allocation represents the most important investment decision you'll make—far more impactful than individual token selection or market timing. Academic research consistently shows asset allocation determines 90%+ of portfolio performance variation, while security selection and timing contribute only marginally.
Token Metrics provides world-class indices, but your allocation strategy determines whether you capture their full potential or undermine them through poor diversification. The frameworks presented here offer starting points—adapt them to your specific situation, risk tolerance, and financial goals.
Remember that optimal allocation isn't static—it evolves with life stages, market conditions, and financial circumstances. Regular review and adjustment keeps strategies aligned with current reality rather than outdated assumptions.
The investors who build lasting wealth aren't those who find magical assets or perfect timing—they're those who implement sound allocation strategies and maintain them through all market conditions. This discipline, more than any other factor, separates successful wealth builders from those whose portfolios underperform despite choosing quality investments.
Begin implementing strategic allocation today. Start with appropriate total crypto allocation for your life stage, distribute across conservative, balanced, and aggressive indices providing genuine diversification, and establish rebalancing discipline maintaining target exposures through market volatility.
Your allocation strategy, properly implemented, will compound into extraordinary wealth over decades. Token Metrics provides the tools—your allocation decisions determine the results.
Start your 7-day free trial today and begin building the optimally allocated portfolio that will drive your financial success for decades to come.

The dream of passive income drives millions toward cryptocurrency—earning money while you sleep, building wealth automatically, achieving financial freedom without constant work. Yet most crypto "passive income" strategies require active management, constant monitoring, technical expertise, and significant time investment. They're anything but passive.
Token Metrics AI Indices deliver genuine passive income through systematic wealth accumulation requiring minimal ongoing effort. Once established, your crypto portfolio grows automatically through professional AI management, strategic rebalancing, and compound returns—all without your daily involvement or active trading.
This comprehensive guide explores how crypto indices create true passive income, compares index investing to other passive income strategies, reveals the mathematics of automated wealth compounding, and provides actionable frameworks for building substantial passive income streams through disciplined index allocation.
Understanding genuine passive income requires distinguishing it from "active income disguised as passive" that dominates crypto discussions.
Many crypto strategies marketed as "passive income" require substantial ongoing effort:
These strategies generate income but demand active participation—they're jobs, not passive income streams.
True passive income exhibits specific characteristics:
Token Metrics indices meet all these criteria—once established, your wealth grows automatically through AI-powered management while you focus on other priorities.
Understanding the mechanisms generating passive returns through indices reveals why this approach delivers superior risk-adjusted income compared to alternatives.
The primary income source from crypto indices is capital appreciation—portfolio value increasing over time as cryptocurrency markets grow and AI optimization captures opportunities.
Unlike stocks requiring decades to double, crypto indices can deliver 50-200% annual returns during favorable market cycles. A $25,000 initial investment growing at 60% annually becomes $100,000 in three years and $400,000 in six years—substantial wealth creation requiring zero active trading.
This appreciation occurs passively through:
You make no trading decisions. You don't research tokens. You don't time markets. The system handles everything while appreciation compounds automatically.
Passive income's true power emerges through compounding—returns generating additional returns in self-reinforcing cycles. Token Metrics indices amplify compounding through systematic profit capture and reinvestment.
When indices rebalance, profits from appreciating tokens are automatically reinvested into new opportunities. This mechanical reinvestment ensures all gains compound rather than sitting idle. Over years and decades, compounding creates extraordinary wealth accumulation.
Example: $10,000 growing at 40% annually with full reinvestment becomes $150,000 in seven years. Without reinvestment—if you withdrew gains annually—the same investment reaches only $38,000. Compounding creates an additional $112,000 in wealth automatically.
Adding regular contributions to index positions creates powerful dollar-cost averaging benefits that enhance passive returns. By investing fixed amounts regardless of market conditions, you automatically buy more tokens when prices are low and fewer when prices are high.
This systematic averaging removes timing pressure—you don't need to identify perfect entry points. Whether markets surge or crash, your regular contributions continue mechanically, building positions that appreciate over complete market cycles.
Combined with compound growth, dollar-cost averaging creates remarkable long-term wealth accumulation requiring minimal effort beyond initial automated contribution setup.
Token Metrics indices can be held in tax-advantaged retirement accounts where appreciation compounds tax-free (Roth IRA) or tax-deferred (Traditional IRA). This tax optimization dramatically accelerates wealth accumulation compared to taxable accounts.
In taxable accounts, annual rebalancing triggers capital gains taxes that reduce compounding power. In retirement accounts, all gains compound without tax drag—a significant passive income enhancement requiring only initial account setup.
Understanding how index-based passive income compares to other strategies reveals relative advantages.
Vs. Staking/Yield Farming: While staking offers 5-20% APY, it involves token price risk (10% yield means nothing if price drops 50%), lock-up periods preventing selling during crashes, impermanent loss, protocol risks, and constant management overhead. Index capital appreciation typically exceeds staking yields by 40+ percentage points while maintaining complete liquidity.
Vs. Real Estate: Real estate requires $50,000-$500,000+ minimums, involves management burdens despite property managers, suffers from illiquidity (months to sell), concentrates wealth geographically, and carries leverage risks. Indices require minimal capital, zero management, complete liquidity, global diversification, and no leverage risks.
Vs. Dividend Stocks: Dividend yields of 2-4% and appreciation of 6-8% annually pale against crypto potential. Dividends trigger immediate taxation reducing after-tax returns. Crypto indices offer dramatically higher return potential with tax-efficient compounding.
Vs. Bitcoin/Ethereum Only: Concentrated two-asset holdings sacrifice diversification, miss altcoin opportunities, lack rebalancing benefits, and forego professional management. Indices provide superior risk-adjusted returns with equal passivity.
Understanding how small initial investments and regular contributions compound into substantial wealth over time makes passive income potential concrete rather than abstract.
You don't need large capital to begin building meaningful passive income. Small amounts invested consistently compound into substantial wealth through time and returns.
Scenario 1: Modest Beginning
This scenario transforms $31,000 in total contributions into nearly half a million through compound growth—passive income requiring only initial setup and automated monthly contributions.
Scenario 2: Aggressive Accumulation
Nearly $1 million from $65,000 in contributions—extraordinary passive wealth creation through systematic index investing.
Real returns vary annually—bull markets deliver 100-300% returns while bear markets create 50-80% drawdowns. However, averaging across complete cycles, conservative crypto indices historically achieve 30-60% annualized returns.
These projections assume no income from your job increases, which is unrealistic. As your career progresses and income grows, contribution amounts can increase proportionally, accelerating wealth accumulation further.
Once accumulated, substantial crypto index holdings generate retirement income through systematic withdrawal strategies.
If you accumulate $2 million in crypto indices by age 60, withdrawing 4% annually provides $80,000 passive income while preserving principal. If crypto continues appreciating even modestly at 15% annually, your portfolio grows despite withdrawals, providing inflation-protected lifetime income.
This passive income stream requires no active work—automated monthly withdrawals provide cash flow while remaining capital compounds through continued AI management.
Creating effective passive income through crypto indices requires systematic implementation across several phases.
Phase 1: Foundation Setup (Month 1)
Complete this foundation work once—all subsequent wealth building occurs automatically.
Phase 2: Automation Implementation (Month 2)
After automation setup, your system operates independently requiring minimal intervention.
Phase 3: Optimization and Scaling (Months 3-12)
Even during optimization phase, time commitment remains minimal—1-2 hours monthly maximum.
Phase 4: Wealth Preservation and Distribution (Years 10+)
Throughout all phases, your involvement remains minimal while wealth compounds automatically through professional AI management.
Optimizing passive income requires strategic decisions about allocation, risk management, and contribution timing.
Allocation Balance: Higher returns come with higher volatility. Conservative approach uses 70% conservative/20% balanced/10% aggressive indices. Moderate uses 50/30/20 split. Aggressive uses 30/30/40 split. All remain completely passive from management perspective.
Contribution Timing: Maintain regular automated contributions always, but keep 10-20% dry powder in stablecoins for crisis deployment during 30%+ market crashes. These fear-driven purchases generate outsized returns.
Tax Location Optimization: Roth IRA provides tax-free growth ideal for aggressive indices. Traditional IRA offers tax-deferred growth suitable for conservative indices. Taxable accounts provide flexibility but trigger annual rebalancing taxes. This optimization happens once but compounds into substantial savings over decades.
Even with automated systems, investors make predictable mistakes that undermine passive income goals.
True passive income through crypto indices isn't mythical—it's mathematically achievable through systematic implementation and patient execution. Token Metrics provides the professional AI management, diversification, and optimization infrastructure transforming crypto from speculation into genuine passive wealth building.
The beauty of this approach is simplicity: establish system once, contribute consistently, trust professional management, and let compound growth work its magic over years and decades. No day trading. No constant monitoring. No technical expertise required. Just disciplined, automated wealth accumulation.
Your action determines outcomes. Those who begin today, implement systematic contributions, and maintain discipline through market cycles build substantial passive income streams funding financial independence. Those who delay, overthink, or abandon strategy during volatility watch opportunities pass without capturing benefits.
Token Metrics indices eliminate complexity and emotion from crypto investing, leaving only systematic wealth accumulation. The technology works. The mathematics favor consistent long-term investors. The only question is whether you'll begin building your passive income system today or postpone financial freedom indefinitely.
Start your 7-day free trial and take the first step toward true passive income through automated, professional crypto index investing. Your future self will thank you for the decision you make today.

When evaluating cryptocurrency index providers, most investors focus on past performance, fees, or token selection. While these factors matter, they miss the fundamental differentiator determining long-term success: the sophistication of artificial intelligence powering portfolio management.
Token Metrics doesn't just use AI as marketing buzzword—the platform employs cutting-edge machine learning systems that fundamentally outperform human decision-making in ways that compound into extraordinary advantages over time. Understanding why AI-driven indices surpass both traditional approaches and human-managed alternatives reveals why this technology represents the future of crypto investing.
This comprehensive guide explores the specific AI technologies powering Token Metrics indices, examines what these systems can do that humans cannot, compares AI-driven approaches to traditional alternatives, and reveals how technological advantages translate into superior investment outcomes.
Before understanding AI's advantages, recognize the inherent limitations of human portfolio management in cryptocurrency markets.
The human brain processes information sequentially and slowly. A skilled analyst might evaluate 10-20 cryptocurrencies daily using 5-10 data points each. This yields 50-200 data points daily—a tiny fraction of available information.
Token Metrics' AI analyzes 6,000+ cryptocurrencies using 80+ data points each—480,000+ data points daily. This 2,400x information processing advantage means the AI identifies opportunities and risks invisible to human analysis.
Human decision-making suffers from systematic cognitive biases:
These biases cause systematic errors leading to poor timing, holding losers too long, selling winners prematurely, and following crowds into overvalued assets. AI systems have no cognitive biases—they evaluate data objectively based on mathematical relationships.
Human portfolio managers experience fear during market crashes and euphoria during rallies. These emotions trigger fight-or-flight responses overwhelming rational analysis, causing panic selling at bottoms and overconfident buying at tops.
AI experiences no emotions. Market crashes don't trigger fear. Rallies don't create euphoria. The system evaluates probabilities and executes strategies mechanically regardless of market sentiment.
Humans require sleep, breaks, vacations, and time for other life activities. Portfolio managers cannot monitor markets 24/7 or maintain consistent attention over years without degradation.
AI operates continuously without fatigue, monitoring global markets across time zones simultaneously. The system never sleeps, never takes vacations, never loses focus—maintaining perpetual vigilance impossible for humans.
Human learning occurs slowly through experience and study. A portfolio manager might learn from hundreds of trades over decades, building intuition from limited personal experience.
AI learns from millions of data points across thousands of assets simultaneously. Every market movement, every token launch, every sentiment shift contributes to model training. The system identifies patterns across entire crypto history that individual humans could never detect.
Token Metrics employs an ensemble of sophisticated machine learning models, each serving specific purposes within the investment process.
These models excel at identifying complex, non-linear relationships between variables. In crypto markets, simple linear relationships rarely exist—token performance depends on intricate interactions between multiple factors.
Gradient boosting builds thousands of decision trees, each learning from previous trees' errors. This iterative process creates highly accurate predictions by combining many weak predictors into strong aggregate models.
Application: Identifying which combinations of technical, fundamental, and sentiment factors predict future price movements most accurately.
RNNs specialize in time-series analysis, recognizing patterns in sequential data. Cryptocurrency prices represent time-series data where past patterns influence future movements.
Unlike simple technical analysis looking at individual indicators, RNNs identify complex temporal relationships spanning multiple timeframes simultaneously. The networks detect subtle patterns in how prices, volumes, and other metrics evolve together over time.
Application: Forecasting price trajectories by learning from historical patterns while adapting to changing market dynamics.
Random forest algorithms create multiple decision trees using random subsets of data and features, then aggregate their predictions. This approach reduces overfitting risk—where models perform excellently on historical data but fail on new data.
By training on different data subsets, random forests identify robust patterns that generalize well rather than memorizing specific historical sequences unlikely to repeat exactly.
Application: Robust token classification separating quality projects from low-quality alternatives based on generalizable characteristics.
NLP algorithms analyze text data from social media, news articles, developer communications, and community forums. These systems extract sentiment, identify trending topics, detect narrative shifts, and quantify community engagement.
Unlike humans who might read dozens of articles weekly, NLP processes millions of text sources daily, identifying sentiment patterns and narrative changes before they become obvious.
Application: Gauging market sentiment, detecting emerging narratives, identifying coordinated pumps or manipulative campaigns, and assessing community health.
Anomaly detection identifies unusual patterns suggesting either opportunities or risks. These systems establish baseline "normal" behavior, then flag deviations warranting attention.
In crypto markets, anomalies might indicate insider trading before announcements, coordinated manipulation schemes, security vulnerabilities, or emerging trends before mainstream recognition.
Application: Early warning systems for security threats, manipulation detection, and identifying breakout candidates showing unusual strength relative to historical patterns.
Understanding specific capabilities unique to AI reveals why technology-driven approaches surpass traditional methods.
Human portfolio managers analyze assets sequentially—evaluating Bitcoin, then Ethereum, then Solana, one at a time. This sequential processing misses relationships between assets.
AI analyzes all assets simultaneously, identifying correlations, relative strength patterns, sector rotations, and cross-asset opportunities. The system recognizes when DeFi tokens strengthen relative to Layer-1s, when memecoins show coordinated movement, or when specific sectors lead or lag broader markets.
This simultaneous analysis reveals relative value opportunities invisible to sequential human analysis.
Humans excel at recognizing simple patterns—support and resistance levels, head-and-shoulders formations, moving average crossovers. However, complex multi-dimensional patterns exceed human cognitive capacity.
AI identifies patterns involving dozens of variables simultaneously across thousands of assets. These patterns might involve specific combinations of technical indicators, on-chain metrics, sentiment scores, and fundamental factors that human analysts could never process holistically.
Example: The AI might recognize that tokens with specific combinations of technical momentum, developer activity growth, and social sentiment shifts outperform 73% of the time over subsequent 30 days. Humans cannot track and validate such complex multi-factor patterns.
The most valuable investment opportunities occur during market extremes when fear or greed overwhelm rational analysis. Humans struggle maintaining discipline during these periods—buying during maximum fear feels terrifying, selling during euphoria seems foolish.
AI executes mechanically based on statistical probabilities regardless of market sentiment. When indicators show extreme fear and historically attractive valuations, the system buys aggressively. When indicators show extreme euphoria and overvaluation, the system takes profits systematically.
This emotionless execution during extremes generates substantial alpha that humans rarely capture despite understanding the principle intellectually.
Human learning occurs slowly. Portfolio managers develop strategies based on historical experience, but adapting to new market regimes takes time and often requires painful losses first.
AI learns continuously from every market movement. When strategies underperform, the system adjusts weightings automatically. When new patterns emerge, the AI incorporates them immediately. This perpetual learning ensures strategies evolve with markets rather than becoming obsolete.
Markets move in milliseconds. By the time humans notice significant price movements and decide how to respond, opportunities have passed.
AI monitors markets continuously and responds within microseconds. When rebalancing signals trigger or new opportunities emerge, execution occurs immediately rather than after human deliberation delays.
This speed advantage proves especially valuable during volatile periods when opportunities appear and disappear rapidly.
Understanding Token Metrics' AI advantages becomes clearer through direct comparison with traditional approaches.
Vs. Market-Cap-Weighted Indices: Traditional indices simply track largest cryptocurrencies by size, overexposing to overvalued bubbles and missing emerging opportunities. Token Metrics' AI evaluates fundamentals, momentum, and valuations, overweighting undervalued opportunities regardless of size.
Vs. Human-Managed Crypto Funds: Traditional funds employ analyst teams covering 50-100 tokens maximum, influenced by cognitive biases, charging 2% management and 20% performance fees. Token Metrics covers 6,000+ tokens without biases or emotions at subscription fees far lower than traditional management costs.
Vs. DIY Individual Selection: Individual investors face time constraints, limited professional tools, emotional attachment preventing objectivity, and FOMO-driven poor timing. AI provides comprehensive analysis using professional data, objective evaluation, and systematic timing based on probabilities.
Understanding theoretical AI advantages is useful, but what matters most is how these translate into actual superior investment performance.
AI identifies emerging opportunities before they become obvious to human investors. By analyzing on-chain activity, developer engagement, and early sentiment shifts, the system detects promising tokens months before mainstream attention arrives.
Result: Index positions established at significantly lower prices capture maximum appreciation when opportunities materialize.
AI's anomaly detection and comprehensive analysis identify risks earlier than human analysis. Security vulnerabilities, team problems, tokenomics issues, or manipulation schemes trigger early warning systems.
Result: Positions reduced or eliminated before major problems cause catastrophic losses, preserving capital for better opportunities.
The system identifies optimal rebalancing timing based on technical signals, sentiment extremes, and volatility patterns. Rather than rebalancing on arbitrary schedules, the AI rebalances when conditions offer maximum advantage.
Result: Systematic "buy low, sell high" execution that human emotion prevents, generating additional alpha through superior timing.
AI constructs portfolios maximizing diversification benefits through correlation analysis across all tokens. Rather than naive diversification holding many similar assets, the system combines tokens with complementary characteristics.
Result: Smoother return profiles with superior risk-adjusted performance through true diversification rather than false variety.
Every market cycle improves AI performance through additional training data. Each bull market, bear market, and consolidation phase provides data points refining model accuracy.
Result: Performance improving over time rather than degrading as with human strategies that become obsolete when markets evolve.
AI technology continues advancing rapidly, suggesting Token Metrics' advantages will expand over time:
Understanding AI advantages has direct practical implications:
Artificial intelligence represents the future of cryptocurrency portfolio management not because it's trendy—because it's fundamentally superior. The information processing, pattern recognition, emotionless execution, and continuous learning capabilities of modern AI exceed human limitations by orders of magnitude.
Token Metrics doesn't just use AI as marketing—the platform employs institutional-grade machine learning providing genuine competitive advantages translating into measurably superior risk-adjusted returns.
The choice facing crypto investors is straightforward: compete against sophisticated AI systems using human limitations, or harness those same AI capabilities through Token Metrics indices. One approach fights the future; the other embraces it.
As AI technology continues advancing and more capital recognizes these advantages, the performance gap between AI-driven and traditional approaches will widen. Early adopters of superior technology capture outsized returns, while late adopters play catch-up from positions of disadvantage.
Your opportunity exists today. Token Metrics provides access to institutional-grade AI previously available only to hedge funds and professional investors. The democratization of artificial intelligence through accessible indices transforms crypto investing from speculation into systematic wealth building.
Begin your 7-day free trial and experience firsthand how artificial intelligence transforms cryptocurrency investing from emotional gambling into disciplined, technology-driven wealth creation.

The Layer 1 landscape is consolidating as users and developers gravitate to chains with clear specialization. Bitcoin Cash positions itself as a payment-focused chain with low fees and quick settlement for everyday usage.
The scenario projections below map potential outcomes for BCH across different total crypto market sizes. Base cases assume steady usage and listings, while moon scenarios factor in stronger liquidity and accelerated adoption.

Disclosure
Educational purposes only, not financial advice. Crypto is volatile, do your own research and manage risk.
How to read it: Each band blends cycle analogues and market-cap share math with TA guardrails. Base assumes steady adoption and neutral or positive macro. Moon layers in a liquidity boom. Bear assumes muted flows and tighter liquidity.
TM Agent baseline:
Token Metrics lead metric for Bitcoin Cash, cashtag $BCH, is a TM Grade of 54.81%, which translates to Neutral, and the trading signal is bearish, indicating short-term downward momentum. This implies Token Metrics views $BCH as mixed value long term: fundamentals look strong, while valuation and technology scores are weak, so upside depends on improvements in adoption or technical development. Market context: Bitcoin has been setting market direction, and with broader risk-off moves altcoins face pressure, which increases downside risk for $BCH in the near term.
Live details:
Affiliate Disclosure: We may earn a commission from qualifying purchases made via this link, at no extra cost to you.
Token Metrics scenarios span four market cap tiers, each representing different levels of crypto market maturity and liquidity:


Each tier assumes progressively stronger market conditions, with the base case reflecting steady growth and the moon case requiring sustained bull market dynamics.
Bitcoin Cash represents one opportunity among hundreds in crypto markets. Token Metrics Indices bundle BCH with top one hundred assets for systematic exposure to the strongest projects. Single tokens face idiosyncratic risks that diversified baskets mitigate.
Historical index performance demonstrates the value of systematic diversification versus concentrated positions.
Bitcoin Cash is a peer-to-peer electronic cash network focused on fast confirmation and low fees. It launched in 2017 as a hard fork of Bitcoin with larger block capacity to prioritize payments. The chain secures value transfers using proof of work and aims to keep everyday transactions affordable.
BCH is used to pay transaction fees and settle transfers, and it is widely listed across major exchanges. Adoption centers on payments, micropayments, and remittances where low fees matter. It competes as a payment‑focused Layer 1 within the broader crypto market.
Token Metrics AI provides comprehensive context on Bitcoin Cash's positioning and challenges.
Vision:
Bitcoin Cash (BCH) is a cryptocurrency that emerged from a 2017 hard fork of Bitcoin, aiming to function as a peer-to-peer electronic cash system with faster transactions and lower fees. It is known for prioritizing on-chain scalability by increasing block sizes, allowing more transactions per block compared to Bitcoin. This design choice supports its use in everyday payments, appealing to users seeking a digital cash alternative. Adoption has been driven by its utility in micropayments and remittances, particularly in regions with limited banking infrastructure. However, Bitcoin Cash faces challenges including lower network security due to reduced mining hash rate compared to Bitcoin, and ongoing competition from both Bitcoin and other scalable blockchains. Its value proposition centers on accessibility and transaction efficiency, but it operates in a crowded space with evolving technological and regulatory risks.
Problem:
The project addresses scalability limitations in Bitcoin, where rising transaction fees and slow confirmation times hinder its use for small, frequent payments. As Bitcoin evolved into a store of value, a gap emerged for a blockchain-based currency optimized for fast, low-cost transactions accessible to the general public.
Solution:
Bitcoin Cash increases block size limits from 1 MB to 32 MB, enabling more transactions per block and reducing congestion. This on-chain scaling approach allows for faster confirmations and lower fees, making microtransactions feasible. The network supports basic smart contract functionality and replay protection, maintaining compatibility with Bitcoin's core architecture while prioritizing payment utility.
Market Analysis:
Bitcoin Cash operates in the digital currency segment, competing with Bitcoin, Litecoin, and stablecoins for use in payments and remittances. While not the market leader, it occupies a niche focused on on-chain scalability for transactional use. Its adoption is influenced by merchant acceptance, exchange liquidity, and narratives around digital cash. Key risks include competition from layer-2 solutions on other blockchains, regulatory scrutiny of cryptocurrencies, and lower developer and miner activity compared to larger networks. Price movements are often tied to broader crypto market trends and internal protocol developments. Despite its established presence, long-term growth depends on sustained utility, network security, and differentiation in a market increasingly dominated by high-throughput smart contract platforms.
Fundamental Grade: 80.41% (Community 62%, Tokenomics 100%, Exchange 100%, VC —, DeFi Scanner 72%).
Technology Grade: 29.63% (Activity 22%, Repository 70%, Collaboration 48%, Security —, DeFi Scanner 72%).
Can BCH reach $3,000?
Based on the scenarios, BCH could reach $3,000 in the 23T moon case and 31T base case. The 23T tier projects $3,446.53 in the moon case. Not financial advice.
Can BCH 10x from current levels?
At current price of $553.54, a 10x would reach $5,535.40. This falls within the 31T base and moon cases. Bear in mind that 10x returns require substantial market cap expansion. Not financial advice.
Should I buy BCH now or wait?
Timing depends on your risk tolerance and macro outlook. Current price of $553.54 sits below the 8T bear case in our scenarios. Dollar-cost averaging may reduce timing risk. Not financial advice.
Want exposure? Buy BCH on MEXC
Disclosure
Educational purposes only, not financial advice. Crypto is volatile, do your own research and manage risk.

Infrastructure protocols become more valuable as the crypto ecosystem scales and relies on robust middleware. Chainlink provides critical oracle infrastructure where proven utility and deep integrations drive long-term value over retail speculation. Increasing institutional adoption raises demand for professional-grade data delivery and security.
Token Metrics projections for LINK below span multiple total market cap scenarios from conservative to aggressive. Each tier assumes different levels of infrastructure demand as crypto evolves from speculative markets to institutional-grade systems. These bands frame LINK's potential outcomes into 2027.

Disclosure
Educational purposes only, not financial advice. Crypto is volatile, do your own research and manage risk.
How to read it: Each band blends cycle analogues and market-cap share math with TA guardrails. Base assumes steady adoption and neutral or positive macro. Moon layers in a liquidity boom. Bear assumes muted flows and tighter liquidity.
TM Agent baseline: Token Metrics lead metric for Chainlink, cashtag $LINK, is a TM Grade of 23.31%, which translates to a Sell, and the trading signal is bearish, indicating short-term downward momentum. This means Token Metrics currently does not endorse $LINK as a long-term buy at current conditions.
Live details: Chainlink Token Details
Affiliate Disclosure: We may earn a commission from qualifying purchases made via this link, at no extra cost to you.
Token Metrics scenarios span four market cap tiers, each representing different levels of crypto market maturity and liquidity:
8T: At an 8 trillion dollar total crypto market cap, LINK projects to $26.10 in bear conditions, $30.65 in the base case, and $35.20 in bullish scenarios.
16T: Doubling the market to 16 trillion expands the range to $42.64 (bear), $56.29 (base), and $69.95 (moon).
23T: At 23 trillion, the scenarios show $59.18, $81.94, and $104.70 respectively.
31T: In the maximum liquidity scenario of 31 trillion, LINK could reach $75.71 (bear), $107.58 (base), or $139.44 (moon).
Chainlink represents one opportunity among hundreds in crypto markets. Token Metrics Indices bundle LINK with top one hundred assets for systematic exposure to the strongest projects. Single tokens face idiosyncratic risks that diversified baskets mitigate.
Historical index performance demonstrates the value of systematic diversification versus concentrated positions.
Chainlink is a decentralized oracle network that connects smart contracts to real-world data and systems. It enables secure retrieval and verification of off-chain information, supports computation, and integrates across multiple blockchains. As adoption grows, Chainlink serves as critical infrastructure for reliable data feeds and automation.
The LINK token is used to pay node operators and secure the network’s services. Common use cases include DeFi price feeds, insurance, and enterprise integrations, with CCIP extending cross-chain messaging and token transfers.
Vision: Chainlink aims to create a decentralized, secure, and reliable network for connecting smart contracts with real-world data and systems. Its vision is to become the standard for how blockchains interact with external environments, enabling trust-minimized automation across industries.
Problem: Smart contracts cannot natively access data outside their blockchain, limiting their functionality. Relying on centralized oracles introduces single points of failure and undermines the security and decentralization of blockchain applications. This creates a critical need for a trustless, tamper-proof way to bring real-world information onto blockchains.
Solution: Chainlink solves this by operating a decentralized network of node operators that fetch, aggregate, and deliver data from off-chain sources to smart contracts. It uses cryptographic proofs, reputation systems, and economic incentives to ensure data integrity. The network supports various data types and computation tasks, allowing developers to build complex, data-driven decentralized applications.
Market Analysis: Chainlink is a market leader in the oracle space and a key infrastructure component in the broader blockchain ecosystem, particularly within Ethereum and other smart contract platforms. It faces competition from emerging oracle networks like Band Protocol and API3, but maintains a strong first-mover advantage and widespread integration across DeFi, NFTs, and enterprise blockchain solutions. Adoption is driven by developer activity, partnerships with major blockchain projects, and demand for secure data feeds. Key risks include technological shifts, regulatory scrutiny on data providers, and execution challenges in scaling decentralized oracle networks. As smart contract usage grows, so does the potential for oracle services, positioning Chainlink at the center of a critical niche, though its success depends on maintaining security and decentralization over time.
Fundamental Grade: 74.58% (Community 81%, Tokenomics 100%, Exchange 100%, VC —, DeFi Scanner 17%).
Technology Grade: 88.50% (Activity 81%, Repository 72%, Collaboration 100%, Security 86%, DeFi Scanner 17%).
Can LINK reach $100?
Yes. Based on the scenarios, LINK could reach $100+ in the 23T moon case. The 23T tier projects $104.70 in the moon case. Not financial advice.
What price could LINK reach in the moon case?
Moon case projections range from $35.20 at 8T to $139.44 at 31T. These scenarios assume maximum liquidity expansion and strong Chainlink adoption. Not financial advice.
Should I buy LINK now or wait?
Timing depends on risk tolerance and macro outlook. Current price of $18.09 sits below the 8T bear case in the scenarios. Dollar-cost averaging may reduce timing risk. Not financial advice.
Track live grades and signals: Token Details
Want exposure? Buy LINK on MEXC
Disclosure
Educational purposes only, not financial advice. Crypto is volatile, do your own research and manage risk.
Discover the full potential of your crypto research and portfolio management with Token Metrics. Our ratings combine AI-driven analytics, on-chain data, and decades of investing expertise—giving you the edge to navigate fast-changing markets. Try our platform to access scenario-based price targets, token grades, indices, and more for institutional and individual investors. Token Metrics is your research partner through every crypto market cycle.

The crypto market is tilting bullish into 2026 as liquidity, infrastructure, and participation improve across the board. Clearer rules and standards are reshaping the classic four-year cycle, flows can arrive earlier, and strength can persist longer than in prior expansions.
Institutional access is widening through ETFs and custody, while L2 scaling and real-world integrations help sustain on‑chain activity. This healthier backdrop frames our scenario work for HYPE. The ranges below reflect different total crypto market sizes and the share Hyperliquid could capture under each regime.

Disclosure
Educational purposes only, not financial advice. Crypto is volatile, do your own research and manage risk.
How to read it: Each band blends cycle analogues and market-cap share math with TA guardrails. Base assumes steady adoption and neutral or positive macro. Moon layers in a liquidity boom. Bear assumes muted flows and tighter liquidity.
TM Agent baseline: Token Metrics TM Grade is 73.9%, a Buy, and the trading signal is bearish, indicating short-term downward momentum. This means Token Metrics judges HYPE as fundamentally attractive over the long term, while near-term momentum is negative and may limit rallies.
Live details: Hyperliquid Token Details
Affiliate Disclosure: We may earn a commission from qualifying purchases made via this link, at no extra cost to you.
Scenario Analysis
Token Metrics scenarios span four market cap tiers, each representing different levels of crypto market maturity and liquidity:
8T: At an 8 trillion dollar total crypto market cap, HYPE projects to $48.81 in bear conditions, $49.92 in the base case, and $51.03 in bullish scenarios.

16T: Doubling the market to 16 trillion expands the range to $50.72 (bear), $54.05 (base), and $57.38 (moon).

23T: At 23 trillion, the scenarios show $52.62, $58.17, and $63.72 respectively.

31T: In the maximum liquidity scenario of 31 trillion, HYPE could reach $54.52 (bear), $62.29 (base), or $70.07 (moon).

Each tier assumes progressively stronger market conditions, with the base case reflecting steady growth and the moon case requiring sustained bull market dynamics.
Diversification matters. HYPE is compelling, yet concentrated bets can be volatile. Token Metrics Indices hold HYPE alongside the top one hundred tokens for broad exposure to leaders and emerging winners.
Our backtests indicate that owning the full market with diversified indices has historically outperformed both the total market and Bitcoin in many regimes due to diversification and rotation.
Hyperliquid is a decentralized exchange focused on perpetual futures with a high-performance order book architecture. The project emphasizes low-latency trading, risk controls, and capital efficiency aimed at professional and retail derivatives traders. Its token, HYPE, is used for ecosystem incentives and governance-related utilities.
Can HYPE reach $60?
Yes, the 23T and 31T tiers imply ranges above $60 in the Base and Moon bands, though outcomes depend on liquidity and adoption. Not financial advice.
Is HYPE a good long-term investment?
Outcome depends on adoption, liquidity regime, competition, and supply dynamics. Diversify and size positions responsibly.

Disclosure
Educational purposes only, not financial advice. Crypto is volatile, do your own research and manage risk.
Token Metrics delivers AI-based crypto ratings, scenario projections, and portfolio tools so you can make smarter decisions. Discover real-time analytics on Token Metrics.

The Layer 1 competitive landscape is consolidating as markets recognize that specialization matters more than being a generic "Ethereum killer." Cardano positions itself in this multi-chain world with specific technical and ecosystem advantages. Infrastructure maturity around custody, bridges, and developer tools makes alternative L1s more accessible heading into 2026.
The scenario projections below map different market share outcomes for ADA across varying total crypto market sizes. Base cases assume Cardano maintains current ecosystem momentum, while moon scenarios factor in accelerated adoption and bear cases reflect increased competitive pressure.
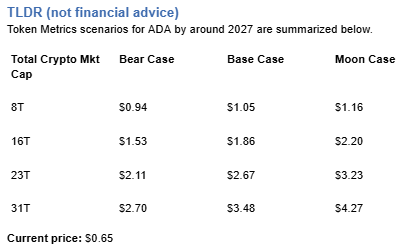
Disclosure
Educational purposes only, not financial advice. Crypto is volatile, do your own research and manage risk.
How to read it: Each band blends cycle analogues and market-cap share math with TA guardrails. Base assumes steady adoption and neutral or positive macro. Moon layers in a liquidity boom. Bear assumes muted flows and tighter liquidity.
TM Agent baseline: Token Metrics lead metric for Cardano, cashtag $ADA, is a TM Grade of 29.72%, which translates to a Sell, and the trading signal is bearish, indicating short-term downward momentum. This combination means Token Metrics does not currently endorse $ADA as a long-term buy at current levels. A brief market context: Bitcoin's direction remains the dominant macro driver for smart contract platforms, so sustained upside for $ADA would require a broader crypto risk-on regime and improving fundamentals or developer activity for Cardano.
Live details: Cardano Token Details
Affiliate Disclosure: We may earn a commission from qualifying purchases made via this link, at no extra cost to you.
Token Metrics scenarios span four market cap tiers, each representing different levels of crypto market maturity and liquidity:
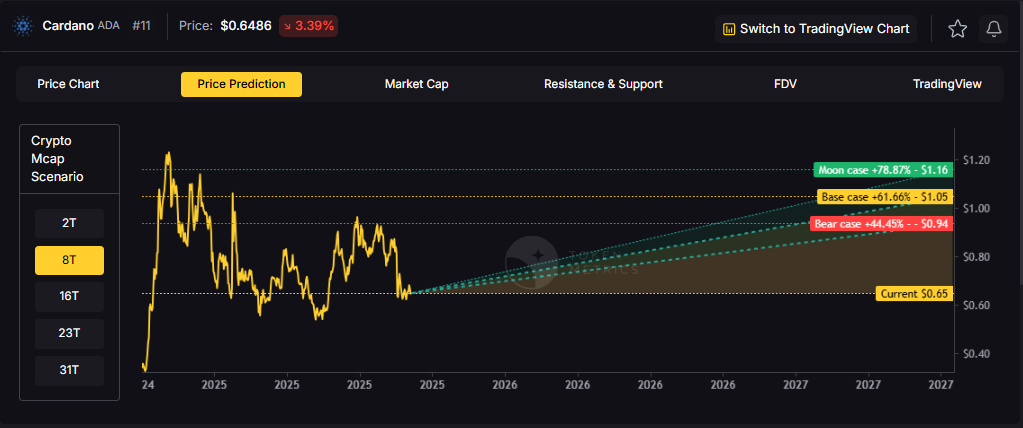
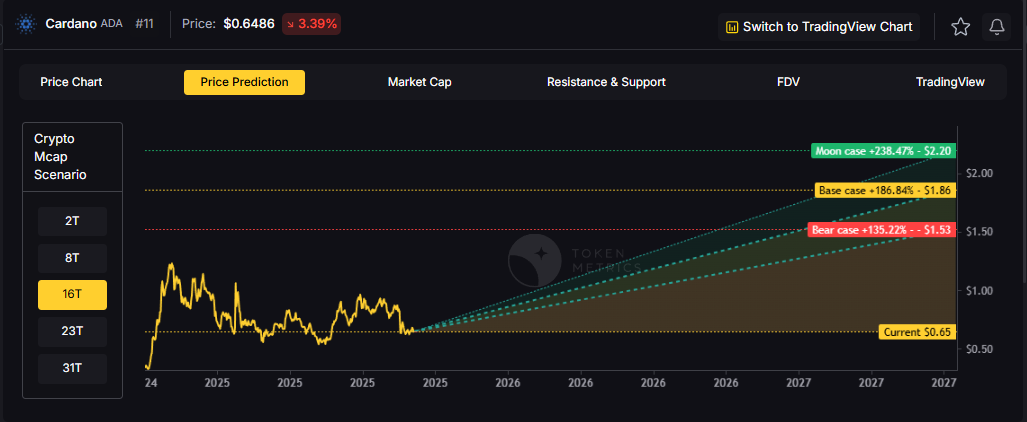


Each tier assumes progressively stronger market conditions, with the base case reflecting steady growth and the moon case requiring sustained bull market dynamics.
Cardano represents one opportunity among hundreds in crypto markets. Token Metrics Indices bundle ADA with top one hundred assets for systematic exposure to the strongest projects. Single tokens face idiosyncratic risks that diversified baskets mitigate.
Historical index performance demonstrates the value of systematic diversification versus concentrated positions.
Cardano is a blockchain platform designed to support secure, scalable, and sustainable decentralized applications and smart contracts. It is known for its research-driven development approach, emphasizing peer-reviewed academic research and formal verification methods to ensure reliability and security. As a proof-of-stake Layer 1 blockchain, Cardano aims to offer energy efficiency and long-term scalability, positioning itself as a competitor to platforms like Ethereum. Its native token, ADA, is used for transactions, staking, and governance. Adoption is driven by technological rigor and ecosystem growth, though progress has been criticized for being slow compared to more agile competitors. Risks include execution delays, competition, and market volatility.
Cardano’s vision is to create a decentralized platform that enables sustainable and inclusive economic systems through advanced cryptography and scientific methodology. It aims to bridge gaps between traditional financial systems and blockchain technology, promoting accessibility and security for users globally.
Token Metrics AI provides comprehensive context on Cardano's positioning and challenges.
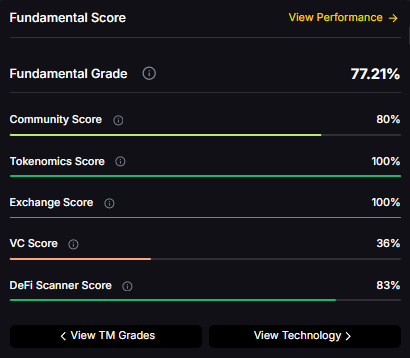
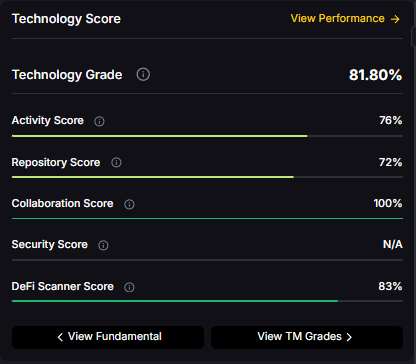
Can ADA reach $4?
Based on the scenarios, ADA could reach $4 in the 31T moon case. The 31T tier projects $4.27 in the moon case. Not financial advice.
Can ADA 10x from current levels?
At current price of $0.65, a 10x would reach $6.50. This falls within none of the provided scenarios, which top out at $4.27 in the 31T moon case. Bear in mind that 10x returns require substantial market cap expansion. Not financial advice.
What price could ADA reach in the moon case?
Moon case projections range from $1.16 at 8T to $4.27 at 31T. These scenarios assume maximum liquidity expansion and strong Cardano adoption. Not financial advice.
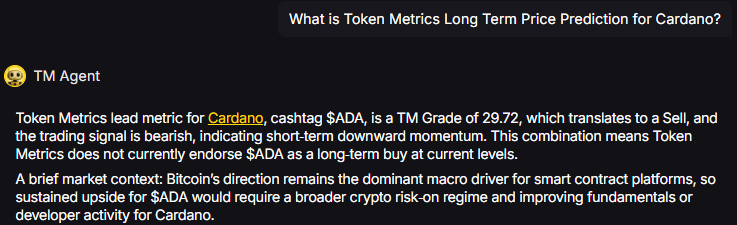
Disclosure
Educational purposes only, not financial advice. Crypto is volatile, do your own research and manage risk.


9450 SW Gemini Dr
PMB 59348
Beaverton, Oregon 97008-7105 US
.svg)


.png)
Token Metrics Media LLC is a regular publication of information, analysis, and commentary focused especially on blockchain technology and business, cryptocurrency, blockchain-based tokens, market trends, and trading strategies.
Token Metrics Media LLC does not provide individually tailored investment advice and does not take a subscriber’s or anyone’s personal circumstances into consideration when discussing investments; nor is Token Metrics Advisers LLC registered as an investment adviser or broker-dealer in any jurisdiction.
Information contained herein is not an offer or solicitation to buy, hold, or sell any security. The Token Metrics team has advised and invested in many blockchain companies. A complete list of their advisory roles and current holdings can be viewed here: https://tokenmetrics.com/disclosures.html/
Token Metrics Media LLC relies on information from various sources believed to be reliable, including clients and third parties, but cannot guarantee the accuracy and completeness of that information. Additionally, Token Metrics Media LLC does not provide tax advice, and investors are encouraged to consult with their personal tax advisors.
All investing involves risk, including the possible loss of money you invest, and past performance does not guarantee future performance. Ratings and price predictions are provided for informational and illustrative purposes, and may not reflect actual future performance.


%20Price%20Prediction%202025%2C%202030%20-%20Forecast%20Analysis.png)


.png)

%20Price%20Prediction%20.webp)


%20Price%20Prediction.webp)


%20Price%20Prediction%20Analysis%20-%20Can%20it%20Reach%20%24500%20in%20Future_.png)


