

.png)

.png)
.png)


.png)


.png)
.png)


.png)


.png)
%201%20(1).png)

.png)


.png)


.png)


.png)

.png)
.png)
.png)
.png)
.png)
.png)
.png)
.png)
.png)


.png)


.png)

.png)
.png)


.png)


.png)
.png)
.png)


Research
Top Crypto Trading Platforms in 2025
When it comes to crypto trading platforms, Token Metrics is not an exchange, but a crypto analytics and crypto trading intelligence platform powered by AI.
Token Metrics Team
10 min


%201.svg)
%201.svg)
Big news: We’re cranking up the heat on AI-driven crypto analytics with the launch of the Token Metrics API and our official SDK (Software Development Kit). This isn’t just an upgrade – it's a quantum leap, giving traders, hedge funds, developers, and institutions direct access to cutting-edge market intelligence, trading signals, and predictive analytics.
Crypto markets move fast, and having real-time, AI-powered insights can be the difference between catching the next big trend or getting left behind. Until now, traders and quants have been wrestling with scattered data, delayed reporting, and a lack of truly predictive analytics. Not anymore.
The Token Metrics API delivers 32+ high-performance endpoints packed with powerful AI-driven insights right into your lap, including:
Getting started with the Token Metrics API is simple:
At Token Metrics, we believe data should be decentralized, predictive, and actionable.
The Token Metrics API & SDK bring next-gen AI-powered crypto intelligence to anyone looking to trade smarter, build better, and stay ahead of the curve. With our official SDK, developers can plug these insights into their own trading bots, dashboards, and research tools – no need to reinvent the wheel.
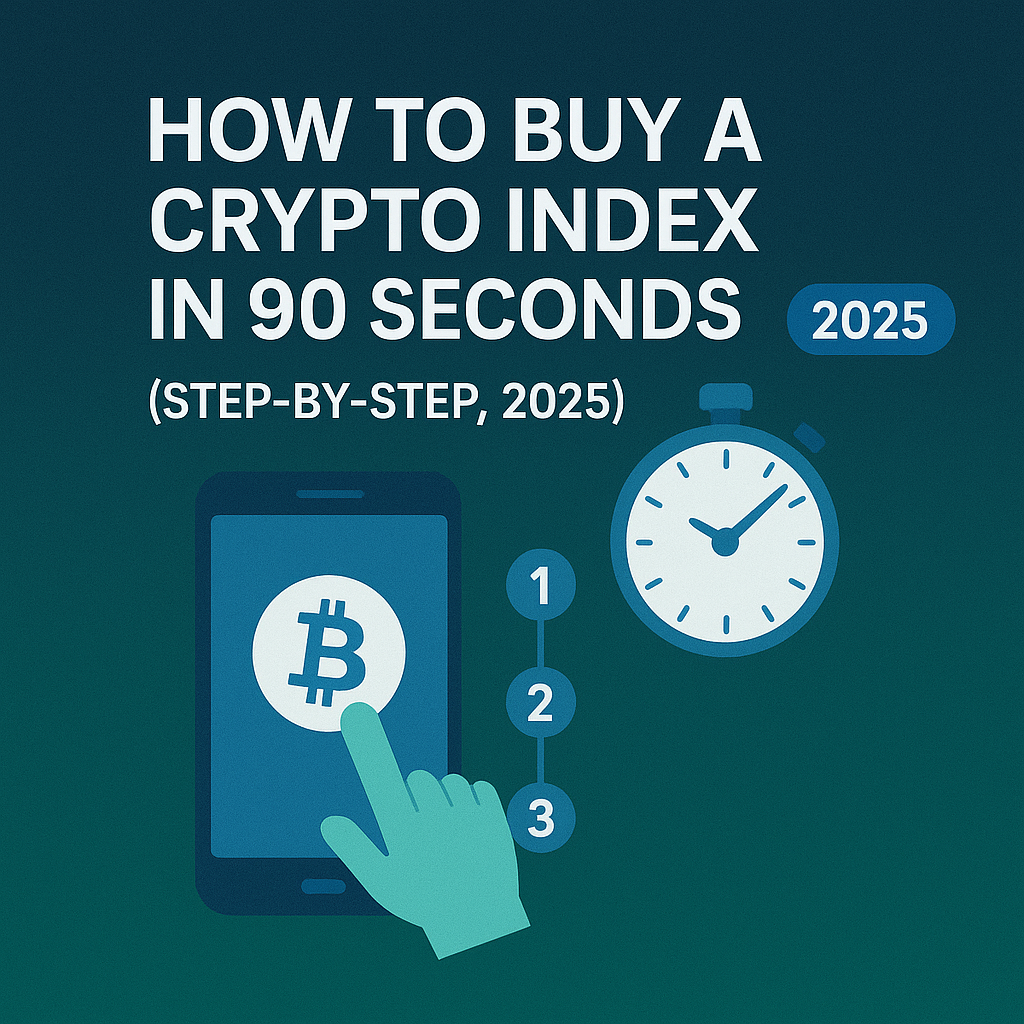
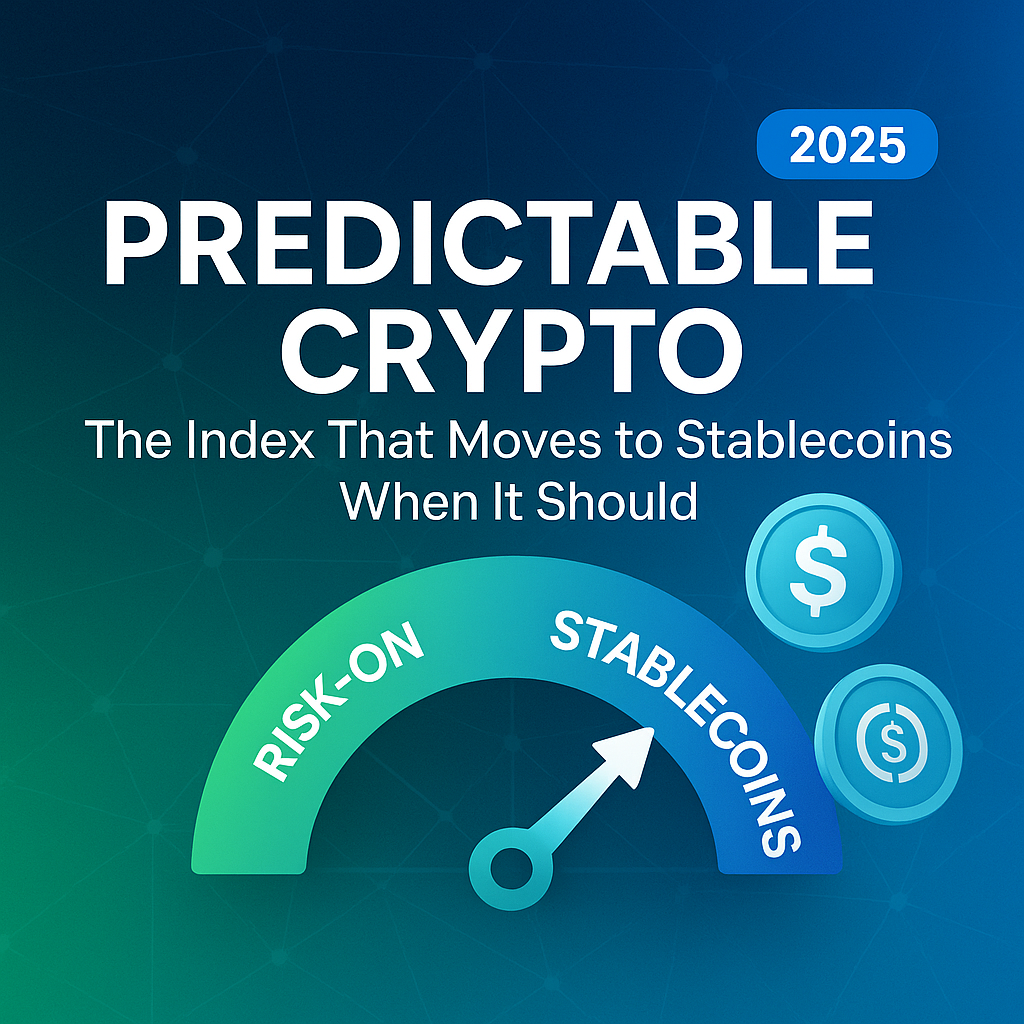
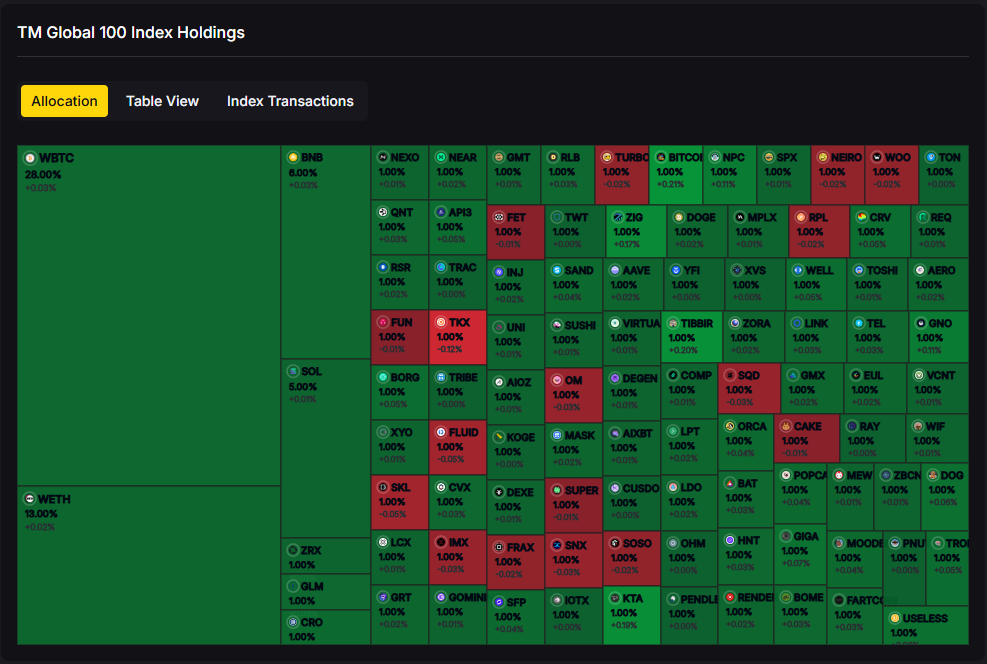
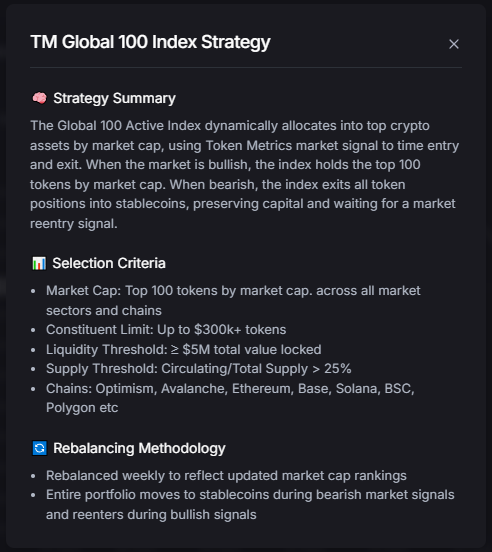
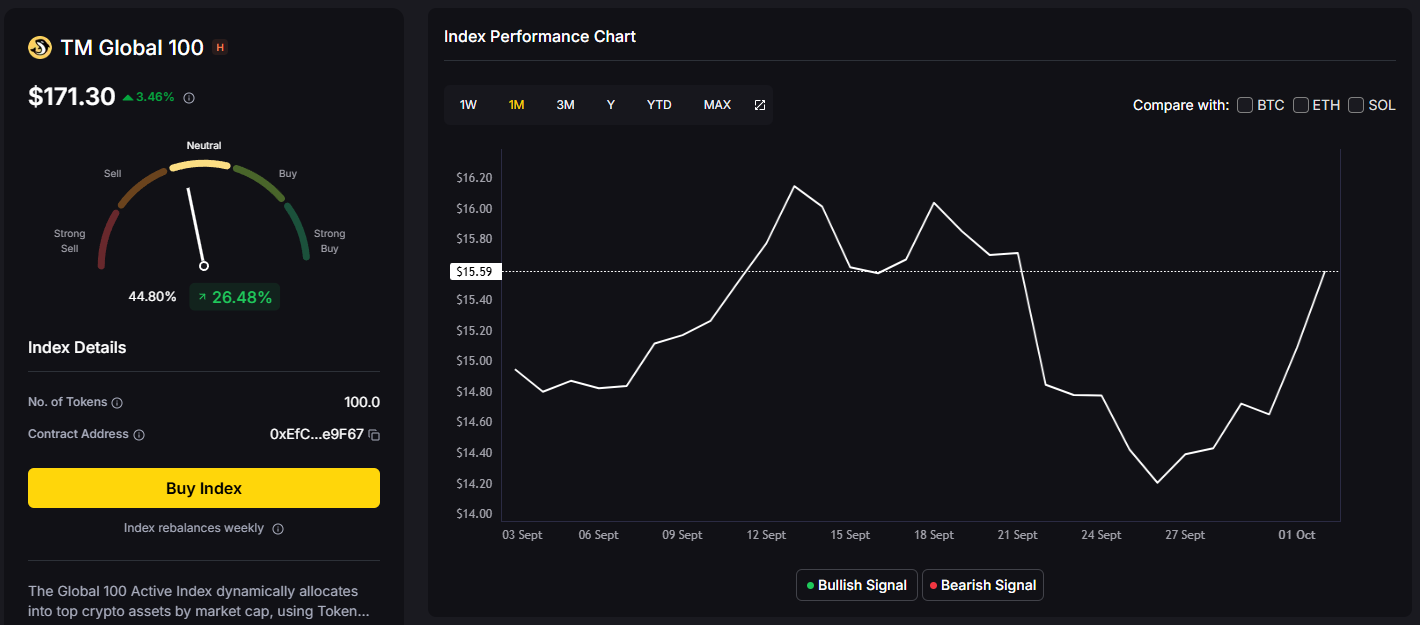
If you want broad crypto exposure without babysitting charts, a top crypto index is the simplest way to participate in the market. TM Global 100 was designed for hands-off portfolios: when conditions are bullish, the index holds the top 100 crypto assets by market cap; when signals turn bearish, it moves to stablecoins and waits. You get weekly rebalancing, transparent holdings and transaction logs, and a 90-second buy flow—so you can spend less time tinkering and more time compounding your life.
→ Join the waitlist to be first to trade TM Global 100.
Volatility is back, and investors are searching for predictable, rules-based ways to capture crypto upside without micromanaging tokens. Search interest for terms like hands-off crypto investing, weekly rebalancing, and regime switching reflects the same intent: “Give me broad exposure with guardrails.”
Definition (for snippets): A crypto index is a rules-based basket of digital assets that tracks a defined universe (e.g., top-100 by market cap) with a transparent methodology and scheduled rebalancing.
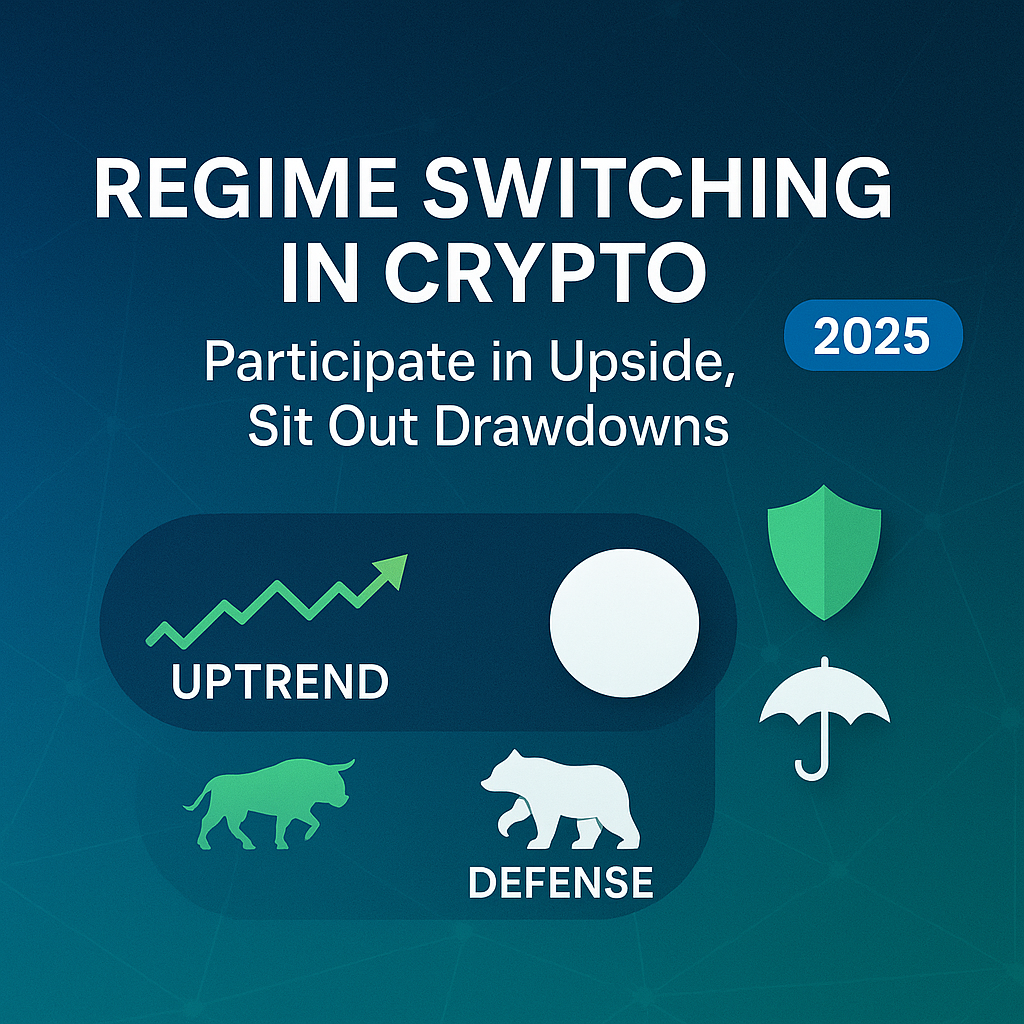
For 2025’s cycle, a top crypto index helps you participate in uptrends while a regime-switching rule can step aside during drawdowns—removing guesswork and FOMO from day-to-day decisions.
Soft CTA: See the strategy and rules.
→ Join the waitlist to be first to trade TM Global 100.
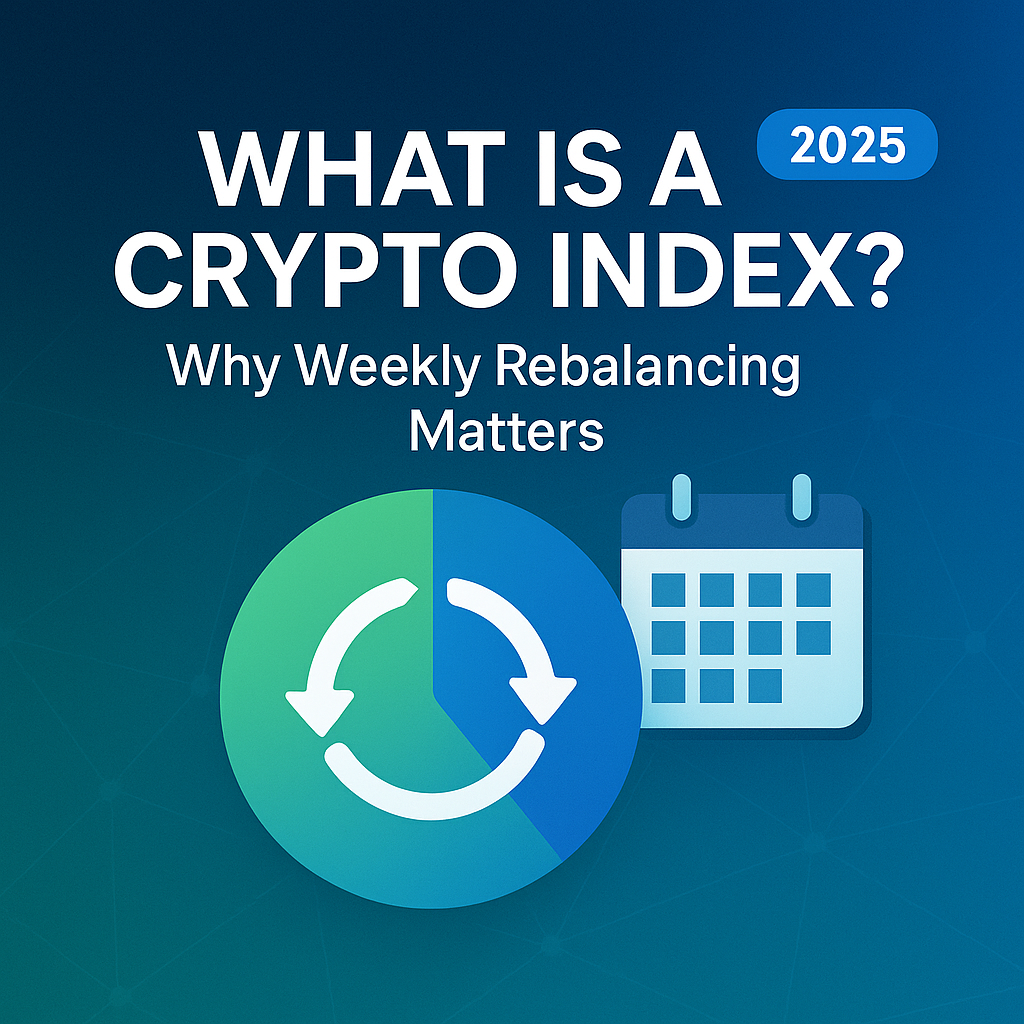
What is a top crypto index?
A rules-based basket that tracks a defined universe—here, the top 100 assets by market cap—with transparent methodology and scheduled rebalancing.
How often does the index rebalance?
Weekly. Regime switches (tokens ↔ stablecoins) can also occur when the market signal changes.
What triggers the move to stablecoins?
A proprietary market-regime signal. In bearish regimes, the index exits token positions to stablecoins and waits for a bullish re-entry signal.
Can I fund with USDC or fiat?
At launch, the embedded wallet will surface supported funding/settlement options based on your chain/wallet. USDC payout is supported when selling; additional on-ramps may follow.
Is the wallet custodial?
No. It’s an embedded, self-custodial smart wallet—you control the keys.
How are fees shown?
Before confirming, the buy flow shows estimated gas, platform fee, max slippage, and minimum expected value.
How do I join the waitlist?
Visit the Token Metrics Indices hub or the TM Global 100 strategy page and tap Join Waitlist.
Crypto is volatile and can lose value. Past performance is not indicative of future results. This article is for research/education, not financial advice.
If you want hands-off, rules-based exposure to crypto’s upside—with a stablecoin backstop in bears—TM Global 100 is built for you. See the strategy, join the waitlist, and be ready to allocate on launch.
Related Reads
If you’ve tried to “own the market” in crypto, you’ve felt the pain: chasing listings, juggling wallets, and missing rebalances while prices move. A top 100 crypto index aims to fix that—giving you broad exposure when the market is bullish and standing down when it’s not. TM Global 100 is our rules-based version of that idea: it holds the top-100 by market cap in bull regimes, moves to stablecoins in bear regimes, and rebalances weekly. You can see every rule, every holding, and every rebalance—then buy the index in ~90 seconds with an embedded on-chain flow.
→ Join the waitlist to be first to trade TM Global 100.
The market keeps cycling. New leaders emerge quickly. A “set-and-forget” bag can fall behind, while manual baskets burn hours and rack up slippage. Search interest for crypto index, regime switching, and weekly rebalancing keeps growing because people want a simple, disciplined core that adapts.
Definition (for featured snippets): A top 100 crypto index is a rules-based basket that tracks the largest 100 crypto assets by market cap, typically rebalanced on a schedule to keep weights aligned with the market.
In 2025, that alone isn’t enough. You also need discipline for downtrends. TM Global 100 adds a regime-switching layer to move to stablecoins during bear phases—so you can participate in upside and sit out major drawdowns with a consistent, rules-based approach.
Regime switching:
Weekly rebalancing:
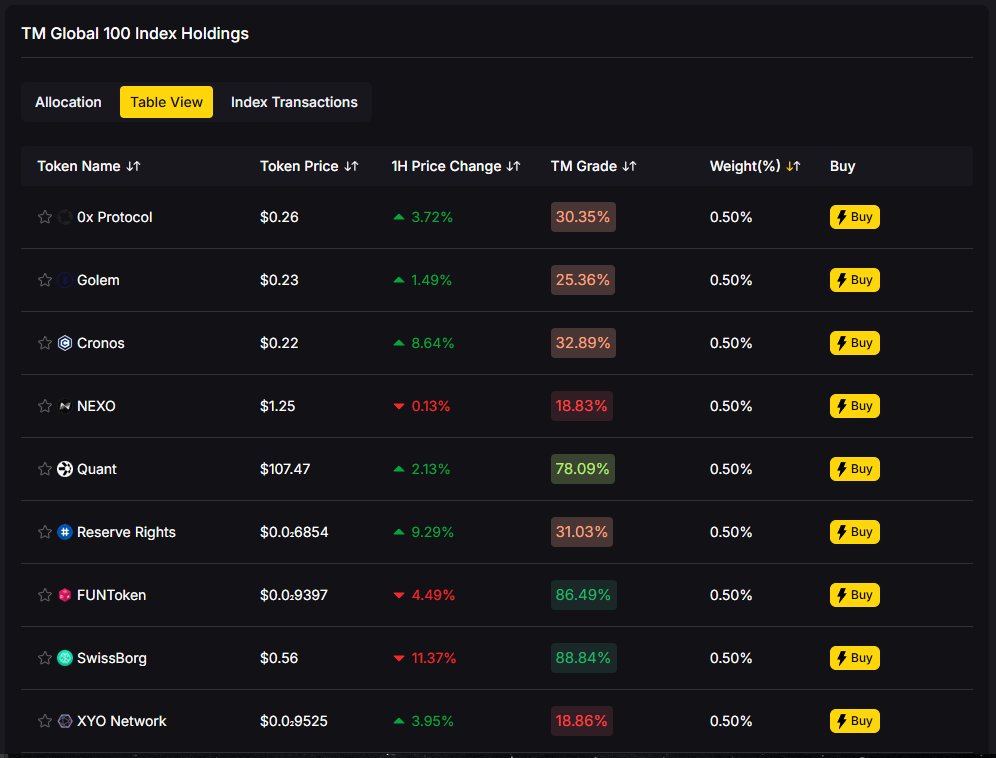
Transparency:
What you’ll see on launch:
Soft CTA: See the strategy and rules.
→ Join the waitlist to be first to trade TM Global 100.
What is a top 100 crypto index?
A rules-based basket tracking the largest 100 assets by market cap, typically with scheduled rebalancing. TM Global 100 adds regime switching to stablecoins during bear markets.
How often does the index rebalance?
Weekly. In addition, if the market signal flips, the entire portfolio may switch between tokens ↔ stablecoins outside the weekly cycle.
What triggers the move to stablecoins?
A proprietary market-regime signal. When it’s bearish, the index exits tokens to stablecoins and waits for a bullish re-entry signal.
Can I fund with USDC or fiat?
On launch, funding options surface based on your connected wallet and supported chains. USDC payouts are supported when selling.
Is the wallet custodial?
The embedded wallet is self-custodial—you control your funds.
How are fees shown?
Before you confirm a buy, you’ll see estimated gas, platform fee, max slippage, and minimum expected value—all up front.
How do I join the waitlist?
Go to the TM Global 100 page or the Indices hub and click Join Waitlist. You’ll get notified at launch with simple steps to buy.
Crypto is volatile and can lose value. Past performance is not indicative of future results. This article is for research/education, not financial advice.
A top 100 crypto index is the simplest path to broad market exposure—if it’s built with discipline. TM Global 100 combines transparent rules, weekly rebalancing, and a regime switch to stablecoins, so you can focus on your strategy while the core maintains itself.
Now’s the time to claim early access.
→ Join the waitlist to be first to trade TM Global 100.
Related Reads
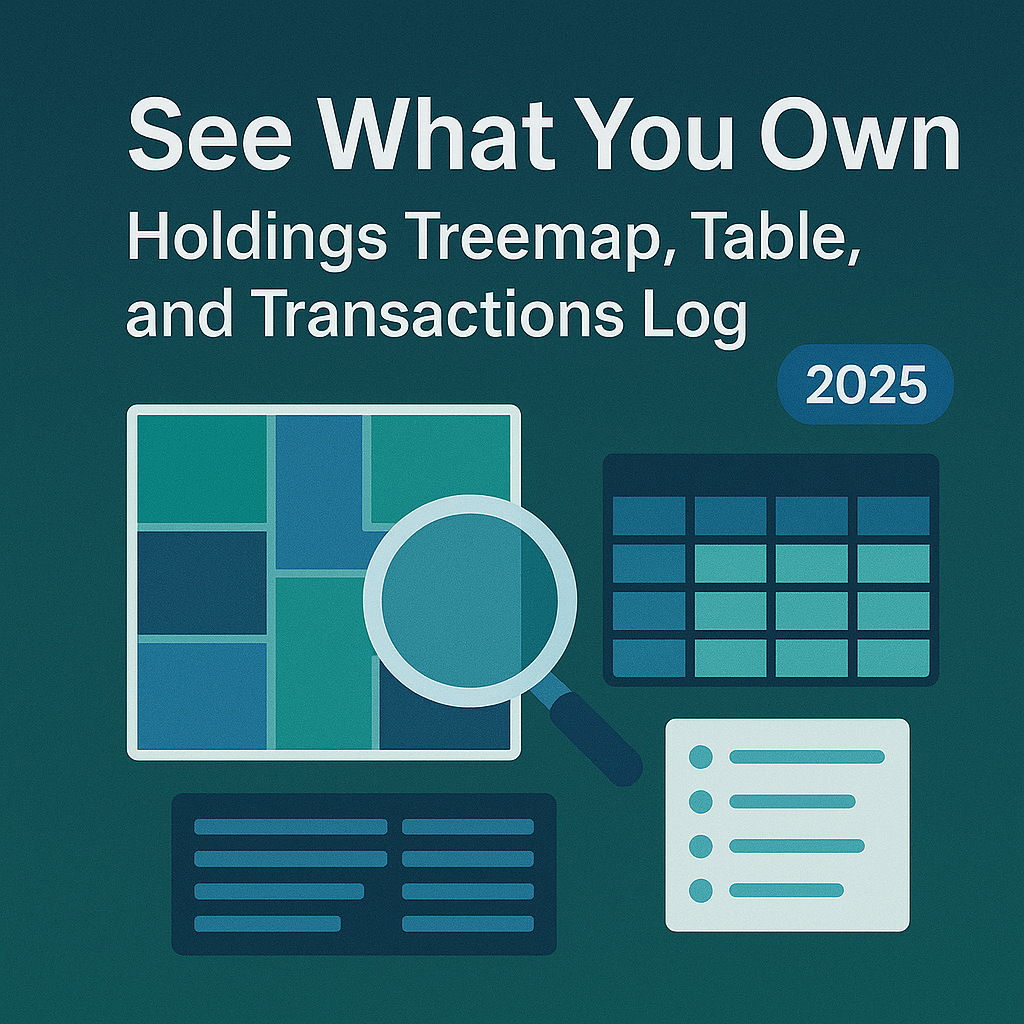
After a whipsaw year, many investors are asking how to stay exposed to crypto’s upside without riding every drawdown. Rules-based crypto indexing is a simple, disciplined answer: follow a transparent set of rules rather than gut feelings. The TM Global 100 puts this into practice—own the top-100 in bullish regimes, rotate to stablecoins in bearish regimes, and rebalance weekly. On top of that, you can see what you own in real time with a Holdings Treemap, Table, and Transactions Log. Less second-guessing, more process.
→ Join the waitlist to be first to trade TM Global 100.
What it is: A rules-based index that holds the top-100 in bull markets and moves to stablecoins in bear markets—paired with transparent holdings and transaction logs.
Why it matters: Weekly rebalances and clear regime logic bring structure after volatile cycles.
Who it’s for: Hands-off allocators and active traders who want a disciplined core with visibility.
Next step: Join the waitlist to be first to trade TM Global 100.
In a volatile cycle, emotion creeps in: chasing winners late, cutting losers early, or missing re-entry after fear. Rules-based crypto indexing applies consistent criteria—constituent selection, weighting, and rebalancing—so you don’t have to improvise in stress.
For readers comparing crypto index options, think of it as a codified playbook. A rules-based crypto index is a methodology-driven basket that follows predefined signals (e.g., market regime) and maintenance schedules (e.g., weekly rebalancing), aiming for repeatable behavior across cycles.
Featured snippet definition: Rules-based crypto indexing is a systematic approach that tracks a defined universe (e.g., top-100 by market cap) and maintains it on a fixed cadence, with explicit rules for when to hold tokens and when to de-risk into stablecoins.
See the strategy and rules. (TM Global 100 strategy)
→ Join the waitlist to be first to trade TM Global 100.
What is a rules-based crypto index?
A methodology-driven basket that follows predefined rules for asset selection, weighting, and maintenance. In TM Global 100, that means top-100 exposure in bullish regimes and stablecoins in bearish regimes, with weekly rebalancing and full transparency.
How often does the index rebalance?
Weekly. This cadence refreshes constituents and weights to align with current market-cap rankings; separate regime switches can move between tokens and stablecoins.
What triggers the move to stablecoins?
A documented market signal. When it turns bearish, the index exits to stablecoins; when bullish resumes, it re-enters the top-100 basket.
Can I fund with USDC or fiat?
Funding options will surface based on your connected wallet and supported rails. USDC settlement on sells is supported; fiat on-ramps may be added over time.
Is the wallet custodial?
No. The embedded wallet is self-custodial—you control your keys and assets.
How are fees shown?
Before confirming a trade, you’ll see estimated gas, platform fee, max slippage, and min expected value—so you can proceed with clarity.
How do I join the waitlist?
Go to the Indices hub, open TM Global 100, and enter your email. You’ll receive a launch-day link to buy.
After a volatile cycle, the edge is process. TM Global 100 combines rules-based crypto indexing, weekly rebalancing, and full transparency so you can participate in upside and step aside during bears—without running your own spreadsheets. If that’s the core you’ve been missing, join the waitlist now.
Related Reads:
%20Price%20Prediction%202025_%20Can%20ADA%20Break%20%241.50%20This%20Bull%20Cycle_.png)
As of July 12, 2025, Cardano (ADA) is showing renewed strength, climbing toward the critical $0.75 resistance level as Bitcoin soars above $112,000. After months of consolidation, the smart contract platform is gaining attention from investors, driven by key upgrades, growing DeFi activity, and a broader crypto bull market.
But can ADA reclaim the $1.00 milestone—or even surge beyond $1.50—by the end of the year?
In this highly informative and SEO-optimized article, we’ll explore Cardano’s 2025 price outlook, fundamental drivers, potential risks, and how Token Metrics’ AI tools can help you make smarter, data-backed investment decisions.

The Plomin Hard Fork, implemented in Q1 2025, marked a turning point in Cardano’s evolution. It introduced:
This governance upgrade enhanced Cardano’s appeal to long-term investors and DeFi developers by aligning protocol evolution with community consensus.
Cardano’s DeFi ecosystem is gaining traction, with Total Value Locked (TVL) increasing by 21% since April. Leading protocols like Minswap, Indigo, and LiQwid have seen significant upticks in user activity and liquidity.
This growth signals:
Cardano could soon integrate Ripple’s newly launched $RLUSD stablecoin, offering:
Stablecoin adoption is a key growth driver for any Layer-1 network aiming to scale its DeFi infrastructure.
Cardano has attracted $73 million in institutional inflows in 2025 so far, according to data from leading asset managers. This shows:
With a 75% probability of ETF approval, institutional demand could surge further in Q4.
Analysts and machine learning models—including those from Token Metrics—project a bullish range for ADA in 2025, depending on technical and macroeconomic conditions.

Breakout Level to Watch: $0.80
Support to Hold: $0.62
Despite bullish fundamentals, Cardano still faces several challenges that could cap or delay price gains:
With only 30,000 daily active addresses, Cardano still lags behind competitors like:
Low user activity may:
Cardano must compete with:
ADA needs to differentiate itself with real-world adoption and enterprise use cases.
Even in a bull market, sharp corrections happen. ADA could:
In crypto’s high-volatility environment, AI-driven research tools are essential. Token Metrics empowers ADA investors with real-time signals, grades, and analytics to stay ahead of the market.
Token Metrics' machine learning models forecast ADA’s short- and long-term price movements based on:

These forecasts update in real time as market conditions evolve.
Grades are updated daily, providing clarity even during volatile market swings.
Token Metrics issues real-time bullish and bearish signals on ADA, helping users:
Each signal is backed by over 80 on-chain and technical data points.

ADA’s dedicated page includes:
It’s a comprehensive research hub for Cardano investors.
Set up personalized alerts for ADA based on:
Receive alerts via email, Discord, Telegram, or Slack, keeping you informed 24/7.
If ADA cannot break above $0.80, it may retrace toward:
In that case, investors should:
Cardano is making meaningful strides:
If these trends continue and Bitcoin remains in a bull cycle, ADA could reach $1.10–$1.65 by year-end.
However, investors should stay cautious of competition, user activity metrics, and potential volatility.
With Token Metrics, you can:
Ready to take advantage of Cardano’s potential?
👉 Visit tokenmetrics.com
🚀 Access AI price predictions, moonshot opportunities, and real-time signals
📲 Set custom alerts so you never miss a breakout
%20Price%20Prediction%202025_%20Will%20XRP%20Hit%20%2410%20This%20Bull%20Cycle_.png)
Ripple’s native token, XRP, is experiencing renewed momentum in 2025, surging to $2.58 and breaking the long-standing $2.50 resistance level. This price movement coincides with Bitcoin's rally past $112,000, signaling that XRP is riding the current bull market wave.
But what’s driving this surge in XRP? Is it sustainable? And could we see XRP hit $5, $7—or even $10—before the end of 2025?

In this highly informative and SEO-optimized blog post, we analyze the factors behind XRP’s rise, evaluate its future potential, and explain why Token Metrics’ AI-powered price prediction tools offer unmatched insights for crypto investors.
In July 2025, XRP’s breakout above $2.50 marks one of its strongest price performances since the 2017 bull run. Key drivers behind this bullish trend include:
Ripple finalized its years-long lawsuit with the U.S. Securities and Exchange Commission (SEC) by paying a $50 million settlement—without admitting XRP is a security. This outcome:
With the lawsuit resolved, XRP is now eligible for listings, ETF consideration, and greater adoption in regulated financial environments.
Ripple has successfully launched RLUSD, its native stablecoin backed 1:1 by U.S. dollars. RLUSD provides:
This ecosystem expansion strengthens Ripple’s value proposition and increases XRP utility and demand.
With Ethereum and Bitcoin ETFs already active, XRP is next in line. Analysts estimate:
ETF listings would make XRP easily accessible in retirement accounts, financial advisors’ portfolios, and wealth management platforms—further legitimizing the asset.
Ripple now boasts partnerships with 300+ financial institutions, including:
This positions XRP as a global standard for cross-border payments—a market worth $150+ trillion annually.
Analysts and AI models predict a strong upside potential for XRP during this bull cycle. Here's a breakdown of possible scenarios:

Breakout Level to Watch: $3.40
Support Level: $2.10
Despite the bullish momentum, XRP still faces several risks:
Although the SEC case is resolved, Ripple faces:
RLUSD must compete with:
Failure to achieve rapid RLUSD adoption could cap XRP's growth potential.
After explosive gains, whales may lock in profits, causing sharp pullbacks. Key support at $2.10 must hold to maintain bullish structure.
In a fast-moving market, investors need real-time, data-driven predictions—not guesswork. Token Metrics offers the most advanced tools for XRP investors.
Token Metrics uses machine learning models trained on years of crypto market data to generate high-accuracy price forecasts.
For XRP, these models consider:
The result? A forward-looking price forecast you can trust.
The Token Metrics platform issues real-time bullish or bearish signals based on:
These signals help you:
Token Metrics assigns every token—including XRP—a:
Both are AI-calculated using 80+ metrics, and they update daily. This helps you:
With Token Metrics, you can set personalized alerts for XRP:
Alerts are delivered via email, Slack, Telegram, or Discord—so you never miss a key movement.

The XRP profile page on Token Metrics provides:
Everything you need for informed XRP investing in one place.
While many altcoins are chasing narratives (AI, memecoins, DePIN), XRP’s case is fundamentally driven by:
Token Metrics’ crypto indices help investors diversify by creating thematic portfolios (e.g., “Institutional Adoption,” “Layer-1 Networks,” “Cross-Border Payments”)—with XRP often at the top of the cross-border category.

Corrections are part of every bull market. If XRP fails to hold above $2.50:
Use Token Metrics’ bearish signal alerts to de-risk in real time.
With legal clarity, a new stablecoin, ETF approval potential, and over 300 institutional partnerships, Ripple and XRP are in their strongest position in years.
If Bitcoin continues its uptrend and XRP breaks above $3.40, the next major rally could take it to $5–$10 by the end of 2025.
But success depends on regulatory support, stablecoin adoption, and institutional inflows—all factors Token Metrics tracks daily with precision.
👉 Start now at tokenmetrics.com and gain an edge in XRP trading and investing

Ethereum is once again at the center of attention in the crypto market. With its price surging past $3,000 and Bitcoin breaking above $112,000, many analysts now believe ETH could reach $5,000–$10,000 before the end of 2025.

This renewed momentum is backed by strong technical upgrades, institutional demand, and a thriving decentralized finance (DeFi) ecosystem. But can Ethereum overcome its challenges and hit a new all-time high? In this highly informative and SEO-optimized article, we’ll break down Ethereum’s 2025 price outlook—and show how Token Metrics’ AI-powered tools help investors track key price signals, monitor risk, and discover hidden opportunities.
Ethereum’s bullish breakout above $3,000 signals strong investor confidence. Several catalysts are driving this uptrend:

Ethereum’s highly anticipated Pectra upgrade is designed to improve scalability and transaction throughput. This upgrade will:
This scalability boost is expected to attract more developers, dApps, and users, further increasing demand for ETH.
Ethereum ETFs are gaining traction, with $12 billion in assets under management (AUM) as of July 2025. Major asset managers like Fidelity, BlackRock, and VanEck have brought ETH exposure to traditional finance.
These ETFs are:
Ethereum is now firmly on the radar of pension funds, family offices, and sovereign wealth funds.
Ethereum remains the undisputed leader in decentralized finance. As of July 2025:
Layer-2s help reduce fees, increase speed, and unlock new user growth. They are essential for Ethereum to scale while maintaining security.
With strong fundamentals, investor demand, and bullish momentum, here’s what analysts are forecasting:

Key breakout level to watch: $4,000
Key support level: $2,500
Despite bullish catalysts, Ethereum faces several potential headwinds that could slow or stall price growth:
Blockchains like Solana, Aptos, and Sui offer high-speed, low-cost alternatives. They continue to attract developers and DeFi projects due to:
Ethereum’s dominance could erode if it fails to keep pace with these innovations.
When usage surges, Ethereum gas fees can spike, pricing out retail users. This could limit dApp usage and reduce ETH demand during key moments in the bull cycle.
Though the U.S. has become more crypto-friendly, some regions still lack clear ETH guidance. New regulations affecting:
…could introduce market volatility.
In a market as fast-moving as crypto, investors need tools that offer real-time insights and predictive analytics. That’s where Token Metrics shines.
Token Metrics uses machine learning to forecast Ethereum’s short- and long-term price targets based on:
Its Ethereum model is continuously updated, adapting to market changes in real time.
These grades allow users to track Ethereum’s strength against thousands of other tokens.
Token Metrics issues daily buy/sell signals on Ethereum, helping users:
These signals are backed by AI algorithms that consider:
Set Ethereum alerts by:
Get alerts via email, Telegram, Discord, or Slack—so you never miss a trade.
Get all key ETH metrics in one place:
All powered by Token Metrics’ AI research engine.
To forecast Ethereum demand, investors should track:
Token Metrics includes Layer-2 project ratings and staking-related altcoin analysis for advanced users.
While $5,000–$10,000 is possible, ETH could face a correction if:
In that case, ETH could fall back to $2,500–$2,800, a key demand zone.
Token Metrics’ alerts and AI models help users manage risk and spot early trend reversals.
Ethereum has everything going for it in 2025:
If macro conditions remain favorable and Bitcoin sustains its rally, Ethereum could realistically test $10,000 before the end of the year.
But crypto markets remain volatile. Investors should use AI tools like Token Metrics to:
Ready to invest in Ethereum smarter?
👉 Sign up today at tokenmetrics.com and level up your crypto research game.

Cryptocurrency trading continues to evolve rapidly in 2025, driven by the rise of AI, automation, and real-time analytics. Choosing the right platform is critical to your success as a trader or investor. In this comprehensive guide, we’ll explore the top 5 crypto trading platforms in July 2025, explain what crypto trading is, discuss its different types, and show why Token Metrics stands out as the best AI-powered analytics and moonshot discovery platform.
Crypto trading involves buying and selling cryptocurrencies like Bitcoin (BTC), Ethereum (ETH), and thousands of altcoins on digital platforms to make a profit. Traders capitalize on price fluctuations by entering positions in the market—either manually or using automation.
Unlike traditional stock trading, crypto trading is:
There are several crypto trading strategies and approaches depending on your goals, risk tolerance, and available tools:
Buying and selling actual cryptocurrencies at current market prices. It’s simple and widely used by beginners.
Using borrowed funds to increase exposure. This amplifies gains but also increases risk.
Traders speculate on future prices using products like futures and options without owning the underlying assets.
A short-term strategy that aims to profit from small price movements—often requiring advanced bots or tools.
Holding a position for several days or weeks to capitalize on medium-term trends.
Using algorithms or AI to execute trades based on predefined strategies or signals.
Mimicking the trades of successful traders through social platforms.
Here are the best platforms based on performance, tools, security, and innovation:

Website: tokenmetrics.com
Token Metrics is not a traditional exchange but a powerful AI-driven analytics and trading platform. It helps users discover high-potential tokens, evaluate them using real-time data, and automate smarter trades.
Token Metrics empowers retail traders and institutional investors with AI precision, data transparency, and deep insights that traditional platforms simply don’t offer.
Why It Stands Out: No other platform blends AI-driven analytics, moonshot discovery, and real-time alerts with developer tools at this scale. It’s ideal for both hands-on traders and automated trading systems.

Website: binance.com
Binance is the largest centralized exchange by volume and offers extensive spot, margin, and futures trading. It supports hundreds of tokens and provides access to a robust launchpad, NFT marketplace, and staking.
Best For: Professional traders seeking high liquidity and advanced tools.

Website: coinbase.com
Coinbase is the go-to platform for beginners and U.S. traders. It provides an intuitive interface, secure storage, and educational resources.
Best For: Beginners and passive investors in regulated regions.

Website: kraken.com
Kraken is known for its strong security protocols and staking services. It offers spot, margin, and futures trading with a reputation for transparency.
Best For: Traders prioritizing security and staking rewards.

Website: bitget.com
Bitget is gaining popularity for its copy trading features and derivatives market. It allows users to replicate the trades of successful investors automatically.
Best For: Passive traders and futures enthusiasts.
While exchanges like Binance and Coinbase focus on execution, Token Metrics gives you the intelligence to know what to trade and when. Its AI-powered platform serves as the brain behind your trades—scanning thousands of tokens daily and distilling actionable insights in real time.
Whether you want to:
…Token Metrics is the most powerful analytics and trading assistant available in 2025.
Choosing the best crypto trading platform depends on your trading style and goals. For execution, Binance and Coinbase remain strong contenders. But if you're looking to gain an unfair advantage through AI, automate your workflow, and catch the next 10x altcoin before the crowd, Token Metrics is unmatched.
As AI continues to reshape crypto in 2025, platforms like Token Metrics will become the go-to infrastructure for intelligent investing. Don’t just trade crypto—trade with insight.

In the world of crypto, everyone dreams of discovering the next moonshot—that early-stage altcoin with the potential to deliver 10x, 50x, or even 100x returns. But finding the right token is only half the battle. The real key to success lies in your trading strategy—knowing when to buy, when to hold, and when to sell.
In this highly informative and SEO-optimized guide, we'll walk you through a proven crypto moonshot trading strategy using AI-powered buy/sell signals, real-time metrics, and automated tools. Whether you're a beginner or an experienced trader, this guide will help you maximize profits and reduce risks in 2025’s volatile crypto markets.
A crypto moonshot is an early-stage cryptocurrency with high upside potential—typically characterized by:
Moonshots are not just about luck—they require precise timing, data-driven decisions, and a disciplined trading strategy.
While moonshots offer huge potential returns, they also come with extreme volatility. Without a clear entry and exit strategy, traders risk:
That’s why successful moonshot trading is all about executing at the right moment, based on real-time buy and sell signals.
Buy/sell signals are automated indicators based on technical analysis, AI modeling, and data trends. When applied to moonshots, they help traders:
Token Metrics—one of the top AI crypto analytics platforms in 2025—offers integrated buy/sell signals as part of its Moonshots feature.
Token Metrics uses artificial intelligence to monitor over 6,000 tokens and identify daily Moonshots—early-stage tokens with exceptional upside potential. Each token is scored using over 80 data points, including:
The platform then issues Bullish (buy) and Bearish (sell) signals to help traders time their entries and exits more precisely.
Here’s a structured approach to building a winning moonshot trading strategy using Token Metrics:

✅ Pro Tip: Combine Bullish signals with a recent Moonshot entry (within the past 3 days) for the best short-term upside potential.
Token Metrics continuously analyzes live data. If momentum starts to fade, the platform may issue a Bearish Signal, suggesting it's time to exit.
There are two ways to exit your moonshot trade:
✅ Pro Tip: Combine both methods—sell early if a Bearish Signal appears, or scale out using a profit-taking ladder.
Even with powerful tools, moonshot trading is high-risk. Follow these tips to protect your capital:
Never go all-in on a single Moonshot. Spread your bets across multiple tokens to increase your odds of success.
Set a stop loss between 20%–30% below your entry price to prevent major drawdowns.
Use Token Metrics’ Past Moonshots view to study which tokens succeeded and what signals preceded them.
Use custom alerts to get notified when:
Token Metrics integrates with:
In 2025, crypto markets are more efficient than ever. Random guessing and influencer hype don’t cut it anymore.
To win, you need:
✅ Smart discovery
✅ Timely entries
✅ Strategic exits
✅ Reliable signals
With Token Metrics Moonshots and AI-powered buy/sell signals, you get the full toolkit to trade early-stage altcoins with confidence. It’s the edge every trader needs in the age of intelligent automation.
🧠 Trade smarter, not harder

In both tech and investing, the term “moonshot” has become a buzzword. But what does it really mean—especially in the world of cryptocurrency? In 2025, where crypto markets move faster than ever and fortunes are made in weeks, understanding what a moonshot is—and how to spot one—can be the difference between average returns and life-changing gains.
In this guide, we’ll explore what a moonshot is, where the term originated, how it applies to crypto, and how platforms like Token Metrics are using AI to identify real moonshot opportunities before they go mainstream.
At its core, a moonshot refers to a bold, ambitious goal or project that aims for massive success—despite high risk and low probability. The term comes from the U.S. Apollo missions, which set out to put a man on the moon in the 1960s—a seemingly impossible goal at the time.
In the tech world, “moonshot” often describes breakthrough innovations with radical upside potential, like:
In crypto, a moonshot is an early-stage altcoin with the potential for 10x, 50x, or even 100x returns—if discovered before the crowd.
A crypto moonshot is a low-cap cryptocurrency project that has strong fundamentals, an emerging narrative, or technical signals that suggest it could deliver explosive gains in a short timeframe.
These tokens are usually:
But moonshots come with high risk. For every 100x winner, there are dozens of tokens that go to zero. That’s why smart investors use data, not hype, to find real opportunities.
With moonshots, you risk $100 for the chance to earn $10,000. That level of upside doesn’t exist in traditional markets.
You don’t need millions to win big. Moonshots give retail traders a fighting chance to outperform institutions—if they find the token early enough.
Moonshot tokens often represent the bleeding edge of blockchain innovation—from decentralized AI to tokenized real-world assets.
Despite the massive upside, most traders miss the real moonshots and end up buying the hype too late.
Why?
This is why platforms like Token Metrics are changing the game.
Token Metrics is an AI-powered crypto analytics and trading platform that includes a dedicated Moonshots feature—designed to help users find early-stage altcoins before they pump.
You don’t have to guess. The platform’s AI analyzes thousands of tokens daily and surfaces a curated list of Moonshots based on data—not hype.
From your Token Metrics dashboard, click on the Ratings tab to access AI scores for thousands of tokens.
Inside Ratings, select the Moonshots tab to view tokens with the highest potential based on current trends.
Each Moonshot includes:
You can also explore Past Moonshots to verify previous performance.
Click a token to open its full details page—real-time chart, top holders, fundamental analysis, exchange listings, and more.
Click the Buy button to use the integrated swap widget for direct on-chain purchases—no need to leave the platform.
Yes—if you use the right tools.
Moonshots are not meme coins or influencer pumps. A legitimate moonshot is backed by data, momentum, and real fundamentals.
With Token Metrics, you can:
In short: Moonshots are legit if they’re backed by research—not hype.
The crypto landscape is becoming more competitive every day. Gone are the days when you could randomly buy a new token and expect 10x returns.
In 2025, traders need smart tools, real data, and automated insights to stay ahead of the curve.
That’s where Moonshots come in.
They represent the cutting edge of early-stage discovery—where small bets can lead to massive wins. And with platforms like Token Metrics leading the charge, moonshot investing is becoming smarter, faster, and more accessible than ever before.

In 2025, crypto markets are more competitive—and more crowded—than ever. Thousands of tokens launch every month, and most vanish into obscurity. But every now and then, a hidden gem explodes, delivering 10x, 50x, or even 100x returns to early investors.
These rare, high-upside tokens are called moonshots.
In this article, we’ll break down what moonshot crypto really means, why it matters, and how you can discover legit moonshot opportunities using Token Metrics, the leading AI-powered crypto analytics platform.
A moonshot in the crypto world refers to a low-market-cap altcoin that has the potential to rise exponentially in value. The term is derived from the phrase “shooting to the moon,” symbolizing massive growth in a short time.
Moonshots aren’t guaranteed winners. They’re high-risk, high-reward opportunities—but for savvy investors, they can be game-changers.
In traditional markets, consistent 2x or 3x returns are considered extraordinary. In crypto, however, early access to the right token can yield 100x+ returns in a matter of weeks.
Moonshots are especially important because:
The challenge? Finding these tokens before the crowd does. That’s where Token Metrics comes in.
Token Metrics Moonshots is a proprietary feature that uses artificial intelligence to scan the entire crypto market and identify high-potential altcoins before they go viral.
Instead of relying on social media hype or guessing based on charts, Token Metrics analyzes over 80+ data points per token, including:
The AI then surfaces a curated list of Moonshot tokens that show early signals of explosive growth.
Here’s a step-by-step guide to accessing and using the Moonshots feature on Token Metrics:
For each Moonshot token, Token Metrics shows:
Want to verify the results? Switch to Past Moonshots to see performance over 7 or 14 days.
Let’s address the elephant in the room: Is Moonshot crypto real, or just marketing hype?
Here’s why Moonshots are not only legit—but one of the most powerful trading tools in the crypto space:
Not all low-cap coins are Moonshots.

Looking for early entries into next-gen altcoins
Seeking data-backed portfolio diversification
Exploring new sectors like RWA, AI, Gaming, or Layer 2
Using Token Metrics API to integrate Moonshot data into dashboards, bots, or research workflows
With the Token Metrics API and MCP Server, developers can access Moonshot data in real time using:
Build AI crypto trading agents, compliance dashboards, or custom alerts with a single unified key and protocol. Start free at
👉 https://app.tokenmetrics.com/en/api
In 2025, finding alpha in crypto requires more than luck or hype—it requires precision, speed, and data-driven tools.
Token Metrics Moonshots is one of the only legit, AI-powered solutions that lets retail and institutional traders alike discover early-stage crypto projects before they go parabolic.
So, what is Moonshot crypto?
It’s not a meme. It’s a method.
.png)
Cryptocurrency continues to redefine global finance, and in 2025, more investors than ever are looking to tap into the opportunities it offers. But with over 20,000+ tokens in the market and extreme volatility, investing in crypto isn’t as simple as “buy and hold.” To succeed, you need a strategy powered by real-time data, AI analytics, and smart risk management.
That’s where Token Metrics comes in. This AI-powered crypto research and investment platform helps investors make data-backed decisions with confidence. In this guide, we’ll walk you through how to invest in cryptocurrency step-by-step—using Token Metrics’ powerful AI tools.
Cryptocurrency investing involves allocating capital into digital assets like Bitcoin, Ethereum, or altcoins with the goal of generating long-term returns. Unlike traditional investing, crypto markets are:
To succeed, you need more than luck—you need data, insights, and tools that give you an edge.
Before investing, understand the basics:
Token Metrics offers research pages, video tutorials, and AI-generated insights to help you get up to speed quickly.
There are several ways to invest in crypto:
Token Metrics scans 6,000+ tokens daily and gives each one a score based on:


Once you’ve identified the tokens you want to invest in, it’s time to create a diversified crypto portfolio. Here’s how:
Token Metrics offers AI-generated portfolios and model indices to help you follow proven allocation strategies.

Once you’re ready to invest, Token Metrics makes execution simple:
Use Token Metrics to continuously monitor your investments:
Advanced users can also plug into the Token Metrics API or MCP Server to build custom dashboards, AI bots, and automated strategies.
Here’s what makes Token Metrics different from other platforms:

In 2025, crypto investing is no longer about gambling or following influencers. It’s about using AI, data, and automation to make smarter, faster, and more profitable decisions.
With Token Metrics, you gain access to:
Whether you’re new to crypto or looking to take your portfolio to the next level, Token Metrics is the ultimate investment companion.
.png)
As of July 2025, Bitcoin (BTC) is experiencing a major breakout, surging past $119,000 after breaching the critical $110,000 resistance level. This surge, driven by institutional capital inflows, supply constraints, and favorable macroeconomic trends, has reignited optimism in the broader crypto market.

But how high can Bitcoin go in 2025—and beyond? Is this rally sustainable? What are the risks? In this highly informative and SEO-optimized blog post, we’ll provide a detailed Bitcoin price prediction for 2025, using real-time data from the Token Metrics AI crypto trading and research platform, along with key macro, on-chain, and policy-level insights.
On June 28, 2025, the Token Metrics AI signal for Bitcoin turned bullish, signaling a strong shift in momentum. Since then, Bitcoin has:

This wasn’t just a technical rally—it’s been fundamentally driven by several powerful tailwinds.
Major financial institutions—BlackRock, Fidelity, and Charles Schwab—have led the charge in Bitcoin ETF adoption. As of Q3 2025:
Institutional buyers are not flipping BTC like retail investors. Instead, they’re accumulating and holding, tightening supply and driving long-term demand.
Another bullish on-chain indicator: BTC reserves on exchanges have dropped from 3.25 million to just 2.55 million BTC—a level not seen since 2017. This suggests:
When supply tightens while demand rises, prices move up—a simple but powerful formula playing out in real time.
The current U.S. regulatory landscape is the most Bitcoin-friendly in history.
There are growing discussions in U.S. policy circles around holding Bitcoin as a strategic reserve asset, similar to gold. This has further validated BTC as:
Clear guidelines on:
…have dramatically increased institutional confidence in Bitcoin.
The U.S. Dollar Index (DXY) has fallen due to:
This has led investors to rotate into store-of-value assets like Bitcoin.
Tensions in the Middle East (e.g., Israel-Iran) and ongoing trade disputes have fueled demand for assets that are:
Bitcoin fits all three criteria, increasing its role as a digital safe haven in times of global instability.
While the Bitcoin outlook is bullish, several risks could slow momentum:
Bitcoin’s Proof-of-Work (PoW) consensus mechanism remains energy-intensive. Critics argue this could:
Not all jurisdictions are as pro-Bitcoin as the U.S. In 2025, some countries (especially in Asia and Europe) continue to:
With BTC up significantly since the start of 2025, short-term pullbacks are likely. Corrections of 15–25% are common in bull cycles—investors should be prepared with clear entry and exit strategies.
If institutional inflows slow down or new regulation spooks the market:
Using on-chain data, macro indicators, and real-time signals from the Token Metrics platform, the current forecast is:

This outlook is supported by Token Metrics AI signals, which have maintained a bullish position since late June 2025.
While Bitcoin is a macro asset, altcoins often outperform it in bull markets. Token Metrics helps investors identify these opportunities with:


If you’re looking to ride the current Bitcoin bull cycle and find the next big altcoins to complement your portfolio, start using Token Metrics today:
✅ Track real-time signals
✅ Discover early Moonshots
✅ Analyze risk with AI
✅ Make informed crypto investment decisions


 Create Your Free Account
9450 SW Gemini Dr
PMB 59348
Beaverton, Oregon 97008-7105 US
.svg)


.png)
Token Metrics Media LLC is a regular publication of information, analysis, and commentary focused especially on blockchain technology and business, cryptocurrency, blockchain-based tokens, market trends, and trading strategies.
Token Metrics Media LLC does not provide individually tailored investment advice and does not take a subscriber’s or anyone’s personal circumstances into consideration when discussing investments; nor is Token Metrics Advisers LLC registered as an investment adviser or broker-dealer in any jurisdiction.
Information contained herein is not an offer or solicitation to buy, hold, or sell any security. The Token Metrics team has advised and invested in many blockchain companies. A complete list of their advisory roles and current holdings can be viewed here: https://tokenmetrics.com/disclosures.html/
Token Metrics Media LLC relies on information from various sources believed to be reliable, including clients and third parties, but cannot guarantee the accuracy and completeness of that information. Additionally, Token Metrics Media LLC does not provide tax advice, and investors are encouraged to consult with their personal tax advisors.
All investing involves risk, including the possible loss of money you invest, and past performance does not guarantee future performance. Ratings and price predictions are provided for informational and illustrative purposes, and may not reflect actual future performance.


%20Price%20Prediction%20.webp)


%20Price%20Prediction.webp)


