


.png)


.png)
.png)


.png)


.png)
%201%20(1).png)

.png)


.png)


.png)
.png)


.png)


.png)

.png)
.png)
.png)
.png)
.png)
.png)
.png)
.png)
.png)


.png)


.png)

.png)
.png)


.png)


.png)
.png)
.png)
.png)

.png)
.png)


Research
Top Crypto Trading Platforms in 2025
When it comes to crypto trading platforms, Token Metrics is not an exchange, but a crypto analytics and crypto trading intelligence platform powered by AI.
Token Metrics Team
10 min


%201.svg)
%201.svg)
Big news: We’re cranking up the heat on AI-driven crypto analytics with the launch of the Token Metrics API and our official SDK (Software Development Kit). This isn’t just an upgrade – it's a quantum leap, giving traders, hedge funds, developers, and institutions direct access to cutting-edge market intelligence, trading signals, and predictive analytics.
Crypto markets move fast, and having real-time, AI-powered insights can be the difference between catching the next big trend or getting left behind. Until now, traders and quants have been wrestling with scattered data, delayed reporting, and a lack of truly predictive analytics. Not anymore.
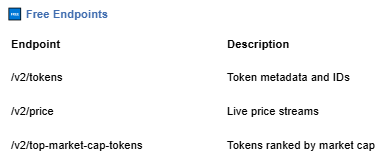
The Token Metrics API delivers 32+ high-performance endpoints packed with powerful AI-driven insights right into your lap, including:
Getting started with the Token Metrics API is simple:
At Token Metrics, we believe data should be decentralized, predictive, and actionable.
The Token Metrics API & SDK bring next-gen AI-powered crypto intelligence to anyone looking to trade smarter, build better, and stay ahead of the curve. With our official SDK, developers can plug these insights into their own trading bots, dashboards, and research tools – no need to reinvent the wheel.
This tutorial shows you how to use x402 with Token Metrics in two ways. First, we will walk through x402 Composer, where you can run Token Metrics agents, ask questions, and see pay-per-request tool calls stream into a live Feed with zero code. Second, we will give you copy-paste Axios and HTTPX clients that handle the full x402 flow (402 challenge, wallet payment, automatic retry) so you can integrate Token Metrics into your own apps.
Whether you are exploring x402 for the first time or building production agent workflows, this guide has you covered. By the end, you will understand how x402 payments work under the hood and have working code you can ship today. Let's start with the no-code option in Composer.
Start using Token Metrics X402 integration here. https://www.x402scan.com/server/244415a1-d172-4867-ac30-6af563fd4d25
x402 Composer is a playground for AI agents that pay per tool call. You can test Token Metrics endpoints, see live payment settlements, and understand the x402 flow before writing any code.
What Is Composer?
Composer is x402scan's hosted environment for building and using AI agents that pay for external resources via x402. It provides a chat interface, an agent directory, and a real-time Feed showing every tool call and payment across the ecosystem. Token Metrics endpoints are available as tools that agents can call on demand.
Explore Composer: https://x402scan.com/composer
Step-by-Step Walkthrough
Follow these steps to run a Token Metrics query and watch the payment happen in real time.
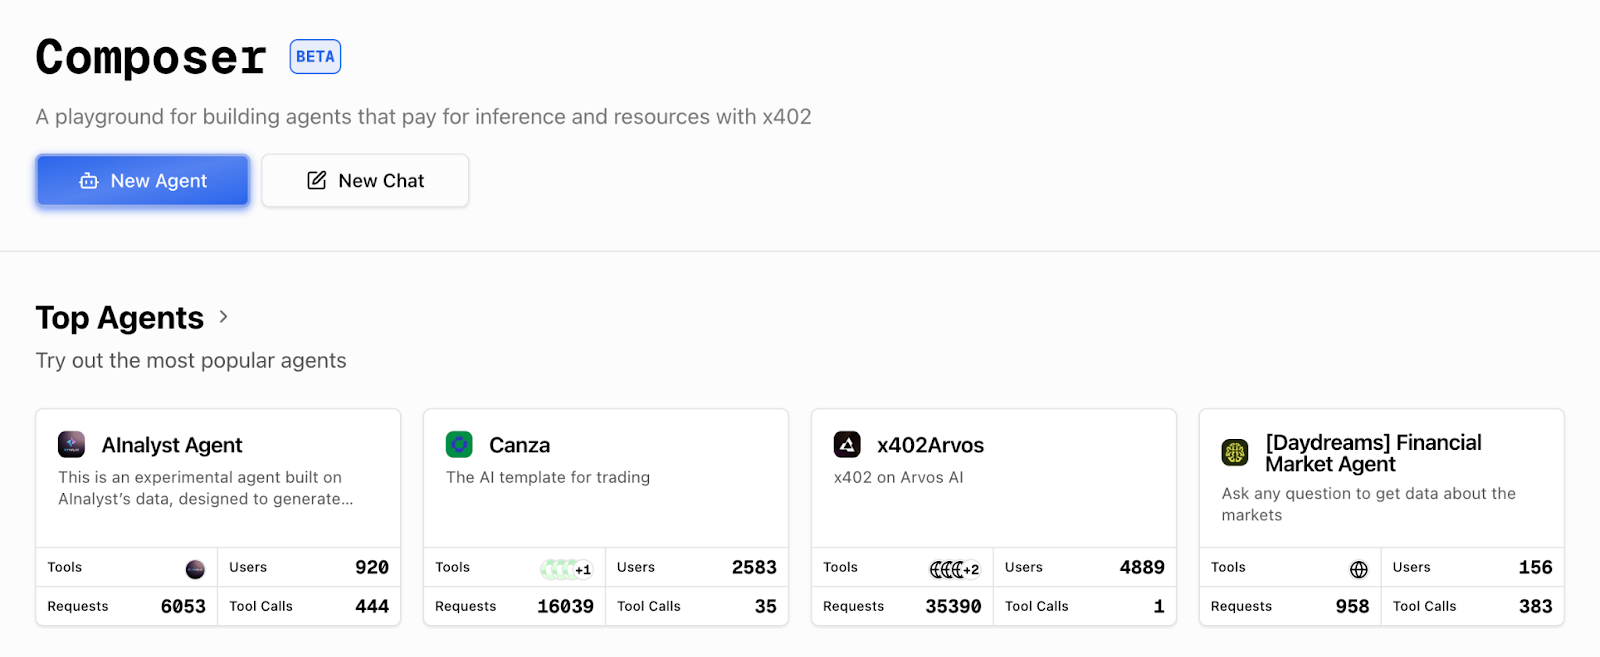
Composer agents directory: Composer Agents page: Each agent shows tool stack, messages, and recent activity.
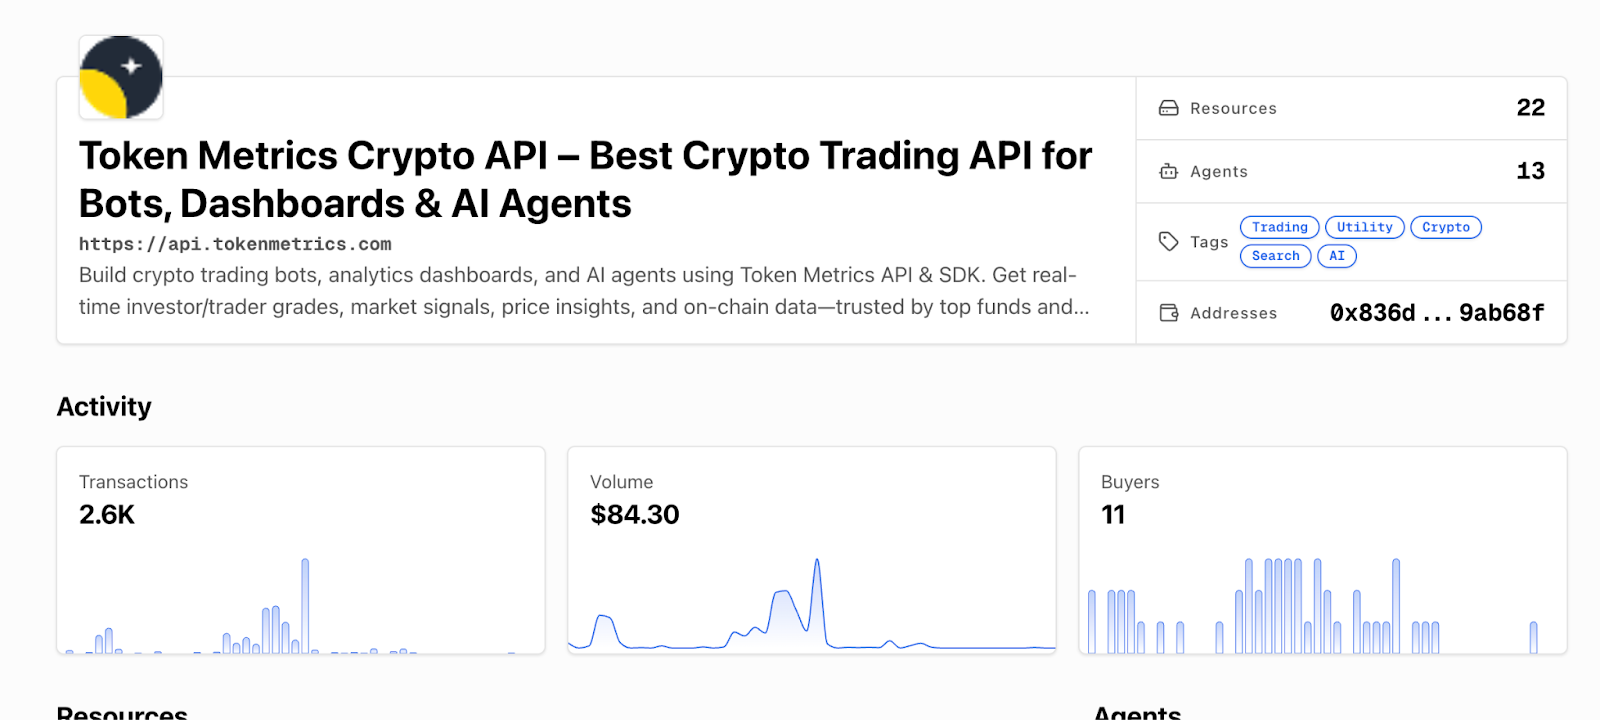
Individual agent page: Agent detail page: View tools, description, and click "Use Agent" to start.
[INSERT SCREENSHOT: Chat interface]
Chat interface: Chat UI: Ask a question like "What are the top trading signals for BTC today?"
[INSERT SCREENSHOT: Composer Feed]
Composer Feed: Live Feed: Each tool call shows the endpoint, payment token, amount, and settlement status.
That is the x402 flow in action. The agent's wallet paid for the API call automatically, the server verified payment, and the data came back. No API keys, no monthly bills, just pay-per-use access.
Key Observations from Composer
Now that you have seen x402 in action, let's build your own client that can call Token Metrics endpoints with automatic payment handling.
How x402 Works (Quick Refresher)
When you make a request with the x-coinbase-402 header, the Token Metrics API returns a 402 Payment Required response with payment instructions (recipient address, amount, chain). Your x402 client reads this challenge, signs a payment transaction with your wallet, submits it to the blockchain, and then retries the original request with proof of payment. The server verifies the settlement and returns the data. The x402-axios and x402 Python libraries handle this flow automatically.
Prerequisites
Recommended Token Metrics Endpoints for x402
These endpoints are commonly used by agents and developers building on x402. All are pay-per-call with transparent pricing.
Full endpoint list and docs: https://developers.tokenmetrics.com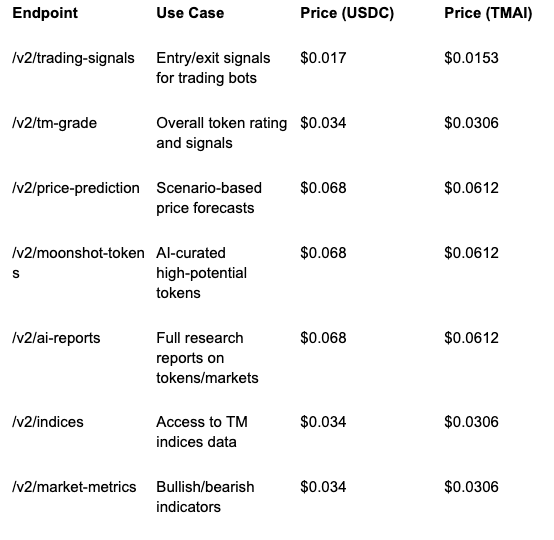
Here are the most common issues developers encounter with x402 and their solutions.
Error: Payment Failed (402 Still Returned After Retry)
This usually means your wallet does not have enough USDC or TMAI to cover the call, or the payment transaction failed on-chain.
Error: Network Timeout
x402 requests take longer than standard API calls because they include a payment transaction. If you see timeouts, increase your client timeout.
Error: 429 Rate Limit Exceeded
Even with pay-per-call, Token Metrics enforces rate limits to prevent abuse. If you hit a 429, back off and retry.
Error: Invalid Header or Missing x-coinbase-402
If you forget the x-coinbase-402: true header, the server will treat your request as a standard API call and may return a 401 Unauthorized if no API key is present.
Why This Matters for Agents
Traditional APIs force agents to carry API keys, which creates security risks and requires human intervention for key rotation and billing. With x402, agents can pay for themselves using wallet funds, making them truly autonomous. This unlocks agentic commerce where AI systems compose services on the fly, paying only for what they need without upfront subscriptions or complex auth flows.
For Token Metrics specifically, x402 means agents can pull real-time crypto intelligence (signals, grades, predictions, research) as part of their decision loops. They can chain our endpoints with other x402-enabled tools like Heurist Mesh (on-chain data), Tavily (web search), and Firecrawl (content extraction) to build sophisticated, multi-source analysis workflows. It is HTTP-native payments meeting real-world agent use cases.
Can I use the same wallet for multiple agents?
Yes. Each agent (or client instance) can use the same wallet, but be aware of nonce management if making concurrent requests. The x402 libraries handle this automatically.
Do I need to approve token spending before using x402?
No. The x402 payment flow uses direct transfers, not approvals. Your wallet just needs sufficient balance.
Can I see my payment history?
Yes. Check x402scan (https://x402scan.com/composer/feed) for a live feed of all x402 transactions, or view your wallet's transaction history on a Base block explorer.
What if I want to use a different payment token?
Currently x402 with Token Metrics supports USDC and TMAI on Base. To request support for additional tokens, contact Token Metrics.
How do I switch from testnet to mainnet?
Change your viem chain from baseSepolia to base (in Node.js) or update your RPC URL (in Python). Make sure your wallet has mainnet USDC or TMAI.
Can I use x402 in browser-based apps?
Yes, but you will need a browser wallet extension (like MetaMask or Coinbase Wallet) and a frontend-compatible x402 library. The current x402-axios and x402-python libraries are designed for server-side or Node.js environments.
Next Steps
Disclosure
Educational and informational purposes only. x402 involves crypto payments on public blockchains. Understand the risks, secure your private keys, and test thoroughly before production use. Token Metrics does not provide financial advice.
Token Metrics provides powerful crypto analytics, signals, and AI-driven tools to help you make smarter trading and investment decisions. Start exploring Token Metrics ratings and APIs today for data-driven success.
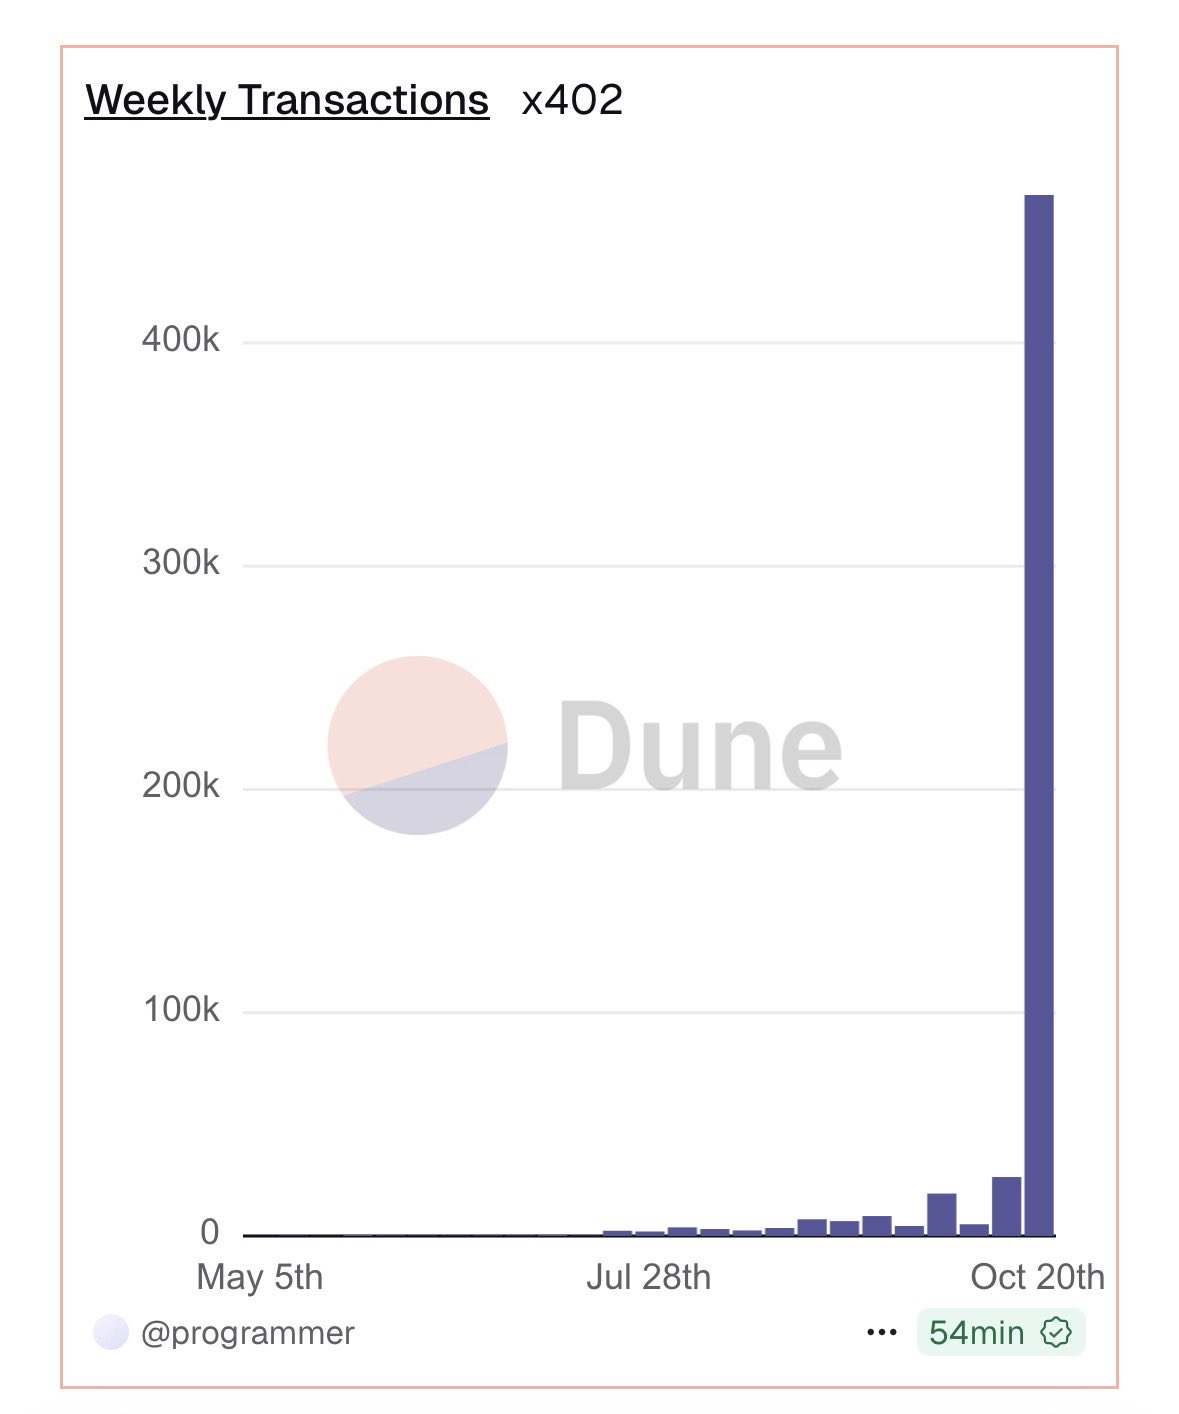
Developers are already shipping with x402 at scale: 450,000+ weekly transactions, 700+ projects. This momentum is why our Token Metrics x402 integration matters for agents and apps that need real crypto intelligence on demand. You can now pay per API call using HTTP 402 and the x-coinbase-402 header, no API key required.
Summary: Pay per API call to Token Metrics with x402 on Base using USDC or TMAI, set x-coinbase-402: true, and get instant access to trading signals, grades, and AI reports.
Check out the x402 ecosystem on Coingecko.

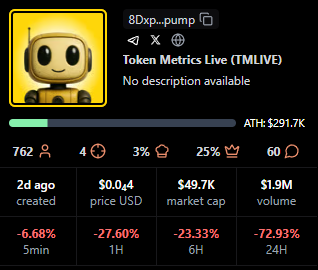
Token Metrics now supports x402, the HTTP-native payment protocol from Coinbase. Users can call any public endpoint by paying per request with a wallet, eliminating API key management and upfront subscriptions. This makes Token Metrics data instantly accessible to AI agents, researchers, and developers who want on-demand crypto intelligence.
x402 enables truly flexible access where you pay only for what you use, with transparent per-call pricing in USDC or TMAI. The integration is live now across all Token Metrics public endpoints, from trading signals to AI reports. Here's everything you need to start calling Token Metrics with x402 today.
Get started with x402 + Token Metrics in three steps.
That is it. Your wallet pays per call, and you get instant access to Token Metrics data with no subscription overhead.

Transparent per-call pricing across all Token Metrics public endpoints. Pay in USDC or get 10% off with TMAI.


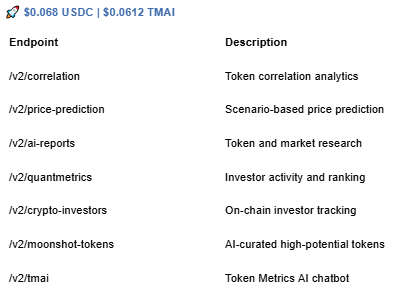
All prices are per single call. Paying with TMAI automatically applies a 10% discount.
If you want to see x402 + Token Metrics in action without writing code, head to x402 Composer. Composer is x402scan's playground for AI agents that pay per tool call. You can open a Token Metrics agent, chat with it, and watch real tool calls and USDC/TMAI settlements stream into the live Feed.
Composer surfaces active agents using Token Metrics endpoints like trading signals, price predictions, and AI reports. It is a great way to explore what is possible before you build your own integration. Link: https://x402scan.com/composer
Traditional API access requires upfront subscriptions, fixed rate limits, and key management overhead. x402 flips that model by letting you pay per call with a crypto wallet, with no API keys or monthly commitments. This is especially powerful for AI agents, which need flexible, on-demand access to external data without human intervention.
For Token Metrics, x402 unlocks agentic commerce where agents can autonomously pull crypto intelligence, pay only for what they use, and compose our endpoints with other x402-enabled tools like Heurist Mesh, Tavily, and Firecrawl. It is HTTP-native payments meeting real-world agent workflows.
x402 is an open-source HTTP-native payment protocol developed by Coinbase. It uses the HTTP 402 status code (Payment Required) to enable pay-per-request access to APIs and services. When you make a request with the x-coinbase-402 header, the server returns a payment challenge, your wallet signs and submits payment, and the server fulfills the request once settlement is verified.
The protocol runs on Base and Solana, with USDC and TMAI as the primary payment tokens. x402 is designed for composability, agents can chain multiple paid calls across different providers in a single workflow, paying each service directly without intermediaries. Learn more at the x402 Quickstart for Buyers: https://docs.cdp.coinbase.com/x402/docs/quickstart-buyers
Do I need an API key to use x402 with Token Metrics?
No. When you set x-coinbase-402: true, your wallet signature replaces API key authentication. Do not send x-api-key in your requests.
Can I use x402 with a free trial or test wallet?
Yes, but you will need testnet USDC or TMAI on Base Sepolia (testnet) for development. Production calls require mainnet tokens.
How do I see my payment history?
Check x402scan for transaction logs and tool call history. Your wallet will also show outgoing USDC/TMAI transactions. Visit https://www.x402scan.com.
What happens if my wallet balance is too low?
The x402 client will return a payment failure before making the API call. Top up your wallet and retry.
Can I use x402 in production apps?
Yes. x402 is live on Base mainnet. Set appropriate spend limits and handle payment errors gracefully in your code.
Disclosure
Educational and informational purposes only. x402 involves crypto payments on public blockchains. Understand the risks, manage your wallet security, and test thoroughly before production use. Token Metrics does not provide financial advice.
DeFi protocols are maturing beyond early ponzi dynamics toward sustainable revenue models. Uniswap operates in this evolving landscape where real yield and proven product market fit increasingly drive valuations rather than speculation alone. Growing regulatory pressure on centralized platforms creates tailwinds for decentralized alternatives.
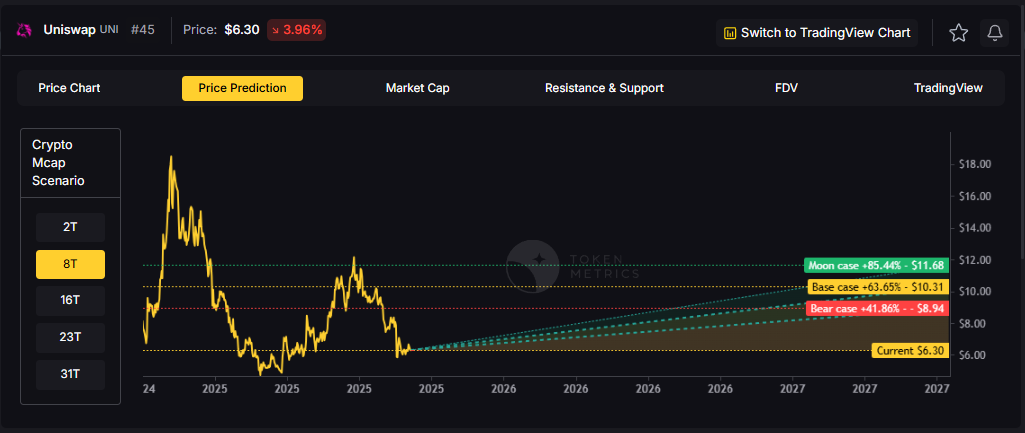
The price prediction scenario bands below reflect how UNI might perform across different total crypto market cap environments. Each tier represents a distinct liquidity regime, from bear conditions with muted DeFi activity to moon price prediction scenarios where decentralized infrastructure captures significant value from traditional finance.
Disclosure
Educational purposes only, not financial advice. Crypto is volatile, do your own research and manage risk.
Each band blends cycle analogues and market cap share math with TA guardrails. Base assumes steady adoption and neutral or positive macro. Moon layers in a liquidity boom. Bear assumes muted flows and tighter liquidity.
Token Metrics TM Grade is 69%, Buy, and the trading signal is bullish. Price prediction scenarios cluster roughly between $6.50 and $28, with a base case price target near $13.50.
Live details: Uniswap Token Details
Affiliate Disclosure: We may earn a commission from qualifying purchases made via this link, at no extra cost to you.
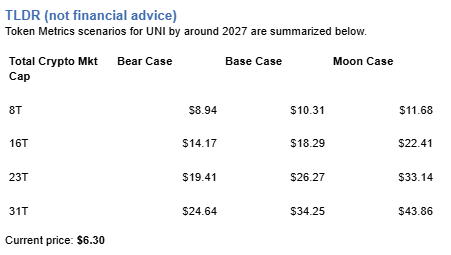
Token Metrics price prediction scenarios span four market cap tiers, each representing different levels of crypto market maturity and liquidity:
At an 8 trillion dollar total crypto market cap, UNI price prediction projects to $8.94 in bear conditions, $10.31 in the base case, and $11.68 in bullish scenarios.
Doubling the market to 16 trillion expands the price prediction range to $14.17 (bear), $18.29 (base), and $22.41 (moon).

At 23 trillion, the price forecast scenarios show $19.41, $26.27, and $33.14 respectively.

In the maximum liquidity scenario of 31 trillion, UNI price prediction could reach $24.64 (bear), $34.25 (base), or $43.86 (moon).

Each tier assumes progressively stronger market conditions, with the base case price prediction reflecting steady growth and the moon case requiring sustained bull market dynamics.
Uniswap represents one opportunity among hundreds in crypto markets. Token Metrics Indices bundle UNI with top one hundred assets for systematic exposure to the strongest projects. Single tokens face idiosyncratic risks that diversified baskets mitigate.
Historical index performance demonstrates the value of systematic diversification versus concentrated positions.
Uniswap is a decentralized exchange protocol built on Ethereum that enables token swaps using automated market makers instead of order books. It aims to provide open access to liquidity for traders, developers, and applications through transparent smart contracts.
UNI is the governance token that lets holders vote on protocol upgrades and parameters, aligning incentives across the ecosystem. The protocol is a market leader in decentralized exchange activity with broad integration across wallets and DeFi apps.
Token Metrics AI provides comprehensive context on Uniswap's positioning and challenges that inform our price prediction models.
Vision: Uniswap aims to create a fully decentralized and permissionless financial market where anyone can trade or provide liquidity without relying on centralized intermediaries. Its vision emphasizes open access, censorship resistance, and community driven governance.
Problem: Traditional exchanges require trusted intermediaries to match buyers and sellers, creating barriers to access, custody risks, and potential for censorship. In DeFi, the lack of efficient, trustless mechanisms for token swaps limits interoperability and liquidity across applications.
Solution: Uniswap solves this by using smart contracts to create liquidity pools funded by users who earn trading fees in return. The protocol automatically prices assets using a constant product formula, enabling seamless swaps. UNI token holders can participate in governance, influencing parameters like fee structures and protocol upgrades.
Market Analysis: Uniswap operates within the broader DeFi and Ethereum ecosystems, competing with other decentralized exchanges like SushiSwap, Curve, and Balancer. It is a market leader in terms of cumulative trading volume and liquidity depth. Adoption is strengthened by strong developer activity, widespread integration across wallets and dApps, and a large user base.
Fundamental Grade: 79.88% (Community 77%, Tokenomics 100%, Exchange 100%, VC 66%, DeFi Scanner 62%).

Technology Grade: 86.88% (Activity 72%, Repository 72%, Collaboration 100%, Security N/A, DeFi Scanner 62%).

Will UNI hit $20 by 2027 according to price predictions?
The 16T price prediction scenario shows UNI at $18.29 in the base case, which does not exceed $20. However, the 23T base case shows $26.27, surpassing the $20 target. Price prediction outcome depends on total crypto market cap growth and Uniswap maintaining market share. Not financial advice.
Can UNI 10x from current levels based on price predictions?
At current price of $6.30, a 10x would reach $63.00. This falls within none of the listed price prediction scenarios, which top out at $43.86 in the 31T moon case. Bear in mind that 10x returns require substantial market cap expansion beyond our modeled scenarios. Not financial advice.
What price could UNI reach in the moon case price prediction?
Moon case price predictions range from $11.68 at 8T to $43.86 at 31T total crypto market cap. These price prediction scenarios assume maximum liquidity expansion and strong Uniswap adoption. Not financial advice.
What is the 2027 Uniswap price prediction?
Based on Token Metrics analysis, the 2027 price prediction for Uniswap centers around $13.50 in the base case under current market conditions, with a range between $6.50 and $28 depending on market scenarios. Bullish price predictions with strong market conditions range from $10.31 to $43.86 across different total crypto market cap environments.
What drives UNI price predictions?
UNI price predictions are driven by DEX trading volume, liquidity provider activity, governance participation, protocol fee revenue, and competition from other decentralized exchanges. The strong technology grade (86.88%) and bullish signal support upward price potential. DeFi adoption rates and regulatory clarity around decentralized exchanges remain primary drivers for reaching upper price prediction targets.
Can UNI reach $30-$40 by 2027?
According to our price prediction models, UNI could reach $30-$40 in the 23T moon case ($33.14) and in the 31T scenarios where the base case is $34.25 and the moon case is $43.86. These price prediction outcomes require significant crypto market expansion and Uniswap maintaining DEX market leadership. Not financial advice.

Disclosure
Educational purposes only, not financial advice. Crypto is volatile, do your own research and manage risk.
.svg)


.png)
Token Metrics Media LLC is a regular publication of information, analysis, and commentary focused especially on blockchain technology and business, cryptocurrency, blockchain-based tokens, market trends, and trading strategies.
Token Metrics Media LLC does not provide individually tailored investment advice and does not take a subscriber’s or anyone’s personal circumstances into consideration when discussing investments; nor is Token Metrics Advisers LLC registered as an investment adviser or broker-dealer in any jurisdiction.
Information contained herein is not an offer or solicitation to buy, hold, or sell any security. The Token Metrics team has advised and invested in many blockchain companies. A complete list of their advisory roles and current holdings can be viewed here: https://tokenmetrics.com/disclosures.html/
Token Metrics Media LLC relies on information from various sources believed to be reliable, including clients and third parties, but cannot guarantee the accuracy and completeness of that information. Additionally, Token Metrics Media LLC does not provide tax advice, and investors are encouraged to consult with their personal tax advisors.
All investing involves risk, including the possible loss of money you invest, and past performance does not guarantee future performance. Ratings and price predictions are provided for informational and illustrative purposes, and may not reflect actual future performance.


%20Price%20Prediction%202025%2C%202030%20-%20Forecast%20Analysis.png)


.png)

%20Price%20Prediction%20.webp)


%20Price%20Prediction.webp)


%20Price%20Prediction%20Analysis%20-%20Can%20it%20Reach%20%24500%20in%20Future_.png)


