


.png)
.png)
.png)
.png)
%20(1).png)
.png)


.png)


.png)
.png)


.png)


.png)
%201%20(1).png)

.png)


.png)


.png)
.png)


.png)


.png)

.png)
.png)
.png)
.png)
.png)
.png)


.png)


.png)

.png)
.png)


.png)


.png)
.png)
.png)

.png)
.png)


Research
Top Crypto Trading Platforms in 2025
When it comes to crypto trading platforms, Token Metrics is not an exchange, but a crypto analytics and crypto trading intelligence platform powered by AI.
Token Metrics Team
10


%201.svg)
%201.svg)
Big news: We’re cranking up the heat on AI-driven crypto analytics with the launch of the Token Metrics API and our official SDK (Software Development Kit). This isn’t just an upgrade – it's a quantum leap, giving traders, hedge funds, developers, and institutions direct access to cutting-edge market intelligence, trading signals, and predictive analytics.
Crypto markets move fast, and having real-time, AI-powered insights can be the difference between catching the next big trend or getting left behind. Until now, traders and quants have been wrestling with scattered data, delayed reporting, and a lack of truly predictive analytics. Not anymore.
The Token Metrics API delivers 32+ high-performance endpoints packed with powerful AI-driven insights right into your lap, including:
Getting started with the Token Metrics API is simple:
At Token Metrics, we believe data should be decentralized, predictive, and actionable.
The Token Metrics API & SDK bring next-gen AI-powered crypto intelligence to anyone looking to trade smarter, build better, and stay ahead of the curve. With our official SDK, developers can plug these insights into their own trading bots, dashboards, and research tools – no need to reinvent the wheel.
Why 2026 Looks Bullish, And What It Could Mean for TRX
The crypto market is shifting toward a broadly bullish regime into 2026 as liquidity improves and risk appetite normalizes.
Regulatory clarity across major regions is reshaping the classic four-year cycle, flows can arrive earlier and persist longer.
Institutional access keeps expanding through ETFs and qualified custody, while L2 scaling and real-world integrations broaden utility.
Infrastructure maturity lowers frictions for capital, which supports deeper order books and more persistent participation.
This backdrop frames our scenario work for TRX.
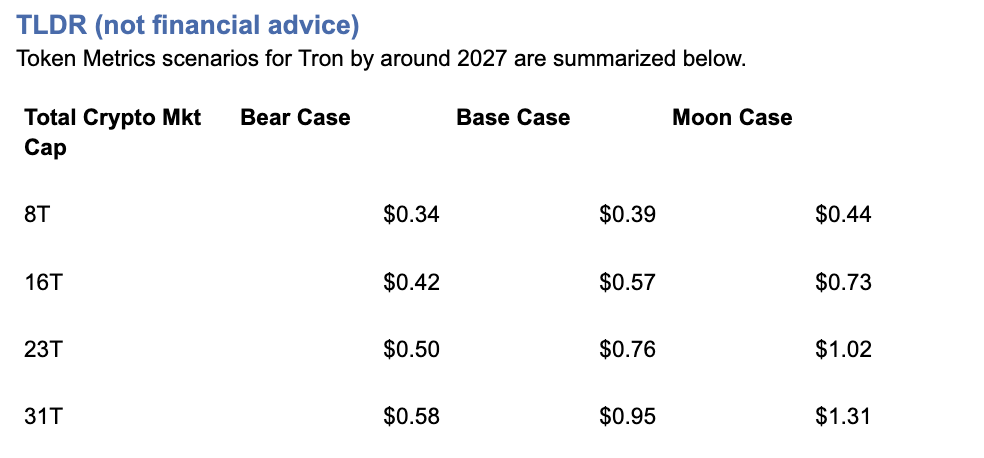
The bands below map potential outcomes to different total crypto market sizes.
Use the table as a quick benchmark, then layer in live grades and signals for timing.
Current price: $0.2971.
How to read it: Each band blends cycle analogues and market-cap share math with TA guardrails. Base assumes steady adoption and neutral or positive macro. Moon layers in a liquidity boom. Bear assumes muted flows and tighter liquidity.
TM Agent baseline: Token Metrics TM Grade for $TRX is 19.06, which translates to a Strong Sell, and the trading signal is bearish, indicating short-term downward momentum.
Price context: $TRX is trading around $0.297, market cap rank #10, and is down about 11% over 30 days while up about 80% year-over-year, it has returned roughly 963% since the last trading signal flip.
Live details: Tron Token Details → https://app.tokenmetrics.com/en/tron
Buy TRX: https://www.mexc.com/acquisition/custom-sign-up?shareCode=mexc-2djd4
Scenario driven, outcomes hinge on total crypto market cap, higher liquidity and adoption lift the bands.
TM Agent gist: bearish near term, upside depends on a sustained risk-on regime and improvements in TM Grade and the trading signal.
Education only, not financial advice.
8T: 
16T: 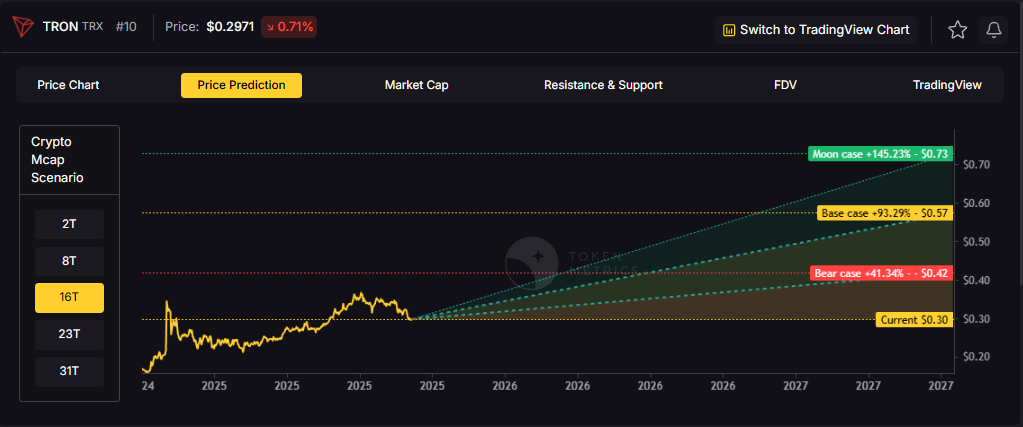
23T: 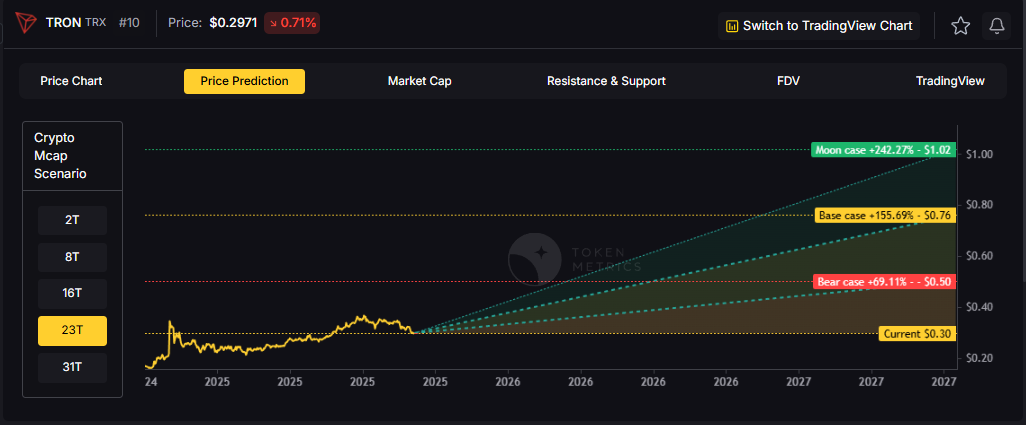
Diversification matters.
Tron is compelling, yet concentrated bets can be volatile.
Token Metrics Indices hold TRX alongside the top one hundred tokens for broad exposure to leaders and emerging winners.
Our backtests indicate that owning the full market with diversified indices has historically outperformed both the total market and Bitcoin in many regimes due to diversification and rotation.
Get early access: https://docs.google.com/forms/d/1AnJr8hn51ita6654sRGiiW1K6sE10F1JX-plqTUssXk/preview
If your editor supports embeds, place a form embed here. Otherwise, include the link above as a button labeled Join Indices Early Access.
Tron is a smart-contract blockchain focused on low-cost, high-throughput transactions and cross-border settlement.
The network supports token issuance and a broad set of dApps, with an emphasis on stablecoin transfer volume and payments.
TRX is the native asset that powers fees and staking for validators and delegators within the network.
Developers and enterprises use the chain for predictable costs and fast finality, which supports consumer-facing use cases.
• Institutional and retail access expands with ETFs, listings, and integrations.
• Macro tailwinds from lower real rates and improving liquidity.
• Product or roadmap milestones such as upgrades, scaling, or partnerships.
• Macro risk-off from tightening or liquidity shocks.
• Regulatory actions or infrastructure outages.
• Concentration or validator economics and competitive displacement.
Unlock platform-wide intelligence on every major crypto asset. Use code ADVANCED20 at checkout for twenty percent off.
AI powered ratings on thousands of tokens for traders and investors.
Interactive TM AI Agent to ask any crypto question.
Indices explorer to surface promising tokens and diversified baskets.
Signal dashboards, backtests, and historical performance views.
Watchlists, alerts, and portfolio tools to track what matters.
Early feature access and enhanced research coverage.
Start with Advanced today → https://www.tokenmetrics.com/token-metrics-pricing
Can TRX reach $1?
Yes, the 23T moon case shows $1.02 and the 31T moon case shows $1.31, which imply a path to $1 in higher-liquidity regimes. Not financial advice.
Is TRX a good long-term investment
Outcome depends on adoption, liquidity regime, competition, and supply dynamics. Diversify and size positions responsibly.

Track live grades and signals: Token Details → https://app.tokenmetrics.com/en/tron
Join Indices Early Access: https://docs.google.com/forms/d/1AnJr8hn51ita6654sRGiiW1K6sE10F1JX-plqTUssXk/preview
Want exposure Buy TRX on MEXC → https://www.mexc.com/acquisition/custom-sign-up?shareCode=mexc-2djd4
Educational purposes only, not financial advice. Crypto is volatile, do your own research and manage risk.
Token Metrics delivers AI-powered crypto ratings, research, and portfolio tools for every level of investor and trader seeking an edge.
The cryptocurrency market presents unprecedented wealth-building opportunities, but it also poses significant challenges.
With thousands of tokens competing for investor attention and market volatility that can erase gains overnight, success in crypto investing requires more than luck—it demands a strategic, data-driven approach.
Token Metrics AI Indices have emerged as a game-changing solution for investors seeking to capitalize on crypto's growth potential while managing risk effectively.
This comprehensive guide explores how to leverage these powerful tools to build, manage, and optimize your cryptocurrency portfolio for maximum returns in 2025 and beyond.
The traditional approach to crypto investing involves countless hours of research, technical analysis, and constant market monitoring.
For most investors, this proves unsustainable.
Token Metrics solves this challenge by offering professionally managed, AI-driven index portfolios that automatically identify winning opportunities and rebalance based on real-time market conditions.
What makes Token Metrics indices unique is their foundation in machine learning technology.
The platform analyzes over 6,000 cryptocurrencies daily, processing more than 80 data points per asset including technical indicators, fundamental metrics, on-chain analytics, sentiment data, and exchange information.
This comprehensive evaluation far exceeds what individual investors can accomplish manually.
The indices employ sophisticated AI models including gradient boosting decision trees, recurrent neural networks, random forests, natural language processing algorithms, and anomaly detection frameworks.
These systems continuously learn from market patterns, adapt to changing conditions, and optimize portfolio allocations to maximize risk-adjusted returns.
Token Metrics offers a diverse range of indices designed to serve different investment objectives, risk tolerances, and market outlooks.
Understanding these options is crucial for building an effective crypto portfolio.
Conservative Indices: Stability and Long-Term Growth
For investors prioritizing capital preservation and steady appreciation, conservative indices focus on established, fundamentally sound cryptocurrencies with proven track records.
These indices typically allocate heavily to Bitcoin and Ethereum while including select large-cap altcoins with strong fundamentals.
The Investor Grade Index exemplifies this approach, emphasizing projects with solid development teams, active communities, real-world adoption, and sustainable tokenomics.
This index is ideal for retirement accounts, long-term wealth building, and risk-averse investors seeking exposure to crypto without excessive volatility.
Balanced Indices: Growth with Measured Risk
Balanced indices strike a middle ground between stability and growth potential.
These portfolios combine major cryptocurrencies with promising mid-cap projects that demonstrate strong technical momentum and fundamental strength.
The platform's AI identifies tokens showing positive divergence across multiple indicators—rising trading volume, improving developer activity, growing social sentiment, and strengthening technical patterns.
Balanced indices typically rebalance weekly or bi-weekly, capturing emerging trends while maintaining core positions in established assets.
Aggressive Growth Indices: Maximum Upside Potential
For investors comfortable with higher volatility in pursuit of substantial returns, aggressive growth indices target smaller-cap tokens with explosive potential.
These portfolios leverage Token Metrics' Trader Grade system to identify assets with strong short-term momentum and technical breakout patterns.
Aggressive indices may include DeFi protocols gaining traction, Layer-1 blockchains with innovative technology, AI tokens benefiting from market narratives, and memecoins showing viral adoption patterns.
While risk is higher, the potential for 10x, 50x, or even 100x returns makes these indices attractive for portfolio allocation strategies that embrace calculated risk.
Sector-Specific Indices: Thematic Investing
Token Metrics offers specialized indices targeting specific cryptocurrency sectors, allowing investors to align portfolios with their market convictions and thematic beliefs.
• DeFi Index: Focuses on decentralized finance protocols including lending platforms, decentralized exchanges, yield aggregators, and synthetic asset platforms.
• Layer-1 Index: Concentrates on base-layer blockchains competing with Ethereum, including Solana, Avalanche, Cardano, Polkadot, and emerging ecosystems.
• AI and Machine Learning Index: Targets tokens at the intersection of artificial intelligence and blockchain technology.
• Memecoin Index: Contrary to traditional wisdom dismissing memecoins as purely speculative, Token Metrics recognizes that community-driven tokens can generate extraordinary returns.
This index uses AI to identify memecoins with genuine viral potential, active communities, and sustainable momentum before they become mainstream.
Success with Token Metrics indices requires more than simply choosing an index—it demands a comprehensive portfolio strategy tailored to your financial situation, goals, and risk tolerance.
Step 1: Assess Your Financial Profile
Begin by honestly evaluating your investment capacity, time horizon, and risk tolerance.
Ask yourself critical questions: How much capital can I allocate to crypto without compromising financial security? What is my investment timeline—months, years, or decades? How would I react emotionally to a 30% portfolio drawdown? What returns do I need to achieve my financial goals?
Your answers shape your portfolio construction.
Conservative investors with shorter timelines should emphasize stable indices, while younger investors with longer horizons can embrace more aggressive strategies.
Step 2: Determine Optimal Allocation Percentages
Financial advisors increasingly recommend including cryptocurrency in diversified portfolios, but the appropriate allocation varies significantly based on individual circumstances.
• Conservative Allocation (5-10% of portfolio): Suitable for investors approaching retirement or with low risk tolerance. Focus 80% on conservative indices, 15% on balanced indices, and 5% on sector-specific themes you understand deeply.
• Moderate Allocation (10-20% of portfolio): Appropriate for mid-career professionals building wealth. Allocate 50% to conservative indices, 30% to balanced indices, and 20% to aggressive growth or sector-specific indices.
• Aggressive Allocation (20-30%+ of portfolio): Reserved for younger investors with high risk tolerance and long time horizons. Consider 30% conservative indices for stability, 30% balanced indices for steady growth, and 40% split between aggressive growth and thematic sector indices.
Step 3: Implement Dollar-Cost Averaging
Rather than investing your entire allocation at once, implement a dollar-cost averaging strategy over 3-6 months.
This approach reduces timing risk and smooths out entry prices across market cycles.
For example, if allocating $10,000 to Token Metrics indices, invest $2,000 monthly over five months.
This strategy proves particularly valuable in volatile crypto markets where timing the perfect entry proves nearly impossible.
Step 4: Set Up Automated Rebalancing
Token Metrics indices automatically rebalance based on AI analysis, but you should also establish personal portfolio rebalancing rules.
Review your overall allocation quarterly and rebalance if any index deviates more than 10% from your target allocation.
If aggressive growth indices perform exceptionally well and grow from 20% to 35% of your crypto portfolio, take profits and rebalance back to your target allocation.
This disciplined approach ensures you systematically lock in gains and maintain appropriate risk levels.
Step 5: Monitor Performance and Adjust Strategy
While Token Metrics indices handle day-to-day portfolio management, you should conduct quarterly reviews assessing overall performance, comparing returns to benchmarks like Bitcoin and Ethereum, evaluating whether your risk tolerance has changed, and considering whether emerging market trends warrant allocation adjustments.
Use Token Metrics' comprehensive analytics to track performance metrics including total return, volatility, Sharpe ratio, maximum drawdown, and correlation to major cryptocurrencies.
These insights inform strategic decisions about continuing, increasing, or decreasing exposure to specific indices.
Once comfortable with basic index investing, consider implementing advanced strategies to enhance returns and manage risk more effectively.
Tactical Overweighting
While maintaining core index allocations, temporarily overweight specific sectors experiencing favorable market conditions.
During periods of heightened interest in AI, increase allocation to the AI and Machine Learning Index by 5-10% at the expense of other sector indices.
Return to strategic allocation once the catalyst dissipates.
Combining Indices with Individual Tokens
Use Token Metrics indices for 70-80% of your crypto allocation while dedicating 20-30% to individual tokens identified through the platform's Moonshots feature.
This hybrid approach provides professional management while allowing you to pursue high-conviction opportunities.
Market Cycle Positioning
Adjust index allocations based on broader market cycles.
During bull markets, increase exposure to aggressive growth indices.
As conditions turn bearish, shift toward conservative indices with strong fundamentals.
Token Metrics' AI Indicator provides valuable signals for market positioning.
Even with sophisticated AI-driven indices, cryptocurrency investing carries substantial risks.
Implement robust risk management practices to protect your wealth.
Diversification Beyond Crypto
Never allocate so much to cryptocurrency that a market crash would devastate your financial position.
Most financial advisors recommend limiting crypto exposure to 5-30% of investment portfolios depending on age and risk tolerance.
Maintain substantial allocations to traditional assets—stocks, bonds, real estate—that provide diversification and stability.
Position Sizing and Security
Consider implementing portfolio-level stop-losses if your crypto allocation declines significantly from its peak.
Use hardware wallets or secure custody solutions for significant holdings.
Implement strong security practices including two-factor authentication and unique passwords.
Tax Optimization
Cryptocurrency taxation typically involves capital gains taxes on profits.
Consult tax professionals to optimize your strategy through tax-loss harvesting and strategic rebalancing timing.
Token Metrics' transaction tracking helps maintain accurate records for tax reporting.
Several factors distinguish Token Metrics indices from alternatives and explain their consistent outperformance.
Token Metrics indices respond to market changes in real-time rather than waiting for scheduled monthly or quarterly rebalancing.
This responsiveness proves crucial in crypto markets where opportunities can appear and disappear rapidly.
The platform's AI evaluates dozens of factors simultaneously—technical patterns, fundamental strength, on-chain metrics, sentiment analysis, and exchange dynamics.
This comprehensive approach identifies tokens that traditional indices would miss.
The AI continuously learns from outcomes, improving predictive accuracy over time.
Models that underperform receive reduced weighting while successful approaches gain influence, creating an evolving system that adapts to changing market dynamics.
Token Metrics' extensive coverage of 6,000+ tokens provides exposure to emerging projects before they gain mainstream attention, positioning investors for maximum appreciation potential.
To illustrate practical application, consider several investor profiles and optimal index strategies.
Profile 1: Conservative 55-Year-Old Preparing for Retirement
Total portfolio: $500,000
Crypto allocation: $25,000 (5%)
Strategy: $20,000 in Investor Grade Index (80%), $4,000 in Balanced Index (16%), $1,000 in DeFi Index (4%)
This conservative approach provides crypto exposure with minimal volatility, focusing on established assets likely to appreciate steadily without risking retirement security.
Profile 2: Moderate 35-Year-Old Building Wealth
Total portfolio: $150,000
Crypto allocation: $30,000 (20%)
Strategy: $12,000 in Investor Grade Index (40%), $9,000 in Balanced Index (30%), $6,000 in Layer-1 Index (20%), $3,000 in Aggressive Growth Index (10%)
This balanced approach captures crypto growth potential while maintaining stability through substantial conservative and balanced allocations.
Profile 3: Aggressive 25-Year-Old Maximizing Returns
Total portfolio: $50,000
Crypto allocation: $15,000 (30%)
Strategy: $4,500 in Investor Grade Index (30%), $3,000 in Balanced Index (20%), $4,500 in Aggressive Growth Index (30%), $3,000 in Memecoin Index (20%)
This aggressive strategy embraces volatility and maximum growth potential, appropriate for younger investors with decades to recover from potential downturns.
Ready to begin building wealth with Token Metrics indices?
Follow this action plan:
• Week 1-2: Sign up for Token Metrics' 7-day free trial and explore available indices, historical performance, and educational resources. Define your investment goals, risk tolerance, and allocation strategy using the frameworks outlined in this guide.
• Week 3-4: Open necessary exchange accounts and wallets. Fund accounts and begin implementing your strategy through dollar-cost averaging. Set up tracking systems and calendar reminders for quarterly reviews.
• Ongoing: Follow Token Metrics' index recommendations, execute rebalancing transactions as suggested, monitor performance quarterly, and adjust strategy as your financial situation evolves.
Cryptocurrency represents one of the most significant wealth-building opportunities in modern financial history, but capturing this potential requires sophisticated approaches that most individual investors cannot implement alone.
Token Metrics AI Indices democratize access to professional-grade investment strategies, leveraging cutting-edge machine learning, comprehensive market analysis, and real-time responsiveness to build winning portfolios.
Whether you're a conservative investor seeking measured exposure or an aggressive trader pursuing maximum returns, Token Metrics provides indices tailored to your specific needs.
The choice between random coin picking and strategic, AI-driven index investing is clear.
One approach relies on luck and guesswork; the other harnesses data, technology, and proven methodologies to systematically build wealth while managing risk.
Your journey to crypto investment success begins with a single decision: commit to a professional, strategic approach rather than speculative gambling.
Token Metrics provides the tools, insights, and management to transform crypto investing from a game of chance into a calculated path toward financial freedom.
Start your 7-day free trial today and discover how AI-powered indices can accelerate your wealth-building journey.
The future of finance is decentralized, intelligent, and accessible—make sure you're positioned to benefit.
Token Metrics stands out as a leader in AI-driven crypto index solutions.
With over 6,000 tokens analyzed daily and indices tailored to every risk profile, the platform provides unparalleled analytics, real-time rebalancing, and comprehensive investor education.
Its commitment to innovation and transparency makes it a trusted partner for building your crypto investment strategy in today's fast-evolving landscape.
Token Metrics indices use advanced AI models to analyze technical, fundamental, on-chain, and sentiment data across thousands of cryptocurrencies.
They construct balanced portfolios that are automatically rebalanced in real-time to adapt to evolving market conditions and trends.
There are conservative, balanced, aggressive growth, and sector-specific indices including DeFi, Layer-1, AI, and memecoins.
Each index is designed for a different investment objective, risk tolerance, and market outlook.
No mandatory minimum is outlined for using Token Metrics indices recommendations.
You can adapt your allocation based on your personal investment strategy, capacity, and goals.
Token Metrics indices are rebalanced automatically based on dynamic AI analysis, but it is recommended to review your overall crypto allocation at least quarterly to ensure alignment with your targets.
Token Metrics provides analytics and index recommendations; investors maintain custody of their funds and should implement robust security practices such as hardware wallets and two-factor authentication.
No investing approach, including AI-driven indices, can guarantee profits.
The goal is to maximize risk-adjusted returns through advanced analytics and professional portfolio management, but losses remain possible due to the volatile nature of crypto markets.
This article is for educational and informational purposes only.
It does not constitute financial, investment, or tax advice.
Cryptocurrency investing carries risk, and past performance does not guarantee future results. Always consult your own advisor before making investment decisions.
The cryptocurrency market has evolved dramatically since Bitcoin's inception in 2009. With over 20,000 digital assets now available and a combined market capitalization exceeding $3 trillion as of 2025, navigating this complex ecosystem has become increasingly challenging for investors.
Traditional approaches to crypto investing often involve painstaking research, constant market monitoring, and the stress of picking individual tokens that may or may not succeed.
Enter crypto indices—a revolutionary approach that simplifies digital asset investing while providing diversification and professional management. Among the leaders in this space is Token Metrics, an AI-powered cryptocurrency research and analytics platform that has transformed how investors access and benefit from the crypto market through its innovative AI indices.
A cryptocurrency index is a curated portfolio of multiple digital assets grouped by strategy, market capitalization, theme, or other specific criteria. Similar to traditional stock market indices like the S&P 500, crypto indices track the performance of a basket of cryptocurrencies, allowing investors to gain broad market exposure without purchasing each token individually.
Crypto indices serve several critical functions in today's digital asset landscape. • They provide instant diversification across multiple tokens
• Reduce the risk associated with single-asset concentration
• Offer professional portfolio management and rebalancing
• Simplify the investment process for both novice and experienced investors
• Provide transparent performance tracking and reporting
The beauty of crypto indices lies in their ability to capture market movements while mitigating the extreme volatility often associated with individual cryptocurrencies.
Rather than betting on a single token, investors can participate in the growth of entire sectors or market segments.
Founded in 2018 and headquartered in Washington, D.C., Token Metrics has established itself as a leading AI-driven cryptocurrency research and analytics platform. The company serves a diverse customer base spanning from crypto fund managers to passive investors across more than 50 countries.
What sets Token Metrics apart is its sophisticated use of artificial intelligence and machine learning to build and manage crypto indices. The platform leverages advanced algorithms to analyze over 6,000 cryptocurrency projects daily, evaluating more than 80 quantitative and qualitative data points for each asset. This comprehensive analysis covers fundamental metrics, technical indicators, on-chain activity, tokenomics, sentiment data, and exchange information.
Token Metrics employs an ensemble of sophisticated machine learning models to power its indices, including:
• Gradient boosting decision trees for pattern recognition
• Recurrent neural networks for time-series predictions
• Random forests for robust classification
• Natural language processing for sentiment analysis
• Anomaly detection frameworks for risk assessment
These AI systems are continuously retrained with fresh data on a weekly basis, learning from past predictions, integrating feedback from trading outcomes, and adapting model weightings as market conditions evolve.
This dynamic approach ensures that Token Metrics indices remain responsive to rapidly changing market dynamics.
Token Metrics indices are model portfolios built using machine learning technology that simplifies and democratizes quality crypto investing and trading. Unlike static index funds, Token Metrics indices offer real-time responsiveness and active management through AI.
The platform analyzes cryptocurrencies using both Trader Grades and Investor Grades. The Trader Grade identifies assets with strong short-term upside momentum, making it ideal for active traders looking to capitalize on near-term opportunities. The Investor Grade, on the other hand, evaluates assets based on fundamentals, code quality, and adoption metrics to identify strong long-term holdings suitable for HODLers and strategic investors.
Real-Time Rebalancing
Unlike traditional indices that rebalance quarterly or monthly, Token Metrics indices can respond in real time to market changes. When sentiment shifts or volatility spikes, the AI can adjust holdings dynamically, reducing exposure to underperforming sectors while increasing allocation to high-potential areas.
Sector-Specific Strategies
Token Metrics offers indices tailored to specific cryptocurrency sectors including memecoins, Layer-1 blockchains, DeFi protocols, AI tokens, and thematic investments. This allows investors to align their portfolio with their conviction in particular market niches.
Multiple Investment Strategies
Whether you're a conservative long-term holder, an aggressive swing trader, or somewhere in between, Token Metrics provides indices designed for different risk tolerances and investment horizons. Each index has performed strongly through rigorous internal testing and real-world market conditions.
Transparent Performance Tracking
Each index provides clear investment guidance, showing all rebalancing transactions and enabling precise performance monitoring. This transparency allows investors to understand exactly how their portfolio is being managed and why specific decisions are made.
One-Click Diversification
With Token Metrics indices, building a winning crypto portfolio is just one click away. The platform eliminates the complexity of researching hundreds of tokens, determining optimal allocations, and executing trades across multiple exchanges.
Diversification and Risk Management
Crypto markets are notoriously volatile, with individual tokens capable of losing 50% or more of their value in days. By spreading investments across multiple carefully selected assets, Token Metrics indices dramatically reduce concentration risk. Research suggests that even a modest 1-3% allocation to crypto indices can historically improve overall portfolio efficiency, enhancing returns while keeping drawdowns manageable.
AI-Driven Decision Making
Human emotions—fear, greed, FOMO—often lead to poor investment decisions. Token Metrics removes emotion from the equation by leveraging data-driven AI analysis. The platform's algorithms process vast amounts of information far beyond human capability, identifying patterns and opportunities that might otherwise be missed.
Time Efficiency
Actively managing a crypto portfolio requires constant monitoring of markets, news, on-chain metrics, and technical indicators. For most investors, this is simply not feasible. Token Metrics indices automate this process, allowing investors to benefit from professional-grade management without dedicating hours daily to market research.
Access to Emerging Opportunities
Through its Moonshots feature, Token Metrics identifies tokens with 10x-100x potential before they hit major exchanges. The platform scans thousands of tokens daily, using AI to highlight daily opportunities that align with specific indices and investment strategies.
Simplified Trading Execution
Token Metrics offers integrated on-chain trading directly from the platform. There's no need to manually copy contract addresses or navigate multiple decentralized exchanges. The "Buy" button provides instant access to execute trades based on index recommendations.
Token Metrics first launched its cryptocurrency indices in August 2020 with 14 different indices leveraging artificial intelligence to build winning investment portfolios. This launch represented a response to overwhelming customer demand for simplified, professional-grade crypto investing tools.
The company's vision was clear: to do for crypto investing what Vanguard did for traditional index funds and ETFs—democratize access to sophisticated investment strategies. By 2022, Token Metrics had refined its indices platform based on extensive testing and customer feedback, continuously improving the AI models and expanding the range of available strategies.
In 2025, Token Metrics continues to innovate with plans to expand sector-specific indices, enhance mobile access for on-the-go portfolio management, and integrate automated trading bots that execute buys and sells based on real-time AI signals. These developments aim to cement Token Metrics' position as the leading platform for AI-powered crypto investing.
Investing through Token Metrics indices is straightforward and accessible to both beginners and experienced traders. Here's how to get started:
Step 1: Create an Account
Visit the Token Metrics platform and sign up for an account. The platform offers various subscription tiers, including a 7-day free trial for new users to explore the indices and other features.
Step 2: Explore Available Indices
Browse through the various indices available on the platform. Each index is designed for specific investment strategies, risk profiles, and market sectors. Review the historical performance, composition, and rebalancing frequency of each index to determine which aligns with your goals.
Step 3: Determine Your Allocation
Decide what percentage of your portfolio you want to allocate to crypto. Financial advisors typically recommend allocating 60% to long-term holds, 20% to sector themes, and 20% to higher-risk moonshots with strict risk management. For conservative investors aged 50-65, incorporating as little as 5% into value indices can improve returns without excessive risk. Moderate risk investors aged 35-50 might allocate up to 15% in balanced indices.
Step 4: Follow the Index Recommendations
Token Metrics indices provide clear, actionable guidance on which tokens to buy, in what proportions, and when to rebalance. You can either manually execute these recommendations or use the platform's integrated trading features for seamless execution.
Step 5: Monitor and Adjust
Regularly monitor your investments through the platform's comprehensive tracking tools. Watch for Trader Grade downgrades or bearish signals, analyze winning and losing patterns, and adjust your strategy as needed. Advanced users can also leverage the Token Metrics API to build custom dashboards or automated trading strategies.
The cryptocurrency investing landscape in 2025 is more sophisticated than ever, and Token Metrics has positioned itself at the forefront of this evolution. Several factors distinguish the platform from competitors:
Proven Track Record
With over seven years in operation and a community of more than 110,000 crypto traders, Token Metrics has demonstrated consistent performance across multiple market cycles, including both bull and bear markets.
Comprehensive Ecosystem
Beyond indices, Token Metrics offers a complete suite of tools including AI chatbot assistance, moonshot discovery, real-time signals and alerts, trading view indicators, analytics platform, and API access for developers. This ecosystem approach provides everything investors need in one place.
Continuous Innovation
Token Metrics continuously evolves its platform based on market developments and user feedback. Recent innovations include the launch of automated trading bots, integration with Dune Analytics for institutional-grade data, and the expansion of mobile capabilities for portfolio management on the go.
Educational Resources
The platform provides extensive educational content through tutorials, videos, webinars, and detailed investment reports covering blockchain technology, cryptocurrency basics, investment strategies, risk management, and market analysis.
While Token Metrics indices offer significant advantages, it's essential to understand that all cryptocurrency investing carries inherent risks. The market remains highly volatile, and past performance does not guarantee future results.
To invest safely through Token Metrics indices, follow these best practices:
• Never invest more than you can afford to lose
• Use a secure wallet for storing your digital assets
• Avoid emotional trading decisions
• Stick to your predetermined investment strategy
• Use alerts to stay informed of significant market moves
• Regularly review and rebalance your portfolio
• Consult with financial advisors for personalized guidance
Remember that Token Metrics provides research and analytics tools but is not a registered investment adviser or broker-dealer. The platform offers informational and educational resources designed to help investors make more informed decisions, but ultimate investment choices remain with the individual investor.
As cryptocurrency markets continue to mature and institutional adoption accelerates, crypto indices are becoming essential tools for portfolio construction. The ability to gain diversified exposure to digital assets through professionally managed, AI-driven strategies addresses one of the primary barriers to crypto adoption: complexity.
Looking ahead, several trends are shaping the future of crypto indices. Increased regulatory clarity will likely lead to more traditional financial institutions offering crypto index products. The integration of DeFi protocols into index strategies will provide additional yield opportunities.
Advanced AI and machine learning capabilities will enable even more sophisticated portfolio optimization. Cross-chain indices will allow seamless exposure across multiple blockchain ecosystems.
Token Metrics is well-positioned to lead this evolution, with planned expansions including automated trading agents that execute strategies 24/7, enhanced sector-specific indices for emerging crypto narratives, improved mobile applications for portfolio management anywhere, and deeper integration with traditional financial platforms for seamless asset allocation.
Cryptocurrency investing in 2025 is no longer about gambling on individual tokens or following influencer recommendations. It's about leveraging data, artificial intelligence, and proven strategies to build resilient, diversified portfolios capable of capturing market upside while managing downside risk.
Token Metrics' AI-powered crypto indices represent a significant advancement in making professional-grade crypto investing accessible to everyone. By combining sophisticated machine learning algorithms with transparent performance tracking and user-friendly interfaces, the platform empowers both novice and experienced investors to navigate the complex crypto landscape with confidence.
Whether you're looking to make your first foray into cryptocurrency or seeking to optimize an existing portfolio, Token Metrics indices offer a compelling solution. The platform's proven track record, continuous innovation, and commitment to democratizing access to advanced investment strategies make it an essential tool for the modern crypto investor.
As the cryptocurrency market continues to evolve and mature, one thing is clear: indices are no longer merely convenient—they're essential tools for developing a well-formed portfolio of digital assets. With Token Metrics leading the way in AI-powered index innovation, investors have the opportunity to participate in the digital asset revolution with the sophistication and strategic approach it demands.
Start your journey with Token Metrics today and discover how AI-powered crypto indices can transform your investment strategy. With a 7-day free trial and comprehensive educational resources, there's never been a better time to explore the future of crypto investing.
Token Metrics stands apart as one of the few platforms offering AI-powered cryptocurrency indices that adapt to real-time market signals. Its holistic, data-backed approach is designed for both new and seasoned investors, offering clarity, transparency, and robust educational support.
Whether your goal is to diversify, stay ahead of trends, or simplify your investing workflow, Token Metrics delivers a comprehensive research and execution hub trusted by investors worldwide.
Token Metrics crypto indices are built using AI and machine learning models that allow real-time rebalancing, active management, and sector-specific strategies. Traditional index funds typically rebalance quarterly or monthly and do not provide exposure to digital assets or utilize AI-driven selection and allocation.
Both novice and experienced investors can use Token Metrics indices. The platform is designed to simplify portfolio construction, offering actionable analytics and automated recommendations suitable for a wide range of investors, from passive holders to active traders.
Token Metrics indices offer strategies for both long-term and short-term approaches. Some indices focus on fundamental strength and growth potential, which may appeal to long-term holders, while others are constructed for active traders seeking short-term opportunities.
Token Metrics indices can be rebalanced in real-time, with AI algorithms continuously analyzing new data and making adjustments as needed. This enables dynamic risk management and updated recommendations to align with changing market conditions.
No, Token Metrics serves customers worldwide. Its platform and tools support users from over 50 countries, providing global coverage for research, analytics, and index investing in the cryptocurrency markets.
The information contained in this blog is for educational and informational purposes only and does not constitute financial or investment advice. Cryptocurrency markets are volatile, and investing involves risks. Token Metrics is not a registered investment adviser or broker-dealer. Users should conduct their own research and consult qualified professionals before making investment decisions. Past performance is not indicative of future results.
.svg)


.png)
Token Metrics Media LLC is a regular publication of information, analysis, and commentary focused especially on blockchain technology and business, cryptocurrency, blockchain-based tokens, market trends, and trading strategies.
Token Metrics Media LLC does not provide individually tailored investment advice and does not take a subscriber’s or anyone’s personal circumstances into consideration when discussing investments; nor is Token Metrics Advisers LLC registered as an investment adviser or broker-dealer in any jurisdiction.
Information contained herein is not an offer or solicitation to buy, hold, or sell any security. The Token Metrics team has advised and invested in many blockchain companies. A complete list of their advisory roles and current holdings can be viewed here: https://tokenmetrics.com/disclosures.html/
Token Metrics Media LLC relies on information from various sources believed to be reliable, including clients and third parties, but cannot guarantee the accuracy and completeness of that information. Additionally, Token Metrics Media LLC does not provide tax advice, and investors are encouraged to consult with their personal tax advisors.
All investing involves risk, including the possible loss of money you invest, and past performance does not guarantee future performance. Ratings and price predictions are provided for informational and illustrative purposes, and may not reflect actual future performance.


%20Price%20Prediction%202025%2C%202030%20-%20Forecast%20Analysis.png)


.png)

%20Price%20Prediction%20.webp)


%20Price%20Prediction.webp)


%20Price%20Prediction%20Analysis%20-%20Can%20it%20Reach%20%24500%20in%20Future_.png)


