Text Link
Text Link
Text Link
Text Link
Text Link
Thank you! Your submission has been received!
Oops! Something went wrong while submitting the form.

Stop Guessing, Start Trading: The Token Metrics API Advantage

Announcements

Big news: We’re cranking up the heat on AI-driven crypto analytics with the launch of the Token Metrics API and our official SDK (Software Development Kit). This isn’t just an upgrade – it's a quantum leap, giving traders, hedge funds, developers, and institutions direct access to cutting-edge market intelligence, trading signals, and predictive analytics.

Crypto markets move fast, and having real-time, AI-powered insights can be the difference between catching the next big trend or getting left behind. Until now, traders and quants have been wrestling with scattered data, delayed reporting, and a lack of truly predictive analytics. Not anymore.

The Token Metrics API delivers 32+ high-performance endpoints packed with powerful AI-driven insights right into your lap, including:

  • Trading Signals: AI-driven buy/sell recommendations based on real-time market conditions.
  • Investor & Trader Grades: Our proprietary risk-adjusted scoring for assessing crypto assets.
  • Price Predictions: Machine learning-powered forecasts for multiple time frames.
  • Sentiment Analysis: Aggregated insights from social media, news, and market data.
  • Market Indicators: Advanced metrics, including correlation analysis, volatility trends, and macro-level market insights.

Getting started with the Token Metrics API is simple:

  1. Sign up at www.tokenmetrics.com/api
  2. Generate an API key and explore sample requests.
  3. Choose a tier–start with 50 free API calls/month, or stake TMAI tokens for premium access.
  4. Optionally–download the SDK, install it for your preferred programming language, and follow the provided setup guide.

At Token Metrics, we believe data should be decentralized, predictive, and actionable. 

The Token Metrics API & SDK bring next-gen AI-powered crypto intelligence to anyone looking to trade smarter, build better, and stay ahead of the curve. With our official SDK, developers can plug these insights into their own trading bots, dashboards, and research tools – no need to reinvent the wheel.

Research

Regime Switching Explained: Why Smart Crypto Indices Move to Stablecoins

Token Metrics Team
6
MIN

The best trade in crypto isn't always a trade—sometimes it's knowing when to step aside. While traditional indices force you to ride every crash from peak to bottom, regime-switching indices take a smarter approach: participate when conditions warrant, preserve capital when they don't. This systematic method of moving between crypto exposure and stablecoins has become the defining feature of next-generation index products, with Token Metrics leading the implementation through data-driven market signals.

What Is Regime Switching?

Regime switching is a systematic investment approach that classifies market conditions into distinct states—typically "bullish" and "bearish"—then adjusts portfolio positioning accordingly. Unlike static indices that maintain constant exposure regardless of conditions, regime-switching strategies dynamically allocate between risk assets and defensive positions based on quantifiable signals.

In practice for crypto indices:

  • Bullish Regime: Hold the target universe (e.g., Token Metrics' TM Global 100: the top 100 cryptocurrencies by market cap). Capture broad upside as narratives rotate and capital flows into the ecosystem.
  • Bearish Regime: Exit fully to stablecoins (USDC, USDT, or similar). Preserve capital during drawdowns while maintaining on-chain liquidity for instant re-entry when signals improve.

This isn't emotional market timing or gut-feel trading. It's rules-based risk management following consistent, transparent criteria. The decision to switch regimes comes from systematic signals, not fear or greed.

The Traditional Index Problem

Standard crypto indices like market-cap weighted baskets operate on a simple premise: buy the universe, hold forever, rebalance periodically. This works well in prolonged bull markets but fails catastrophically during extended bear cycles.

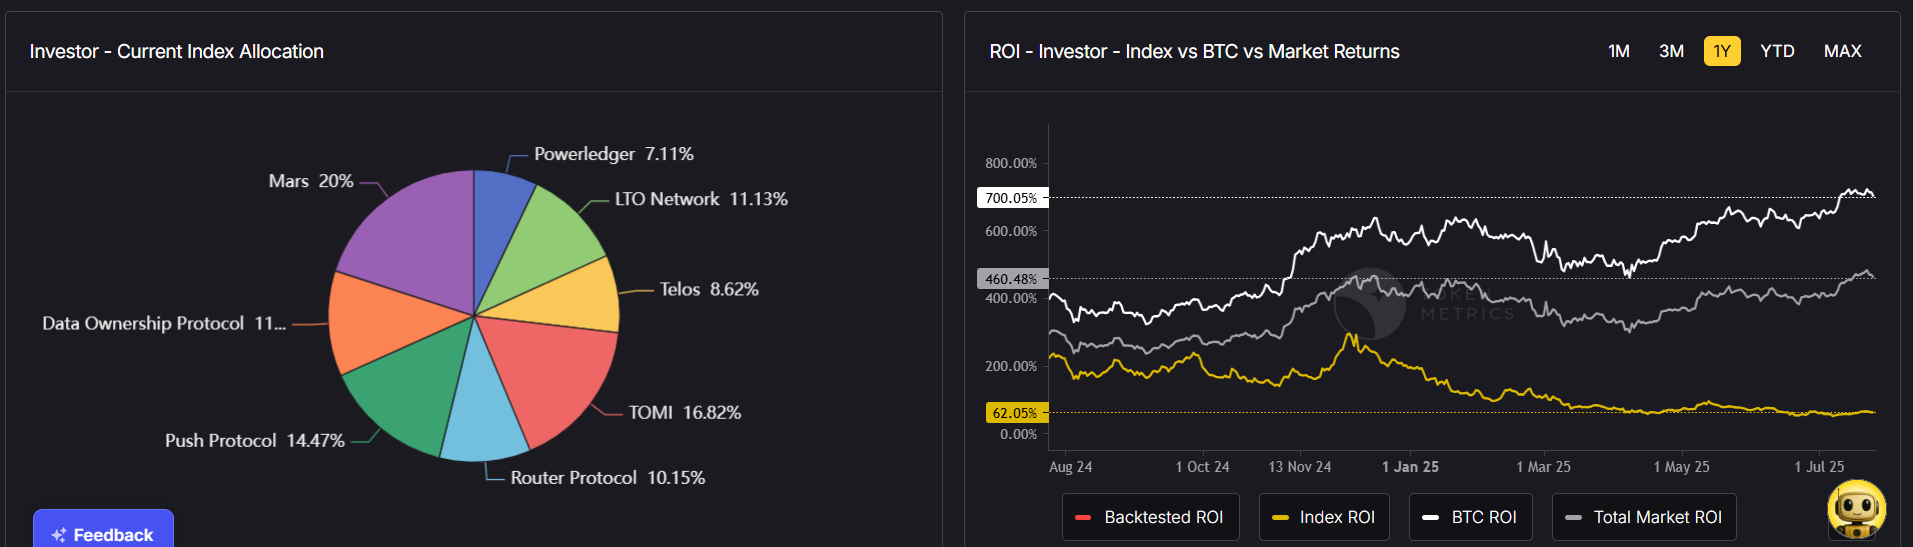
Real performance data illustrates the problem:

  1. 2021 Bull Market: Top-100 index returns: +340%
  2. 2022 Bear Market: Top-100 index drawdown: -73%

Net result: Investors who bought January 2021 and held through December 2022 saw minimal net gains despite experiencing a massive bull run. The issue isn't the bull market capture—traditional indices do fine when prices rise. The problem is forced participation during catastrophic drawdowns that destroy years of gains in months. A 75% drawdown requires a 300% gain just to break even.

Research across historical crypto cycles shows that systematic regime-switching approaches have historically reduced maximum drawdowns by 40-60% while capturing 70-85% of bull market upside—a compelling risk-adjusted return profile that buy-and-hold cannot match.

Why Stablecoins, Not Cash?

Regime-switching crypto indices face a unique constraint: they operate on-chain and must maintain 24/7 liquidity for instant redeployment. This makes stablecoins the optimal defensive asset for several critical reasons:

  • Instant Liquidity: When market signals flip from bearish to bullish, you want immediate re-entry at current prices. Stablecoins enable instant on-chain execution. Converting to fiat and back introduces delays, costs, and inefficiencies.
  • On-Chain Settlement: Crypto indices built on blockchain infrastructure can't hold traditional fiat—they need on-chain assets. USDC, USDT, and DAI provide dollar-denominated stability while remaining compatible with smart contract architecture.
  • Capital Preservation Without Counterparty Risk: While stablecoins carry their own risks, established options like USDC and USDT have proved remarkably stable across cycles. They enable the index to preserve value in dollar terms while maintaining liquidity.

Discover Crypto Gems with Token Metrics AI

Token Metrics uses AI-powered analysis to help you uncover profitable opportunities in the crypto market. Get Started For Free

The Signal Behind the Switch

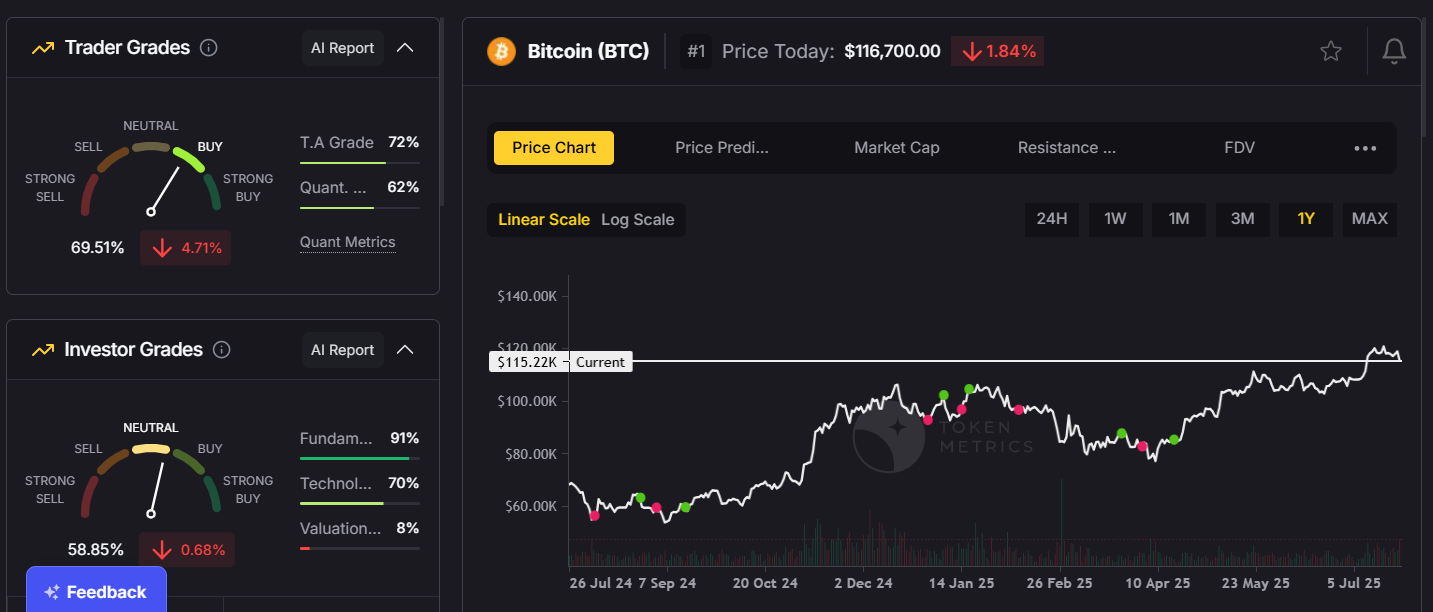
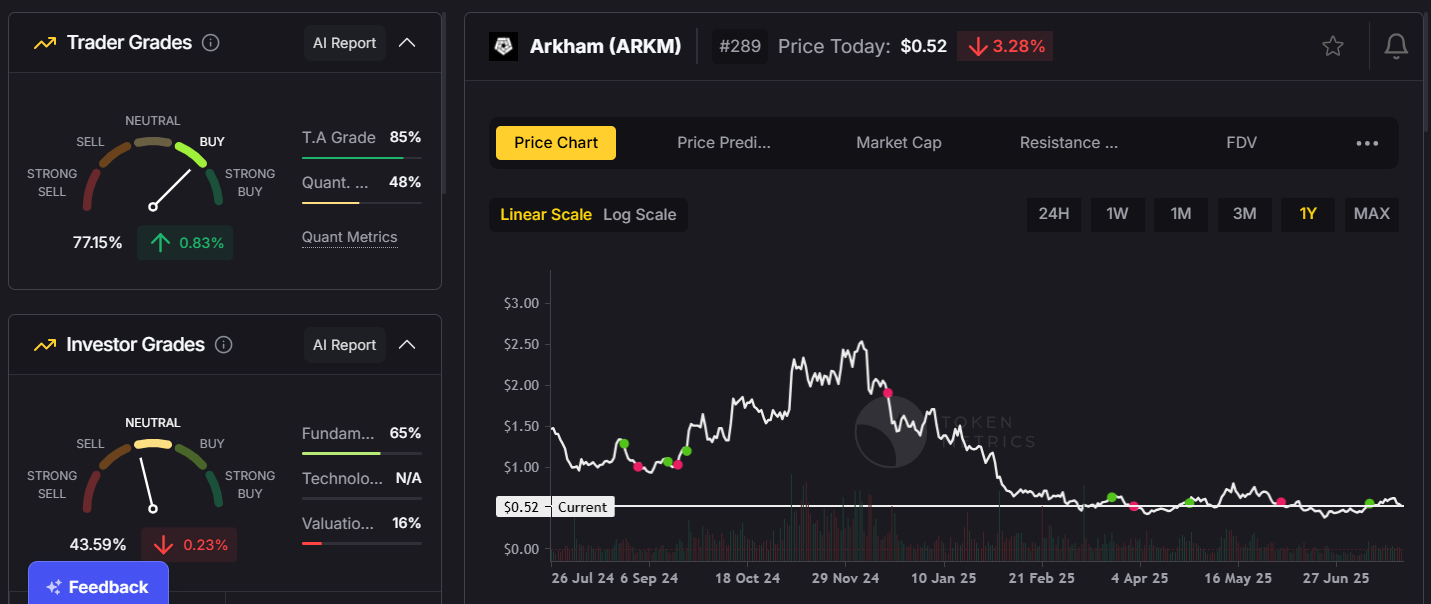
The most critical component of regime-switching isn't the mechanism—it's the signal that triggers the switch. Token Metrics has built its reputation as a leading crypto analytics platform by developing sophisticated, data-driven market intelligence relied upon by over 50,000 traders and investors daily.

Token Metrics' Market Regime Detection employs a proprietary multi-factor model analyzing:

  • Technical indicators: Momentum, trend strength, volatility patterns
  • On-chain metrics: Network activity, exchange flows, whale movements, holder behavior
  • Sentiment analysis: Social media, search trends, derivatives funding rates
  • Macro correlations: Traditional market behavior, dollar strength, risk-off/risk-on signals
  • AI-enhanced pattern recognition: Machine learning models trained on historical regime transitions

This synthesis results in a probabilistic assessment: whether the environment is bullish enough to risk capital or bearish enough to prioritize preservation.

Transparency is maintained by displaying current regime signals in real-time via visual market gauges, while proprietary model parameters and thresholds remain confidential to prevent strategic front-running.

Real Performance: When Regime Switching Matters Most

Regime-switching strategies excel during major bear markets that erode traditional portfolios:

  • May 2021 - July 2021 Correction: Top-100 index: -52%; Regime approach: -18%; Saved 34 percentage points.
  • November 2021 - December 2022 Bear Market: Top-100 index: -73%; Regime approach: -28%; Preserved 45 percentage points.
  • 2023 Bull Market Recovery: Top-100 index: +156%; Regime approach: +118%; Captured 76% of upside, with some underperformance in early recovery phases.

Starting with $100,000 in November 2021, buy-and-hold would result in approximately $89,000 after recovering from -73%. The regime approach, with smaller drawdowns and better upside capture, could have grown the portfolio to around $152,000, emphasizing how avoiding large losses compounds benefits over time.

Implementation: How TM Global 100 Executes Switches

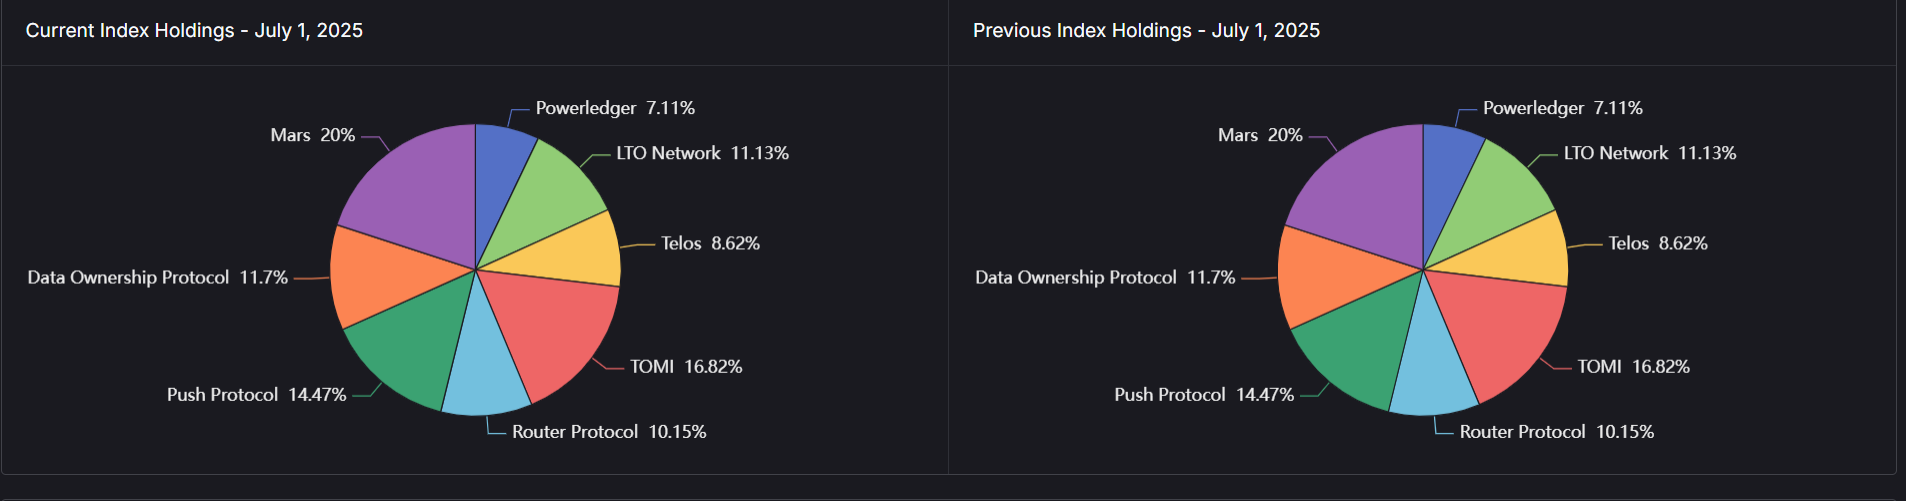
The TM Global 100 index automates regime switching with simplicity and transparency:

User Experience

  • Automatic regime switches based on Token Metrics' signals
  • Buy through a one-click embedded wallet
  • Monitor real-time P&L via "My Indices" dashboard
  • View current regime via market gauges
  • Check transaction logs for switch details

Behind the Scenes

When signals turn bearish, the index:

  • Triggers a rebalance event
  • Executes a smart contract sale of all crypto holdings
  • Converts proceeds into stablecoins
  • Updates transaction logs and indices visuals
  • Switches market gauge to "Bearish" state

Reversal when signals turn bullish follows the same systematic process.

The Cost of Switching

Every regime transition incurs costs:

  • Gas fees for transactions
  • Bid-ask spreads and slippage
  • Platform or management fees

Token Metrics estimates costs at approximately 0.8-1.5% per full switch, which becomes cost-effective when signals reliably avoid large drawdowns. Frequent whipsaws are mitigated by the model's stability factors, and projected costs are shown upfront for transparency.

Decision Framework: Is Regime Switching Right for You?

Consider regime switching if you:

  • Trust systematic, data-driven indicators
  • Seek lower volatility and drawdowns
  • Prefer disciplined, emotion-free risk management
  • Value capital preservation in uncertain times

Alternatively, if you have long-term horizons, believe markets are fully efficient, or prefer a buy-and-hold strategy, it might not suit you. Both approaches have their merits, but regime switching offers a balanced risk-adjusted profile for volatile crypto markets.

Where Research Meets Execution

Token Metrics has established itself as a leading crypto analytics platform by providing:

  • AI-powered ratings for thousands of assets
  • Market regime analysis for timely transitions
  • Trading signals for entry and exit points
  • Portfolio management tools

However, research alone isn't enough. The TM Global 100 index closes the gap between signal generation and automated execution—applying sophisticated regime logic seamlessly, enabling users to act on data-driven insights instantly with transparency and confidence.

Conclusion: Discipline Over Emotion

Regime switching removes emotional decision-making—often the hardest part of crypto investing. It systematically guides investors to participate during bull runs, protect capital during downturns, and avoid knee-jerk reactions to market volatility. This disciplined approach helps to sustain long-term growth while minimizing the pain of large drawdowns, demonstrating the evolution of systematic crypto investment strategies.

Research

Why Manual Crypto Portfolio Management Is Costing You Money (And Time)

Token Metrics Team
6
MIN

You're tracking 50+ tokens across three exchanges, updating your rebalancing spreadsheet every weekend, and second-guessing every exit decision at 2 AM. Sound familiar? Manual crypto portfolio management isn't just exhausting—it's expensive. Between missed rebalances, execution drag, and behavioral mistakes during volatility, DIY portfolio management quietly erodes returns before you see any market gains.

The data tells the story: investors who manually manage diversified crypto portfolios typically underperform comparable automated strategies by 12-18% annually, with 60% of that gap coming from operational inefficiency rather than market timing. If you're spending 10+ hours weekly maintaining positions, those hours have a cost—and it's higher than you think.

The Hidden Costs Destroying Your Returns

Time Drain: The 500-Hour Tax

Managing a diversified crypto portfolio demands constant vigilance. For investors holding 20+ positions, the weekly time investment breaks down to approximately:

  • Market monitoring: 5-8 hours tracking prices, news, and on-chain metrics
  • Rebalancing calculations: 2-3 hours determining optimal weights and required trades
  • Order execution: 3-5 hours placing trades across multiple platforms
  • Record keeping: 1-2 hours logging transactions for tax reporting
  • Research updates: 3-5 hours staying current on project developments

That's 14-23 hours weekly, or 728-1,196 hours annually. At a conservative $50/hour opportunity cost, you're spending $36,400-$59,800 in time value maintaining your portfolio. Even if you value your time at minimum wage, that's still $10,000+ in annual "sweat equity" that automated solutions eliminate.

Execution Drag: Death by a Thousand Trades

Small trades erode portfolios through accumulated friction. Every manual rebalance across a 50-token portfolio requires dozens of individual transactions, each incurring:

  • Trading fees: 0.1-0.5% per trade (average 0.25%)
  • Bid-ask spreads: 0.2-0.8% depending on liquidity
  • Slippage: 0.3-1.2% on smaller cap tokens
  • Gas fees: $2-50 per transaction depending on network congestion

For a $100,000 portfolio rebalanced monthly with 40 trades per rebalance, the costs add up:

  • Average cost per trade: ~$100
  • Monthly execution drag: $4,000
  • Annual execution drag: $48,000 (48% of portfolio value)

The smaller your individual trades, the worse the ratio becomes. A $500 rebalancing trade on a low-liquidity altcoin might pay $25 in fees—a 5% instant loss before any price movement.

Automated indices solve this. TM Global 100, Token Metrics' rules-based index, consolidates 100 individual positions into a single transaction at purchase, with weekly rebalances executed through optimized smart contract batching. Users typically save 3-7% annually in execution costs alone compared to manual approaches.

Behavioral Mistakes: Your Worst Enemy Is in the Mirror

Market psychology research shows that manual portfolio managers tend to make predictable, costly mistakes:

  • Panic selling during drawdowns: When Bitcoin drops 25% in a week, can you stick to your exit rules? Many override their plans during high volatility, often selling near local bottoms.
  • FOMO buying at peaks: Tokens up 300% in a week attract chase behavior, with managers entering after the movement is mostly over.
  • Rebalancing procrastination: Putting off rebalancing leads to drift, holding too much of past winners and missing new opportunities.

Token Metrics' systematic approach removes emotion from the equation. The TM Global 100 Index follows a transparent ruleset: hold the top 100 tokens by market cap during bullish phases, shift to stablecoins during bearish cycles, and rebalance weekly—eliminating emotional override and procrastination.

Missed Rebalances: Drifting Out of Position

Market cap rankings shift constantly. A token ranked #73 on Monday might hit #95 by Friday, or surge to #58. Without systematic rebalancing, your portfolio becomes a collection of recent winners or dumpers.

In Q3 2024, Solana ecosystem tokens surged while Ethereum DeFi tokens consolidated. Manual managers who missed weekly rebalances held too much ETH and insufficient SOL exposure. The result: 15-20% underperformance compared to systematically rebalanced portfolios. Data from Token Metrics shows that weekly rebalancing outperforms monthly or quarterly approaches by 8-12% annually.

Tax Reporting Nightmares

Every trade creates a taxable event. Manual managers executing over 200 trades yearly face:

  • Hours spent compiling transaction logs
  • Reconciliation across multiple exchanges
  • Cost-basis tracking for numerous lots
  • High professional accounting fees ($500-2,000+)

Automated solutions like Token Metrics provide transparent transaction logs for each rebalance, simplifying tax reporting and reducing accounting costs.

The Token Metrics Advantage: Research Meets Execution

Token Metrics has established itself as a leading crypto analytics platform, supporting over 50,000 users with AI-powered token ratings, market regime detection, portfolio optimization tools, and trading signals. But analysis alone isn't enough—implementation is crucial.

TM Global 100 Index bridges this gap. It turns research into actionable, tradeable products by automating rebalancing based on Token Metrics' signals and methodology. One click replaces hours of manual work, following a validated systematic approach.

Automation Without Compromise

The best automation is transparent. TM Global 100 offers:

  • Rules-Based Discipline: Bull markets—hold top 100 tokens; bear markets—move to stablecoins
  • Weekly rebalancing every Monday
  • Full methodology disclosure
  • One-Click execution via embedded self-custodial wallet
  • Real-time market insights and holdings visualization
  • Transaction logs with fees and timestamps

This streamlined process allows users to rapidly execute disciplined rebalancing, saving countless hours and increasing operational efficiency while maintaining asset control.

Decision Framework: When to Automate

Automation suits investors who:

  • Hold 15+ tokens and find rebalancing burdensome
  • Miss optimal rebalancing windows due to time constraints
  • Have experienced emotional trading decisions during volatility
  • Spend over 5 hours a week on portfolio management
  • Want broad exposure without manual tracking

Manual management may be suitable for those with fewer positions, active trading infrastructure, or tactical strategies. For most diversified portfolios, automation enhances efficiency and reduces operational errors.

The Compound Effect of Efficiency

Small inefficiencies compound over time. Over five years, a $50,000 portfolio managed manually with a 12% annual return minus 4-2-1% losses yields roughly a 5% net return, ending at about $63,814. A systematic approach with optimizer integration, zero behavioral errors, and regular rebalancing can attain a 13% net return, reaching approximately $92,246—an increase of over $28,000, not counting time saved.

Conclusion: Time Back, Returns Up

Manual crypto portfolio management made sense when portfolios were small and concentrated. Today’s diversified sets require operational discipline to prevent erosion of returns due to execution drag, missed rebalances, and emotional mistakes. Token Metrics built TM Global 100 to turn research into automated, transparent execution, reclaim your time, and boost portfolio discipline—without sacrificing control.

Research

Moonshots API: Discover Breakout Tokens Before the Crowd

Token Metrics Team
5
MIN

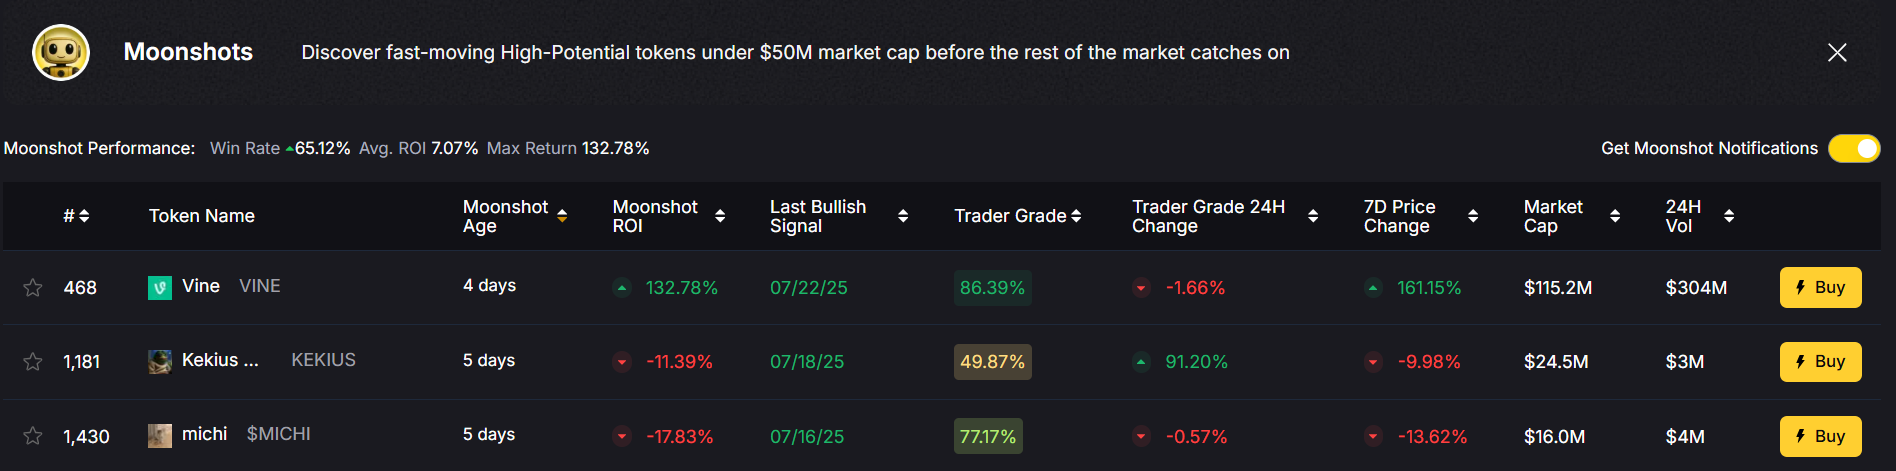
The biggest gains in crypto rarely come from the majors. They come from Moonshots—fast-moving tokens with breakout potential. The Moonshots API surfaces these candidates programmatically so you can rank, alert, and act inside your product. In this guide, you’ll call /v2/moonshots, display a high-signal list with TM Grade and Bullish tags, and wire it into bots, dashboards, or screeners in minutes. Start by grabbing your key at Get API Key, then Run Hello-TM and Clone a Template to ship fast.

What You’ll Build in 2 Minutes

  • A minimal script that fetches Moonshots via /v2/moonshots (optionally filter by grade/signal/limit).
  • A UI pattern to render symbol, TM Grade, signal, reason/tags, and timestamp—plus a link to token details.
  • Optional one-liner curl to smoke-test your key.
  • Endpoints to add next: /v2/tm-grade (one-score ranking), /v2/trading-signals, /v2/hourly-trading-signals (timing), /v2/resistance-support (stops/targets), /v2/quantmetrics (risk sizing), /v2/price-prediction (scenario ranges).

Why This Matters

Discovery that converts. Users want more than price tickers—they want a curated, explainable list of high-potential tokens. The Moonshots API encapsulates multiple signals into a short list designed for exploration, alerts, and watchlists you can monetize.

Built for builders. The endpoint returns a consistent schema with grade, signal, and context so you can immediately sort, badge, and trigger workflows. With predictable latency and clear filters, you can scale to dashboards, mobile apps, and headless bots without reinventing the discovery pipeline.

Where to Find The Moonshots API

The cURL request for the Moonshots endpoint is displayed in the top right of the API Reference. Grab it and start tapping into the potential!

  1. Get API Key — generate a key and start free.
  2. Run Hello-TM — verify your first successful call.
  3. Clone a Template — deploy a screener or alerts bot today.
  4. Compare plans: Scale confidently with API plans.

How It Works (Under the Hood)

The Moonshots endpoint aggregates a set of evidence—often combining TM Grade, signal state, and momentum/volume context—into a shortlist of breakout candidates. Each row includes a symbol, grade, signal, and timestamp, plus optional reason tags for transparency.

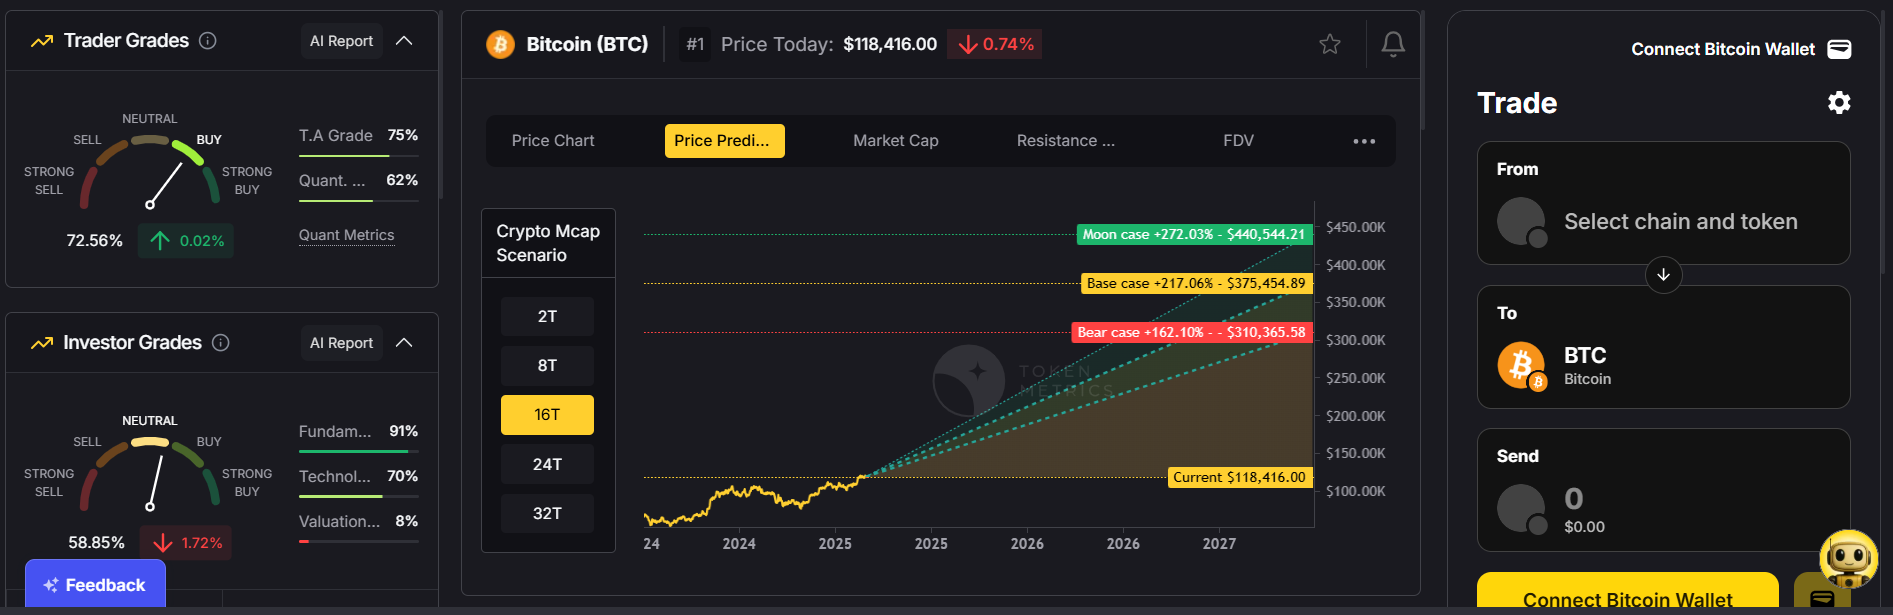
For UX, a common pattern is: headline list → token detail where you render TM Grade (quality), Trading Signals (timing), Support/Resistance (risk placement), Quantmetrics (risk-adjusted performance), and Price Prediction scenarios. This enables users to understand why a token was flagged and how to act with risk controls.

Polling vs webhooks. Dashboards typically poll with short-TTL caching. Alerting flows use scheduled jobs or webhooks to smooth traffic and avoid duplicates. Always make notifications idempotent.

Production Checklist

  • Respect plan caps; batch and throttle in clients/workers.
  • Use exponential backoff with jitter on 429/5xx; capture request IDs.
  • De-duplicate alerts and downstream actions.
  • Use memory/Redis with short TTLs; pre-warm during peak hours.
  • Fetch in pages if supported; parallelize within limits.
  • Sort primarily by tm_grade or composite; surface reason tags to build trust.
  • Track p95/p99, error rates, and alert delivery success; log variants.
  • Store keys securely; rotate regularly.

Use Cases & Patterns

  • Bot Builder (Headless): Filter for tokens appearing in Moonshots with tm_grade ≥ X. Confirm entry with /v2/trading-signals; place stops/targets with /v2/resistance-support; size via Quantmetrics.
  • Dashboard Builder (Product): Moonshots tab with badges (Bullish, Grade 80+, Momentum). Token detail page with TM Grade, Signals, S/R, and Predictions for a complete decision loop.
  • Screener Maker (Lightweight Tools): Top-N list with Follow/alert toggles; export CSV. Include “New this week” and “Graduated” sections for churn/entry dynamics.
  • Community/Content: Weekly digest highlighting new entrants, upgrades, and notable exits—link back to your product pages.

Next Steps

  1. Get API Key — generate a key and start free.
  2. Run Hello-TM — verify your first successful call.
  3. Clone a Template — deploy a screener or alerts bot today.
  4. Compare plans: Scale confidently with API plans.

FAQs

1) What does the Moonshots API return?

A list of breakout candidates with fields such as symbol, tm_grade, signal (often Bullish/Bearish), optional reason tags, and updated_at. Use it to drive discover tabs, alerts, and watchlists.

2) How fresh is the list? What about latency/SLOs?

The endpoint targets predictable latency and timely updates for dashboards and alerts. Use short-TTL caching and queued jobs/webhooks to avoid bursty polling.

3) How do I use Moonshots in a trading workflow?

Common stack: Moonshots for discovery, Trading Signals for timing, Support/Resistance for SL/TP, Quantmetrics for sizing, and Price Prediction for scenario context. Always backtest and paper-trade first.

4) I saw results like “+241%” and a “7.5% average return.” Are these guaranteed?

No. Any historical results are illustrative and not guarantees of future performance. Markets are risky; use risk management and testing.

5) Can I filter the Moonshots list?

Yes—pass parameters like min_grade, signal, and limit (as supported) to tailor to your audience and keep pages fast.

6) Do you provide SDKs or examples?

REST works with JavaScript and Python snippets above. Docs include quickstarts, Postman collections, and templates—start with Run Hello-TM.

7) Pricing, limits, and enterprise SLAs?

Begin free and scale up. See API plans for rate limits and enterprise options.

Recent Posts

No Item Found
Research

Understanding Why Blockchain Transactions Are Irreversible

Token Metrics Team
5
MIN

Introduction

The concept of irreversible transactions is a foundational aspect of blockchain technology and cryptocurrencies. Unlike traditional banking systems where transactions can be reversed or disputed, blockchain transactions are designed to be permanent and unalterable once confirmed. This unique feature raises an important question: why are blockchain transactions irreversible? This article delves into the fundamental principles, technological mechanisms, and security frameworks that underpin transaction irreversibility in blockchains. In addition, it highlights how analytical and AI-driven research platforms such as Token Metrics can help users better understand the underlying dynamics.

Basics of Blockchain Transactions

To answer why blockchain transactions are irreversible, it is essential to understand what constitutes a blockchain transaction. At its core, a blockchain is a decentralized and distributed digital ledger of transactions, grouped into blocks and linked through cryptographic hashes.

  • Transaction creation: Users initiate transactions by digitally signing them with private keys, ensuring authenticity and ownership.
  • Broadcast and validation: Transactions are broadcast to a network of nodes, where consensus algorithms validate and verify them based on predefined rules.
  • Inclusion in blocks: Validated transactions are bundled into a block.
  • Linking blocks into a chain: Each block references the previous block through a cryptographic hash, forming a chronological chain.

Once a transaction is included in a confirmed block, it becomes part of the immutable ledger, considered permanent and irreversible.

Role of Immutability and Cryptography

Immutability is the cornerstone of transaction irreversibility. Blockchain achieves immutability using cryptographic techniques and decentralized consensus.

  • Cryptographic hashes: Each block contains a hash of the previous block, creating a tamper-evident chain. Changing any transaction data in a previous block alters its hash and breaks the chain's continuity.
  • Digital signatures: Transactions are signed by senders using private keys, and their validity is verified through public keys.
  • Decentralization: Since multiple nodes maintain copies of the ledger, altering one copy would require overwhelming control over the network to rewrite history, which is prohibitively difficult.

This design ensures that once a transaction is confirmed and embedded in a block, it is computationally infeasible to modify or reverse it without consensus from the majority of the network.

Consensus Mechanisms and Finality

Consensus algorithms play an essential role in determining when transactions are considered final and irreversible.

  • Proof of Work (PoW): In PoW systems like Bitcoin, miners solve complex puzzles to add new blocks. The longer the subsequent chain grows past a block, the more secure and irreversible the transactions within it become, as rewriting would require significant energy expenditure.
  • Proof of Stake (PoS) and others: Other consensus models like PoS, delegated PoS, or Byzantine Fault Tolerant algorithms offer different methods of achieving agreement but similarly provide guarantees on transaction finality.

Network participants generally treat transactions as irreversible after a certain number of confirmations (additional blocks). This requirement reduces risks from temporary forks or reorganizations.

Technical Challenges to Reversing Transactions

Reversing a blockchain transaction would entail rewriting the blockchain history, which is impeded by several technical realities:

  1. Hash chain dependency: Because every block contains the hash of its predecessor, any change would cascade through the chain, invalidating all subsequent blocks.
  2. Network consensus: The majority of nodes must agree on a change, which is practically impossible in secure, well-distributed networks without control of a 51% attack.
  3. Resource expenditure: The computational power and time required to modify past transactions increase exponentially with block depth.

Therefore, even accidental or malicious attempts to reverse a transaction face insurmountable obstacles.

Practical Implications of Irreversibility

The irreversible nature of blockchain transactions carries both benefits and risks.

  • Benefits: Enhanced security against fraud and censorship, fostering trust in decentralized financial systems.
  • Risks: Users need to exercise caution, as mistakes such as sending to incorrect addresses or falling victim to scams cannot be undone.

Understanding these implications is critical for users engaging with blockchain-based systems, and tools like Token Metrics provide data-driven insights to enhance awareness and decision-making.

How AI and Analytics Support Understanding

With the growing complexity of blockchain ecosystems, AI-driven platforms are increasingly valuable for dissecting transaction behaviors and network health.

  • Transaction analysis: AI can identify patterns, potential risks, or anomalies in blockchain activity.
  • Market insights: Analytical tools can augment research on transaction volumes, confirmation times, and network congestion.
  • Educational resources: Platforms such as Token Metrics leverage AI to provide accessible metrics and ratings that inform users about blockchain projects and technologies.

Utilizing these resources supports a better grasp of the irreversible nature of transactions and the broader blockchain infrastructure.

Conclusion

Blockchain transaction irreversibility is rooted in the technology’s core principles of immutability, decentralization, and consensus-driven finality. These mechanisms collectively ensure that once a transaction is recorded on the blockchain and sufficiently confirmed, it cannot be altered or undone without prohibitive computational effort and majority network control. While irreversible transactions provide robust security and trustlessness, they also emphasize the importance of user diligence. Leveraging AI-powered analytical tools like Token Metrics can enhance comprehension and navigational confidence within blockchain ecosystems.

Disclaimer

This article is intended for educational purposes only and does not constitute financial advice. Readers should conduct their own research using varied sources, including specialized platforms such as Token Metrics, before engaging with blockchain or cryptocurrency activities.

Crypto Basics

What Indicators Should I Use for Technical Crypto Analysis?

Token Metrics Team
8 min
MIN

If you’re serious about trading cryptocurrency, technical analysis (TA) is an essential skill. It helps you understand price movements, predict trends, and identify high-probability entry and exit points.

But with hundreds of technical indicators available, one common question is: “Which indicators should I use for technical analysis?”

In this guide, we’ll break down the most effective indicators for crypto trading, explain how they work, and show you how Token Metrics combines them with AI-driven insights to help you trade smarter.

Why Use Technical Indicators in Crypto?

Unlike traditional stocks, cryptocurrency markets trade 24/7, are more volatile, and are largely driven by sentiment and speculation.

Technical indicators help you:

  • Identify trends (bullish or bearish).

  • Pinpoint support and resistance levels.

  • Detect overbought or oversold conditions.

  • Find entry and exit points with better timing.

The key is not using one indicator in isolation but combining multiple tools for confirmation—which is exactly what Token Metrics does with its AI-driven trading signals.

The Most Important Indicators for Technical Analysis

Here are the must-know indicators for crypto traders:

1. Moving Averages (MA & EMA)

What they do:
Moving averages smooth out price data to help you identify overall market direction.

  • Simple Moving Average (SMA): Calculates the average closing price over a set period (e.g., 50-day, 200-day).

  • Exponential Moving Average (EMA): Gives more weight to recent prices, making it more responsive.

How to use them:

  • Golden Cross: When the 50-day MA crosses above the 200-day MA → bullish signal.

  • Death Cross: When the 50-day MA crosses below the 200-day MA → bearish signal.

Best for:
Spotting long-term trends and momentum.

2. Relative Strength Index (RSI)

What it does:
RSI measures price momentum and identifies overbought (70+) or oversold (30-) conditions.

How to use it:

  • Above 70: Asset may be overbought → possible pullback.

  • Below 30: Asset may be oversold → potential bounce.

Best for:
Finding reversal points and confirming trend strength.

3. Moving Average Convergence Divergence (MACD)

What it does:
MACD measures the relationship between two EMAs (usually 12-day and 26-day) and generates buy/sell signals based on crossovers.

How to use it:

  • Bullish crossover: MACD line crosses above the signal line.

  • Bearish crossover: MACD line crosses below the signal line.

Best for:
Spotting trend changes early.

4. Bollinger Bands

What they do:
Bollinger Bands create a price channel around an asset using a moving average plus/minus two standard deviations.

How to use them:

  • Price near upper band: Potential overbought condition.

  • Price near lower band: Potential oversold condition.

  • Band squeeze: Indicates upcoming volatility.

Best for:
Predicting volatility and identifying breakout opportunities.

5. Volume Indicators (OBV & VWAP)

What they do:
Volume indicators confirm price movements and help spot trend strength.

  • On-Balance Volume (OBV): Tracks buying/selling pressure.

  • VWAP (Volume-Weighted Average Price): Shows average price relative to volume.

Best for:
Confirming whether a trend is supported by strong trading volume.

6. Fibonacci Retracement

What it does:
Identifies key support and resistance levels based on Fibonacci ratios (23.6%, 38.2%, 50%, 61.8%, etc.).

How to use it:

  • Place retracement levels between swing highs and lows to find potential pullback or breakout zones.

Best for:
Setting targets and identifying price zones for entries/exits.

7. Stochastic Oscillator

What it does:
Measures price momentum by comparing closing prices to recent price ranges.

How to use it:

  • Above 80: Overbought.

  • Below 20: Oversold.

  • Use crossovers for potential buy/sell signals.

Best for:
Short-term traders looking for momentum shifts.

8. Ichimoku Cloud

What it does:
Provides a complete view of trend, momentum, and support/resistance levels in one indicator.

How to use it:

  • Price above cloud: Bullish.

  • Price below cloud: Bearish.

  • Cloud crossovers: Signal trend reversals.

Best for:
Swing traders who need multi-factor confirmation in one tool.

How Token Metrics Combines Indicators with AI

Instead of manually tracking dozens of indicators, Token Metrics uses AI to analyze 80+ technical, fundamental, and sentiment-based data points for each asset—giving you actionable insights without the guesswork.

Here’s how:

1. AI-Powered Bullish & Bearish Signals

Our system combines RSI, MACD, MAs, and more to generate real-time buy/sell signals.

2. Trader & Investor Grades

  • Trader Grade: Helps short-term traders focus on cryptos with strong technical setups.

  • Investor Grade: Identifies long-term investment opportunities with strong fundamentals.

3. Narrative Detection

Token Metrics tracks emerging narratives (AI tokens, DeFi, etc.) so you can spot trends before they explode.

4. AI-Managed Indices

Don’t want to analyze charts? Our AI-driven indices automatically rebalance portfolios using technical indicators and market conditions.

How to Combine Indicators Effectively

The most successful traders don’t rely on one indicator. Instead, they combine them for confirmation.

Example:

  • Use RSI to spot oversold conditions.

  • Confirm with MACD bullish crossover.

  • Check volume to ensure strong buying pressure.

When multiple indicators align, your trade has a higher probability of success—and Token Metrics does this automatically.

Advanced Tips for Using Indicators

  1. Don’t Overload: Use 3–5 indicators for clarity.

  2. Adjust for Volatility: Crypto is more volatile than stocks—shorten timeframes for faster signals.

  3. Combine With Fundamentals: Use Token Metrics Investor Grades to pair TA with project fundamentals.

  4. Practice Risk Management: Even the best indicators fail—always use stop-loss orders.

Final Thoughts

So, what indicators should you use for technical analysis?

Start with moving averages, RSI, MACD, Bollinger Bands, and Fibonacci levels—then add volume indicators and advanced tools like the Ichimoku Cloud as you gain experience.

But here’s the truth: indicators are only as good as the trader using them. That’s why Token Metrics simplifies the process by combining dozens of technical indicators with AI-powered analysis, giving you clear, actionable insights for smarter trades.

Whether you’re a day trader or a long-term investor, Token Metrics helps you use technical indicators strategically—not emotionally.

Research

Understanding Cryptocurrency: A Comprehensive Guide

Token Metrics Team
4
MIN

What is Cryptocurrency?

Cryptocurrency is a form of digital or virtual currency that uses cryptography for security, making it difficult to counterfeit or double-spend. Unlike traditional currencies issued by governments and central banks, cryptocurrencies operate on decentralized networks based on blockchain technology. This decentralization allows for peer-to-peer transactions without intermediaries such as banks.

The concept emerged with the introduction of Bitcoin in 2009, which paved the way for numerous other cryptocurrencies designed to serve various purposes within digital ecosystems.

Blockchain Technology Basics

At the core of cryptocurrencies lies blockchain, a distributed ledger that records all transactions across a network of computers (nodes). Each transaction is grouped into a block, which is then cryptographically linked to the previous block, forming a chain.

  • Decentralization: No single entity controls the blockchain; this distributes trust among participants and enhances security.
  • Transparency: All transactions are visible to participants, ensuring accountability.
  • Immutability: Once recorded, transactions cannot be altered, ensuring data integrity.

This technology underpins various cryptocurrencies and offers applications beyond currency, including smart contracts and decentralized applications (dApps).

How Cryptocurrency Works

When a user initiates a cryptocurrency transaction, it is broadcast to the network of nodes. These nodes verify the transaction’s validity through consensus mechanisms such as Proof of Work (PoW) or Proof of Stake (PoS).

  • Verification: Nodes confirm that the sender has sufficient funds and that the transaction follows protocol rules.
  • Consensus: The network agrees on the transaction's legitimacy via consensus algorithms.
  • Recording: Verified transactions are added to the blockchain as blocks.

Users store cryptocurrencies in digital wallets protected by private keys, which are critical for accessing and authorizing transactions.

Types of Cryptocurrencies

The cryptocurrency landscape is diverse, including:

  • Bitcoin (BTC): The first and most widely recognized cryptocurrency, mainly used as digital gold.
  • Altcoins: Alternative cryptocurrencies such as Ethereum (ETH), which supports smart contracts and decentralized applications.
  • Stablecoins: Cryptocurrencies pegged to stable assets like fiat currencies to reduce volatility.
  • Tokens: Digital assets created on existing blockchains representing various utilities or assets.

Understanding these distinctions is essential for analyzing different crypto projects and their use cases.

Researching Cryptocurrency

Due to the complexity and rapid evolution of the crypto space, thorough research is essential. Key approaches include:

  • Fundamental Analysis: Assess project goals, team credibility, technology, and market applicability.
  • Technical Analysis: Study price charts and market trends, while acknowledging the volatility inherent in crypto markets.
  • Security Considerations: Evaluate the blockchain’s robustness and the security of wallets and exchanges.
  • Utilizing Analytical Tools: Platforms like Token Metrics leverage AI to offer ratings and insights, aiding users in making informed evaluations.

Benefits and Challenges of Cryptocurrency

Benefits:

  • Decentralization: Reduces reliance on centralized institutions.
  • Financial Inclusion: Provides access to financial services globally, especially to unbanked populations.
  • Transparency and Security: Blockchain's design increases trust and reduces fraud.

Challenges:

  • Volatility: Cryptocurrency prices can be highly volatile.
  • Regulatory Uncertainty: Evolving regulations vary by jurisdiction, affecting use and development.
  • Scalability: Some networks face issues processing large volumes of transactions rapidly.
  • Security Risks: Risks such as theft of private keys and vulnerabilities in smart contracts.

How AI and Analytical Tools Support Cryptocurrency Analysis

The introduction of AI-driven research tools has transformed how individuals dissect the vast and complex cryptocurrency markets. Platforms like Token Metrics employ machine learning and natural language processing techniques to analyze various data streams including market sentiment, on-chain metrics, and project fundamentals.

These tools provide:

  • Quantitative Ratings: Assessing the strength and potential of different cryptocurrencies.
  • Scenario Modelling: Projecting possible market developments under various conditions.
  • Risk Analysis: Identifying vulnerabilities and risk factors in crypto projects.

Users can complement traditional research methods with AI insights to foster a balanced understanding.

Conclusion and Disclaimer

Cryptocurrency represents a revolutionary shift in digital finance, enabled by blockchain technology and supported increasingly by AI analytics. Understanding its fundamentals, technology, and associated risks is essential for meaningful engagement.

This article is for educational purposes only and does not constitute financial advice. Readers should conduct independent research and consult professionals before making decisions related to cryptocurrencies.

Crypto Basics

How Do Taxes Work for Crypto Trading?

Token Metrics Team
5 min
MIN

Cryptocurrency trading can be exciting and profitable, but one thing many traders overlook is taxation. Whether you’re buying Bitcoin, trading altcoins, or earning staking rewards, your activities can create taxable events—and failure to report them properly can lead to hefty penalties.

If you’ve been wondering, “How do taxes work for crypto trading?”, this guide breaks it all down. We’ll explain how crypto taxes work, the most common taxable events, and how Token Metrics can help you make smarter, tax-conscious trading decisions.

Are Cryptocurrencies Taxed?

Yes. In most countries, cryptocurrencies are treated as property, not currency, for tax purposes. This means:

  • Buying crypto with fiat (e.g., USD → BTC) is not taxable by itself.

  • Selling, swapping, or spending crypto is a taxable event.

  • Earning crypto (through staking, mining, or airdrops) is taxable income.

While tax laws vary by country, the principle is the same: any gain or income from crypto is subject to taxation.

Common Taxable Events in Crypto

To manage your taxes effectively, you need to know what counts as a taxable event.

1. Selling Crypto for Fiat

If you sell Bitcoin, Ethereum, or any other crypto for fiat currency, you must report capital gains or losses.

Example:

  • You bought 1 BTC for $20,000 and sold it for $40,000.

  • Your capital gain is $20,000—which is taxable.

2. Trading One Crypto for Another

Swapping one crypto for another (e.g., BTC → ETH) is also a taxable event.

Why?

  • You’re considered to have “sold” BTC at its fair market value and “bought” ETH.

3. Spending Crypto on Goods or Services

Using crypto to buy a car, laptop, or coffee? That’s a taxable event too.

Example:

  • You bought 1 ETH at $1,000.

  • You used it to buy goods when ETH was worth $2,000.

  • The $1,000 gain is taxable.

4. Earning Crypto

  • Staking & Mining Rewards: Counted as ordinary income at the time you receive them.

  • Airdrops & Hard Forks: The value at the time you receive them is taxable income.

5. DeFi & NFT Transactions

DeFi activities like yield farming, lending, or NFT trading may also trigger complex taxable events depending on jurisdiction.

Capital Gains: Short-Term vs. Long-Term

When you sell crypto, your profit is classified as a capital gain—either short-term or long-term.

  • Short-Term Gains:


    • Assets held less than 12 months.

    • Taxed at your ordinary income tax rate (higher).

  • Long-Term Gains:


    • Assets held more than 12 months.

    • Taxed at reduced capital gains rates (in many jurisdictions).

Pro Tip: Holding crypto for at least a year can significantly lower your tax burden.

How to Calculate Your Crypto Taxes

Step 1: Track Every Transaction

Record:

  • Date & time of the trade.

  • Type of transaction (buy, sell, swap).

  • Amount & value in fiat currency.

  • Fees paid.

Step 2: Determine Cost Basis

Your cost basis is how much you paid for the asset (including fees).

Step 3: Calculate Gains/Losses

Subtract your cost basis from the selling price:

  • Profit = Taxable gain

  • Loss = Tax-deductible (in some countries).

Step 4: Report Income

Report staking, mining, and airdrop rewards as ordinary income at their market value when received.

How Token Metrics Helps with Tax-Efficient Trading

Staying compliant doesn’t just mean reporting correctly—it means trading smartly to reduce your tax burden. That’s where Token Metrics can help.

1. AI-Powered Portfolio Tracking

Track all your crypto holdings across exchanges and wallets, making tax reporting easier.

2. Long-Term vs. Short-Term Insights

Use Investor Grades to identify cryptos worth holding long-term, reducing your tax liability on gains.

3. Strategic Trade Timing

Get AI-powered trading signals to make smarter decisions on when to sell—balancing profits and taxes.

4. Narrative Tracking

Spot emerging narratives (AI tokens, DeFi trends) early, allowing you to plan tax-friendly entries and exits.

Strategies to Minimize Crypto Taxes

  1. Hold for Over a Year: Qualify for long-term capital gains rates.

  2. Harvest Losses: Sell underperforming assets to offset taxable gains.

  3. Use Tax-Friendly Accounts: Some countries allow crypto investments in tax-advantaged accounts.

  4. Gift Crypto: In certain jurisdictions, gifting crypto can reduce tax exposure.

  5. Use AI for Smart Exits: Token Metrics can help you plan trades strategically to minimize taxable events.

Common Mistakes to Avoid

  • Not tracking transactions: Without records, you can’t calculate accurate gains/losses.

  • Ignoring swaps: Trading crypto-to-crypto is still taxable.

  • Forgetting airdrops/staking rewards: These are considered income at receipt.

  • Panic-selling without strategy: Leads to high taxes and missed opportunities.

Global Variations in Crypto Taxes

Tax treatment varies by country:

  • U.S.: IRS treats crypto as property.

  • UK: HMRC applies Capital Gains Tax on disposals.

  • Australia: ATO taxes crypto as property.

  • EU: Policies vary by member state but generally treat crypto as assets.

Always consult a crypto tax professional for advice in your jurisdiction.

Practical Example

Let’s say you:

  • Bought 2 ETH at $1,500 each ($3,000 total).

  • Sold 1 ETH at $3,000.

  • Your gain: $1,500 (minus fees).

  • If you held for over a year, you pay long-term capital gains tax. If not, it’s short-term at a higher rate.

With Token Metrics, you could track purchase dates and AI signals to time your exit strategically—potentially saving on taxes.

Final Thoughts

So, how do taxes work for crypto trading?

  • Selling, swapping, and spending crypto are taxable events.

  • Staking, mining, and airdrops are taxed as income.

  • Holding for over a year often reduces your tax bill.

The key to staying compliant and minimizing taxes is tracking transactions, planning trades strategically, and using the right tools.

That’s where Token Metrics helps. With AI-driven portfolio tracking, tax-efficient trading insights, and market analytics, Token Metrics empowers you to trade smarter, reduce taxable events, and keep more of your profits.

Don’t just trade crypto—trade tax-smart.

Research

What Are Limit Orders vs. Market Orders?

Token Metrics Team
8 min
MIN

When you trade cryptocurrency, you’ll come across different types of orders—market orders and limit orders being the two most common. Understanding how they work is essential for controlling your entry and exit points, minimizing slippage, and making better trading decisions.

If you’ve ever wondered, “What’s the difference between limit orders and market orders?”, you’re in the right place. This guide will break it down in detail, explain when to use each, and show how Token Metrics helps you execute smarter trades with AI-powered insights.

What Is a Market Order?

A market order is the simplest type of trade. It tells an exchange:

“Buy or sell this cryptocurrency at the best available price right now.”

How It Works:

  • When you place a market order to buy, the system instantly matches you with sellers at the lowest available price.

  • When you place a market order to sell, it instantly matches you with buyers at the highest available price.

Advantages of Market Orders:

  1. Instant Execution: Your trade goes through immediately.

  2. Simplicity: Perfect for beginners who want fast transactions.

  3. Useful in High-Volatility Conditions: If you need to enter or exit a trade quickly, market orders are your best bet.

Disadvantages of Market Orders:

  1. Slippage: If liquidity is low or the market moves quickly, you might pay more (or receive less) than expected.

  2. No Price Control: You accept whatever price the market offers at that moment.

Example:
If Bitcoin is trading at $40,000 and you place a market order for 1 BTC, you may end up paying $40,050 if the price moves up in the milliseconds it takes to execute your trade.

What Is a Limit Order?

A limit order gives you more control. It tells an exchange:

“Buy or sell this cryptocurrency at this specific price (or better).”

How It Works:

  • When you place a buy limit order, you set the maximum price you’re willing to pay.

  • When you place a sell limit order, you set the minimum price you’re willing to accept.

  • The order stays open until the market reaches your price—or until you cancel it.

Advantages of Limit Orders:

  1. Price Control: You won’t pay more (or sell for less) than your chosen price.

  2. Better for Planning: Ideal for setting up trades without constantly watching the market.

  3. Lower Fees: Some exchanges offer lower “maker” fees for limit orders since they add liquidity.

Disadvantages of Limit Orders:

  1. No Guarantee of Execution: If the market doesn’t reach your price, your order won’t go through.

  2. Slower Execution: Not suitable for urgent trades in fast-moving markets.

Example:
If Bitcoin is trading at $40,000, you could set a buy limit order at $39,500. If the price dips to that level, your order fills. If it doesn’t, you won’t buy.

Limit Orders vs. Market Orders: Key Differences

When Should You Use Market Orders?

Market orders are best when:

  • You need speed: Entering or exiting a trade quickly.

  • The market is highly liquid: For large-cap coins like Bitcoin and Ethereum, slippage is minimal.

  • News-based trading: When reacting to breaking news or sudden price surges.

When Should You Use Limit Orders?

Limit orders are best when:

  • You want price control: Setting entries at discount levels or selling at specific profit targets.

  • You’re trading low-liquidity coins: Prevents overpaying due to slippage.

  • You’re building a strategy: Setting multiple entries and exits without active monitoring.

How Token Metrics Helps You Use Market & Limit Orders Effectively

Placing orders is one thing—placing them at the right time is what makes you profitable. That’s where Token Metrics helps.

1. AI-Powered Trading Signals

Get real-time bullish and bearish alerts based on 80+ technical indicators, helping you know when to execute market or limit orders for maximum efficiency.

2. Trader & Investor Grades

Use Trader Grades for short-term trading opportunities (perfect for market orders) and Investor Grades for long-term accumulation (ideal for limit orders).

3. Narrative Tracking

Our AI identifies emerging narratives—like AI tokens or DeFi plays—so you can strategically place limit orders before trends take off.

4. AI-Managed Indices

Don’t want to place manual orders? Token Metrics’ AI-managed portfolios automatically rebalance based on market conditions, helping you avoid constant order management.

Practical Example: Combining Both Orders

Imagine you’re trading Ethereum (ETH):

  • Step 1: Token Metrics issues a bullish signal at $2,400, projecting a potential breakout.

  • Step 2: You place a market order to enter quickly at $2,400 to catch the momentum.

  • Step 3: You set a limit sell order at $2,700 to automatically secure profits without monitoring the chart.

This combination allows you to enter fast and exit smart—with less emotional stress.

Advanced Tips for Using Limit & Market Orders

  1. Use Stop-Limit Orders: Combine stop-loss and limit functions to protect against big losses.

  2. Layer Your Limit Orders: Place multiple buy/sell limits at different price levels for better cost averaging.

  3. Avoid Market Orders on Illiquid Coins: Slippage can cost you significantly.

  4. Use AI for Timing: Token Metrics helps you time entries and exits—so you’re not just placing random orders.

Final Thoughts

So, what’s the difference between limit orders and market orders?

  • Market orders are for speed—you get the trade done instantly at the best available price.

  • Limit orders are for control—you set the exact price you want to buy or sell.

The key is knowing when to use each—and using data-driven insights to make those decisions.

That’s where Token Metrics gives you an edge. With AI-powered trading signals, narrative tracking, and automated portfolio tools, Token Metrics helps you decide when to use market vs. limit orders, so you can trade confidently and profitably.

In crypto trading, timing is everything—and Token Metrics makes timing smarter.

Research

How Do I Manage Risk in Crypto Trading?

Token Metrics Team
8 min
MIN

Cryptocurrency trading can be highly profitable—but it’s also one of the riskiest markets in the world. Prices can swing wildly in seconds, projects can collapse overnight, and emotional decisions often lead to costly mistakes.

If you want to survive (and thrive) in crypto trading, you must learn how to manage risk effectively. In this guide, we’ll break down why risk management is critical, the top strategies to protect your capital, and how Token Metrics can help you trade smarter, safer, and with more confidence using AI-driven insights.

Why Risk Management Is Non-Negotiable in Crypto

In traditional markets, a 5% price movement is big news. In crypto? Daily moves of 10–20% are normal.

  • High volatility: Crypto is more speculative than stocks or forex.
  • Unregulated space: Scams and market manipulation are more common.
  • Emotional trading: Fear and FOMO lead to poor decisions.

Without a solid risk management plan, even experienced traders can lose everything.

Top Risk Management Strategies for Crypto Trading

1. Only Invest What You Can Afford to Lose

This is rule number one.

  • Never invest rent, emergency savings, or money you can’t afford to lose.
  • Treat crypto like a high-risk asset class—because it is.

2. Diversify Your Portfolio

Don’t put all your funds into one token.

  • Spread across different coins & sectors: Bitcoin, Ethereum, AI tokens, DeFi, etc.
  • Balance risk levels: Mix large-cap coins with small-cap moonshots.

How Token Metrics Helps:
Use AI-driven indices to build a diversified, auto-rebalanced portfolio aligned with your risk tolerance.

3. Use Stop-Loss Orders

Set stop-loss levels to automatically sell if prices fall below a certain threshold.

  • Prevents small losses from becoming catastrophic.
  • Helps maintain discipline during market dips.

Pro Tip: Place stops at strategic support levels, not random round numbers.

4. Size Your Positions Properly

Don’t go “all-in” on one trade.

  • Position sizing ensures no single trade wipes out your portfolio.
  • A common rule: risk 1–2% of your capital per trade.

5. Avoid Overleveraging

Leverage amplifies gains—but also losses.

  • Start with low or no leverage until you’re experienced.
  • High leverage trading can lead to instant liquidation in volatile markets.

6. Keep Emotions in Check

Fear, greed, and FOMO (fear of missing out) destroy portfolios.

  • Stick to your strategy.
  • Don’t chase pumps or panic-sell during dips.

How Token Metrics Helps:
Our AI-powered bullish and bearish signals take emotions out of trading by giving you data-backed entry and exit points.

7. Stay Informed

Markets move on news—regulations, partnerships, or even tweets.

  • Follow credible sources for updates.
  • Use narrative tracking to spot market-shifting trends early.

How Token Metrics Helps:
Our AI tracks emerging narratives (e.g., AI tokens, DeFi, RWAs), so you can adjust positions before the crowd reacts.

8. Use Risk/Reward Ratios

Before entering a trade, ask:

  • Is the potential reward worth the risk?
  • Aim for at least a 2:1 or 3:1 reward-to-risk ratio.

9. Practice Secure Asset Storage

Risk management isn’t just about trades—it’s also about keeping your crypto safe.

  • Use hardware wallets for long-term holdings.
  • Enable 2FA on exchanges.

10. Review & Adjust Your Strategy

Markets evolve—your plan should too.

  • Track your wins and losses.
  • Optimize your strategy using performance data.

How Token Metrics Helps You Manage Risk

Token Metrics isn’t just a research platform—it’s an AI-powered risk management assistant.

1. AI-Powered Trade Insights

Get real-time bullish and bearish signals to time entries and exits more effectively—reducing impulsive trades.

2. Trader & Investor Grades

Quickly assess tokens for short-term trading potential (Trader Grade) or long-term viability (Investor Grade)—helping you avoid high-risk projects.

3. AI-Managed Indices

Use auto-rebalanced AI indices to maintain diversification and reduce risk exposure.

4. Moonshot Finder

Interested in high-risk, high-reward tokens? Our Moonshot Finder filters low-cap projects using AI, helping you avoid scams and rug pulls.

5. Narrative Detection

Our AI tracks emerging narratives so you can anticipate market movements early—reducing exposure to collapsing trends.

Example: Risk Management Using Token Metrics

Imagine you want to invest $5,000 in crypto:

  • Without Token Metrics: You randomly choose 3 coins based on hype and YouTube videos. Two collapse, and your portfolio drops 50%.

  • With Token Metrics: You build a diversified AI-managed index of large-cap and promising small-cap tokens, use stop-loss levels, and set alerts for bullish/bearish signals. Your portfolio drops only 10% in a downturn—saving thousands.

This is how data-driven trading transforms risk into opportunity.

Practical Risk Management Checklist

  1. Never invest more than you can afford to lose.

  2. Diversify across coins and sectors.

  3. Use stop-loss orders to cap losses.

  4. Avoid overleveraging at all costs.

  5. Set realistic reward-to-risk ratios (2:1 or better).

  6. Use AI-powered tools like Token Metrics for smarter trades.

  7. Stay informed about news and emerging narratives.

  8. Secure your assets with hardware wallets and 2FA.

  9. Track and adjust your trading strategy regularly.

  10. Trade with logic, not emotions.

Final Thoughts

So, how do you manage risk in crypto trading? It’s about balancing your portfolio, using smart tools, and staying disciplined.

While volatility is unavoidable, you can control how much you’re exposed to it. With Token Metrics, you gain AI-powered insights, trade signals, and portfolio tools that help you reduce risks while maximizing opportunities.

In crypto, it’s not just about making profits—it’s about keeping them.

Research

What’s the Best Time to Trade Cryptocurrency?

Token Metrics Team
8 min
MIN

Cryptocurrency trading is a 24/7 market—unlike stocks, there’s no opening or closing bell. This leads many traders to wonder: “When is the best time to trade cryptocurrency?”

The truth is, timing your trades can make a huge difference in profitability. Trading during periods of high liquidity or increased volatility can provide better opportunities, while poorly timed trades can lead to slippage and losses.

In this guide, we’ll explore the best times to trade crypto, how different time zones affect price movements, and how Token Metrics can help you identify the right moments to enter or exit trades using AI-powered insights.

Why Timing Matters in Crypto Trading

Even though the crypto market never sleeps, trading activity is not equal throughout the day.

  • High liquidity: When more traders are active, spreads are tighter, making it easier to enter and exit trades at good prices.
  • Volatility opportunities: Price swings create profit potential—but also risk.
  • Market overlaps: When multiple regions are active, volume surges.

Knowing when the market is most active can help you reduce trading fees, minimize slippage, and maximize your gains.

The Best Times to Trade Cryptocurrency

1. Overlap Between U.S. and European Markets (1:00 PM – 5:00 PM UTC)

The busiest period for crypto trading is when U.S. and European sessions overlap.

  • Why?

    • The U.S. is home to major crypto exchanges and institutional traders.
    • Europe contributes significant trading volume and liquidity.

  • Benefits:

    • Higher volatility for short-term traders.
    • Tighter spreads for efficient execution.

This overlap often sees the biggest price movements of the day—perfect for day traders and scalpers.

2. Early U.S. Trading Hours (12:00 PM – 3:00 PM UTC)

The start of the U.S. session brings increased activity from institutional investors and retail traders waking up to market news.

  • Best for:

    • News-based trades (after U.S. economic announcements).
    • Entering/exiting positions with high liquidity.

3. Weekend Volatility (Saturday & Sunday)

Crypto is unique because weekend trading can be extremely volatile due to:

  • Lower liquidity (fewer institutional players).
  • Retail-driven price movements.

  • Who benefits:

    • Swing traders looking for sharp moves.
    • Those willing to tolerate higher risk for bigger gains.

4. After Major News & Events

The “best time” isn’t always about the clock—it’s about market catalysts.

  • Regulatory updates.
  • Exchange announcements.
  • Macro events (interest rate changes, economic data).

These events can cause instant surges or drops—great for traders who react quickly.

Does the Day of the Week Matter?

Yes. Research shows:

  • Mondays & Fridays: Often more volatile as traders adjust positions before/after the weekend.
  • Midweek (Tuesday–Thursday): Tends to have steady, higher trading volumes.

For swing traders, entering positions midweek may reduce erratic weekend exposure.

How Token Metrics Helps You Trade at the Right Time

Timing trades isn’t just about watching charts—it’s about analyzing multiple data points in real time. That’s where Token Metrics gives you a powerful edge.

1. AI-Powered Trading Signals

Get real-time bullish and bearish alerts based on 80+ data points, helping you know when to enter or exit trades confidently.

2. Narrative Tracking

Our AI monitors emerging crypto narratives (AI tokens, DeFi, RWA, etc.) so you can act before the crowd—crucial for timing market moves.

3. Trader & Investor Grades

Use Trader Grades for short-term opportunities and Investor Grades for long-term positions, aligning your trades with market momentum.

4. AI-Driven Indices

Don’t want to time trades manually? Token Metrics offers auto-managed crypto indices that rebalance based on AI-identified market conditions.

Tips for Timing Crypto Trades

  1. Trade During High Liquidity Windows: Overlaps between U.S. and European sessions are best.
  2. Watch for News: Major announcements can create rapid price moves—be ready.
  3. Avoid Low-Volume Hours: Late-night trading (UTC) often has higher slippage.
  4. Use AI for Precision: Let Token Metrics guide entry and exit points with data-backed insights.
  5. Set Alerts: Use Token Metrics’ customizable alerts for price, grades, and signals so you never miss an opportunity.

Example: Using Token Metrics for Timing

Imagine you’re planning to trade Ethereum. Instead of guessing when to enter:

  • You use Token Metrics Trader Grades to spot when ETH has strong short-term potential.
  • You set AI-powered alerts for price changes and bullish signals.
  • You execute your trade during the U.S.-EU overlap when liquidity is highest—reducing slippage and maximizing efficiency.

This data-driven approach takes the guesswork out of timing.

Final Thoughts

So, what’s the best time to trade cryptocurrency?

  • Weekdays during the U.S.-EU overlap (1:00–5:00 PM UTC) offer the best liquidity and volatility.
  • Early U.S. hours and weekends can also present opportunities—but with higher risks.
  • Major news events often create the best entry/exit windows.

But the truth is, there’s no universal “perfect time.” The real key is using data-driven insights to trade at your best time—when probabilities are in your favor.

That’s why Token Metrics is essential for traders. With AI-powered trading signals, narrative tracking, and portfolio management tools, Token Metrics helps you time the market intelligently, not emotionally.

Whether you’re a day trader chasing volatility or a long-term investor, Token Metrics puts the right data at your fingertips—so you can trade with confidence, anytime.

Research

How Do I Keep My Cryptocurrency Safe?

Token Metrics Team
8 min
MIN

The cryptocurrency market has created life-changing wealth for millions, but it has also attracted hackers, scammers, and bad actors. From exchange hacks to phishing scams and rug pulls, billions of dollars in crypto have been lost due to poor security practices.

If you’re serious about trading or investing in crypto, one of your top priorities should be keeping your cryptocurrency safe. In this guide, we’ll walk through the biggest risks to your crypto security, best practices to protect your assets, and how Token Metrics can help you make informed, safe decisions when navigating the crypto market.

Why Is Cryptocurrency Security So Important?

Unlike a traditional bank account, cryptocurrency transactions are irreversible. If your funds are stolen, there’s usually no way to recover them.

  • No centralized authority: There’s no bank to call for refunds.
  • Pseudonymous transactions: It’s nearly impossible to trace funds once they’re moved.
  • High-value targets: Hackers actively target crypto investors due to the potential for large payoffs.

This means you are your own bank—and you’re responsible for protecting your funds.

Common Threats to Your Cryptocurrency

Before learning how to protect your crypto, you need to know what you’re up against:

1. Exchange Hacks

Crypto exchanges are frequent targets for hackers. Even top-tier exchanges like Mt. Gox and FTX have experienced devastating losses.

2. Phishing Attacks

Scammers use fake websites, emails, or social media accounts to trick you into revealing your private keys or login credentials.

3. Malware & Keyloggers

Cybercriminals install malicious software on your devices to steal passwords and seed phrases.

4. Rug Pulls & Scams

Fraudulent projects lure investors with promises of high returns, then disappear with the funds.

5. Human Error

Lost passwords, mishandled private keys, or accidental transfers can lead to permanent loss of funds.

How to Keep Your Cryptocurrency Safe

Here’s a step-by-step approach to safeguarding your crypto:

1. Use a Secure Wallet

Hardware Wallets:

  • The safest option for long-term storage.
  • Devices like Ledger or Trezor keep your private keys offline, out of reach of hackers.

Software Wallets:

  • Convenient for active trading but more vulnerable to attacks.
  • Use reputable wallets like MetaMask or Trust Wallet and enable strong security features.

Pro Tip: Use a hardware wallet for long-term holdings and a software wallet for small, active trading balances.

2. Enable Two-Factor Authentication (2FA)

Always enable 2FA on your exchange accounts, wallets, and email addresses.

  • Use Google Authenticator or Authy, not SMS-based 2FA, which is susceptible to SIM swaps.

3. Beware of Phishing & Fake Websites

  • Double-check URLs before logging into exchanges or wallets.
  • Never click links from suspicious emails or DMs.
  • Bookmark the official websites of your exchanges and platforms.

4. Keep Your Seed Phrase Offline

Your wallet’s seed phrase is the master key to your funds.

  • Write it down on paper and store it securely (safe, vault).
  • Avoid storing it in digital form (cloud storage, photos).
  • Consider splitting the phrase into parts and storing them in separate locations.

5. Research Projects Before Investing

Many scams and rug pulls target uninformed investors chasing hype.

How Token Metrics Helps:

  • Use AI-powered Investor Grades to assess projects for long-term viability.
  • Leverage Moonshot Finder to discover vetted early-stage tokens with real growth potential—not scams.

6. Diversify Your Storage

Don’t keep all your crypto in one place.

  • Use multiple wallets for different purposes (trading vs. holding).
  • Spread funds across hardware, software, and exchange wallets.

7. Stay Updated on Threats

The crypto landscape changes fast.

  • Follow credible crypto news platforms.
  • Monitor regulatory updates and security alerts.
  • Use Token Metrics to stay ahead of market narratives and avoid projects flagged as high-risk.

How Token Metrics Helps You Stay Secure

While Token Metrics isn’t a wallet or exchange, it’s a powerful AI-powered platform designed to help you make safer investment decisions.

1. AI-Powered Risk Analysis

Token Metrics uses AI-driven evaluations to score projects, helping you avoid high-risk tokens and scam projects.

2. Investor & Trader Grades

Our proprietary grading system helps you quickly identify safe, high-quality assets for both short-term trading and long-term holding.

3. Moonshot Finder

Interested in low-cap tokens? The Moonshot Finder helps you spot legitimate early-stage projects before they pump—without falling into scams.

4. Narrative & Market Tracking

Stay ahead of emerging narratives and security concerns with Token Metrics’ real-time AI-driven analysis, helping you dodge risky trends.

Practical Security Checklist for Every Crypto Holder

  1. Use a hardware wallet for long-term holdings.
  2. Enable 2FA on all accounts—never rely on SMS-based security.
  3. Store seed phrases offline and securely.
  4. Avoid suspicious links and verify all URLs.
  5. Research every project using platforms like Token Metrics.
  6. Diversify storage across multiple wallets.
  7. Stay informed about new threats and market risks.

Final Thoughts

So, how do you keep your cryptocurrency safe? It comes down to strong storage practices, personal vigilance, and making informed investment decisions.

While hardware wallets and 2FA secure your assets, knowing where to invest is just as important. That’s where Token Metrics comes in—using AI-powered analysis to help you avoid scams, choose safe projects, and trade with confidence.

In crypto, you are your own bank—so take your security seriously. And with Token Metrics guiding your decisions, you can navigate this high-risk market safely and profitably.

Research

What Are Trading Fees and How Do They Work?

Token Metrics Team
8 min
MIN

If you’ve ever bought or sold cryptocurrency, you’ve likely noticed that exchanges charge trading fees. While these fees may seem small at first glance, they can add up significantly over time, especially for frequent traders.

Understanding how trading fees work is essential for maximizing your profits and choosing the right platform and strategy. In this guide, we’ll explain what trading fees are, how they’re calculated, the different types of fees, and how Token Metrics can help you minimize costs while optimizing your trades.

What Are Trading Fees?

Trading fees are charges imposed by cryptocurrency exchanges whenever you execute a trade—whether you’re buying, selling, or swapping digital assets.

  • Purpose:

    • They compensate exchanges for providing liquidity, security, and order-matching services.
    • They discourage spam orders that could overload the exchange.

Example:
If you buy $1,000 worth of Bitcoin with a 0.1% trading fee, you’ll pay $1 in fees for that transaction.

How Are Trading Fees Calculated?

Most crypto exchanges calculate fees based on:

  1. Trade Value (Percentage):

    • The most common model.
    • Fees are a percentage of the total trade amount (e.g., 0.1% per trade).

  2. Flat Fees:

    • Some platforms charge a fixed fee per trade, regardless of trade size.

  3. Tiered Fee Structures:

    • Frequent traders often benefit from lower fees when they reach certain monthly trading volumes.

Maker vs. Taker Fees

Many exchanges use a maker-taker model to incentivize liquidity:

  • Maker Fees:

    • You pay a lower fee (or sometimes nothing) when you add liquidity by placing a limit order that isn’t immediately matched.

  • Taker Fees:

    • You pay a higher fee when you remove liquidity by placing a market order that is filled instantly.

Example:
On Binance, makers might pay 0.08%, while takers pay 0.1%.

Types of Crypto Trading Fees

When trading crypto, you’ll encounter more than just trading fees:

1. Trading (Transaction) Fees

  • Charged when buying or selling crypto.
  • Often range from 0.05%–0.5% depending on the exchange.

2. Deposit Fees

  • Some exchanges charge when funding accounts via credit card, PayPal, or bank transfers.
  • Crypto deposits are typically free.

3. Withdrawal Fees

  • Charged when moving funds off the exchange.
  • Often fixed per withdrawal (e.g., 0.0005 BTC).

4. Network (Gas) Fees

  • Separate from exchange fees, paid to blockchain validators.
  • Ethereum and other networks can have high gas fees during peak demand.

Why Do Trading Fees Matter?

Even small fees can significantly impact your profits, especially if you trade often.

Example:

  • A day trader making 50 trades/month with a 0.1% fee per trade on $1,000 positions will pay $50/month in fees.
  • Over a year, that’s $600 lost to fees—before considering withdrawal or gas costs.

This is why reducing fees is crucial for active traders.

How to Minimize Trading Fees

1. Use Low-Fee Exchanges

Compare platforms—Binance, Bybit, and Kraken often offer competitive rates for high-volume traders.

2. Increase Your Trading Volume

Many exchanges lower fees as your monthly trading volume increases.

3. Use Limit Orders

Save on fees by acting as a maker instead of a taker whenever possible.

4. Pay with Exchange Tokens

Some exchanges offer discounts when fees are paid with their native token (e.g., BNB on Binance).

5. Optimize Your Trading Strategy with AI

Instead of making dozens of small trades, use data-driven insights from Token Metrics to make high-probability trades—reducing overall fee impact.

How Token Metrics Helps You Save on Fees

Token Metrics isn’t an exchange—it’s an AI-powered crypto research and trading platform designed to maximize your profits.

Here’s how it helps with trading fees:

1. AI-Powered Trade Optimization

Token Metrics provides bullish/bearish trading signals based on 80+ technical indicators, helping you enter fewer but higher-quality trades—minimizing unnecessary fees.

2. Trader & Investor Grades

Our proprietary grading system helps you identify top-performing cryptos, reducing guesswork and avoiding costly trial-and-error trading.

3. AI-Managed Indices

Instead of manually rebalancing portfolios (and paying multiple trading fees), use Token Metrics AI-driven crypto indices, which rebalance intelligently while keeping transaction costs low.

4. Narrative Tracking

Our AI detects emerging crypto narratives early, helping you position yourself before the market gets crowded—reducing the need for excessive short-term trading.

Practical Example: Using Token Metrics to Reduce Fees

Imagine you’re trading altcoins manually and make 20 trades/month.

  • At 0.2% per trade on $1,000 positions, you pay $40/month in fees.
  • With Token Metrics AI signals, you cut this down to 8 high-probability trades per month—reducing your fees by 60% while increasing win rates.

This is how data-driven trading saves both money and stress.

Final Thoughts

So, what are trading fees and how do they work? They’re the charges exchanges take for facilitating trades, withdrawals, and transactions—and while they may seem small, they can eat into your profits quickly.

The good news? You can minimize trading fees with the right strategies—and Token Metrics can help.

By providing AI-powered trading signals, long-term Investor Grades, and automated crypto indices, Token Metrics helps you reduce unnecessary trades, make smarter decisions, and maximize your returns—all while minimizing the impact of trading fees.

Whether you’re a beginner or advanced trader, using Token Metrics means trading smarter, not harder.

Thank you! Your submission has been received!
Oops! Something went wrong while submitting the form.

Crypto Basics Blog

Research Blogs

Announcement Blogs

Unlock the Secrets of Cryptocurrency

Sign Up for the Newsletter for the Exclusive Updates