
Every hour you wait is a signal you miss.

Stop Guessing, Start Trading: The Token Metrics API Advantage
Big news: We’re cranking up the heat on AI-driven crypto analytics with the launch of the Token Metrics API and our official SDK (Software Development Kit). This isn’t just an upgrade – it's a quantum leap, giving traders, hedge funds, developers, and institutions direct access to cutting-edge market intelligence, trading signals, and predictive analytics.
Crypto markets move fast, and having real-time, AI-powered insights can be the difference between catching the next big trend or getting left behind. Until now, traders and quants have been wrestling with scattered data, delayed reporting, and a lack of truly predictive analytics. Not anymore.
The Token Metrics API delivers 32+ high-performance endpoints packed with powerful AI-driven insights right into your lap, including:
- Trading Signals: AI-driven buy/sell recommendations based on real-time market conditions.
- Investor & Trader Grades: Our proprietary risk-adjusted scoring for assessing crypto assets.
- Price Predictions: Machine learning-powered forecasts for multiple time frames.
- Sentiment Analysis: Aggregated insights from social media, news, and market data.
- Market Indicators: Advanced metrics, including correlation analysis, volatility trends, and macro-level market insights.
Getting started with the Token Metrics API is simple:
- Sign up at www.tokenmetrics.com/api.
- Generate an API key and explore sample requests.
- Choose a tier–start with 50 free API calls/month, or stake TMAI tokens for premium access.
- Optionally–download the SDK, install it for your preferred programming language, and follow the provided setup guide.
At Token Metrics, we believe data should be decentralized, predictive, and actionable.
The Token Metrics API & SDK bring next-gen AI-powered crypto intelligence to anyone looking to trade smarter, build better, and stay ahead of the curve. With our official SDK, developers can plug these insights into their own trading bots, dashboards, and research tools – no need to reinvent the wheel.
Moonshots API: Discover Breakout Tokens Before the Crowd
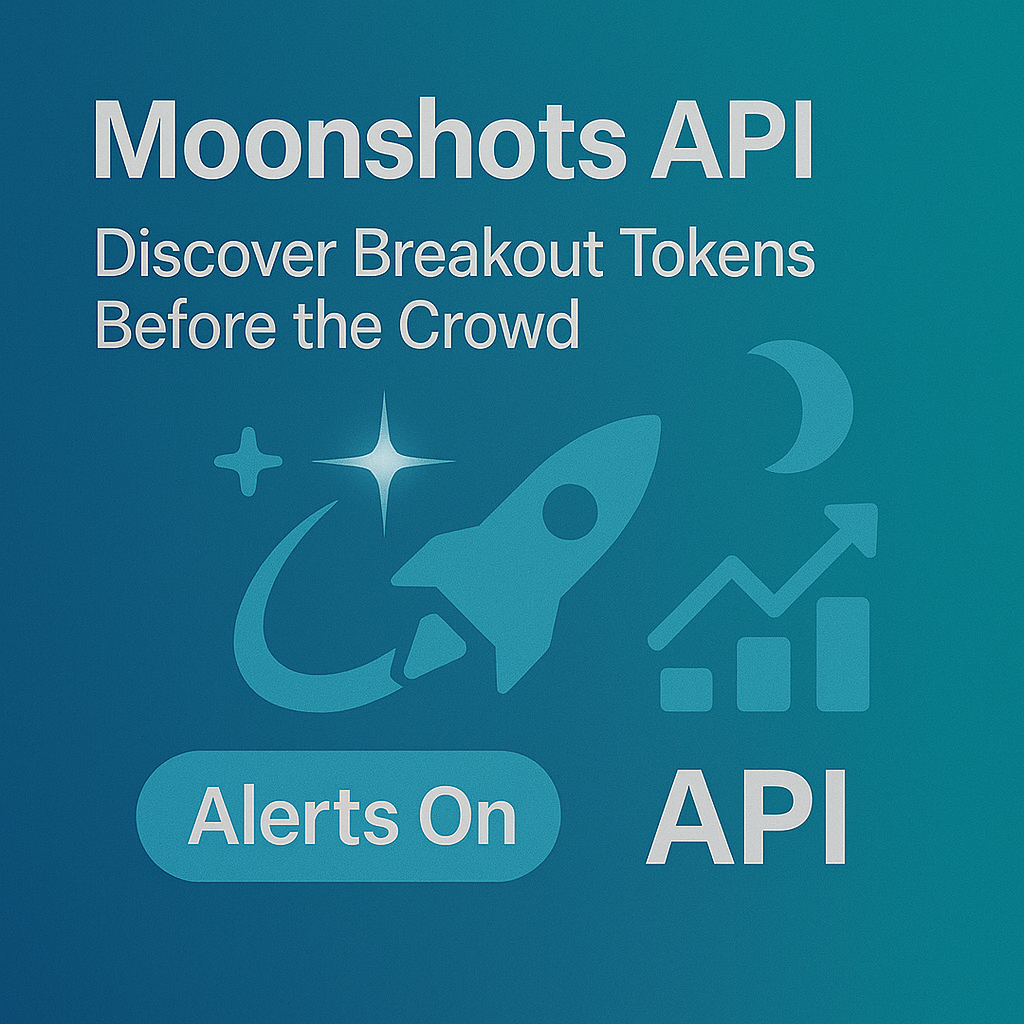
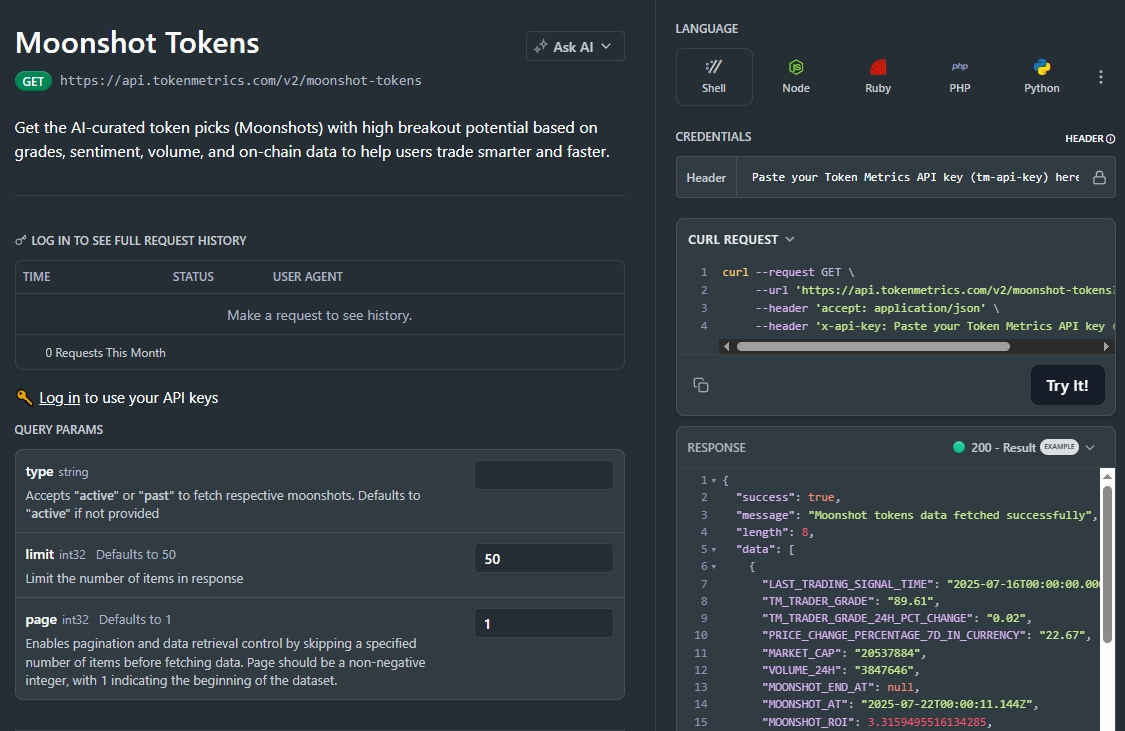
The biggest gains in crypto rarely come from the majors. They come from Moonshots—fast-moving tokens with breakout potential. The Moonshots API surfaces these candidates programmatically so you can rank, alert, and act inside your product. In this guide, you’ll call /v2/moonshots, display a high-signal list with TM Grade and Bullish tags, and wire it into bots, dashboards, or screeners in minutes. Start by grabbing your key at Get API Key, then Run Hello-TM and Clone a Template to ship fast.
What You’ll Build in 2 Minutes
- A minimal script that fetches Moonshots via /v2/moonshots (optionally filter by grade/signal/limit).
- A UI pattern to render symbol, TM Grade, signal, reason/tags, and timestamp—plus a link to token details.
- Optional one-liner curl to smoke-test your key.
- Endpoints to add next: /v2/tm-grade (one-score ranking), /v2/trading-signals / /v2/hourly-trading-signals (timing), /v2/resistance-support (stops/targets), /v2/quantmetrics (risk sizing), /v2/price-prediction (scenario ranges).

Why This Matters
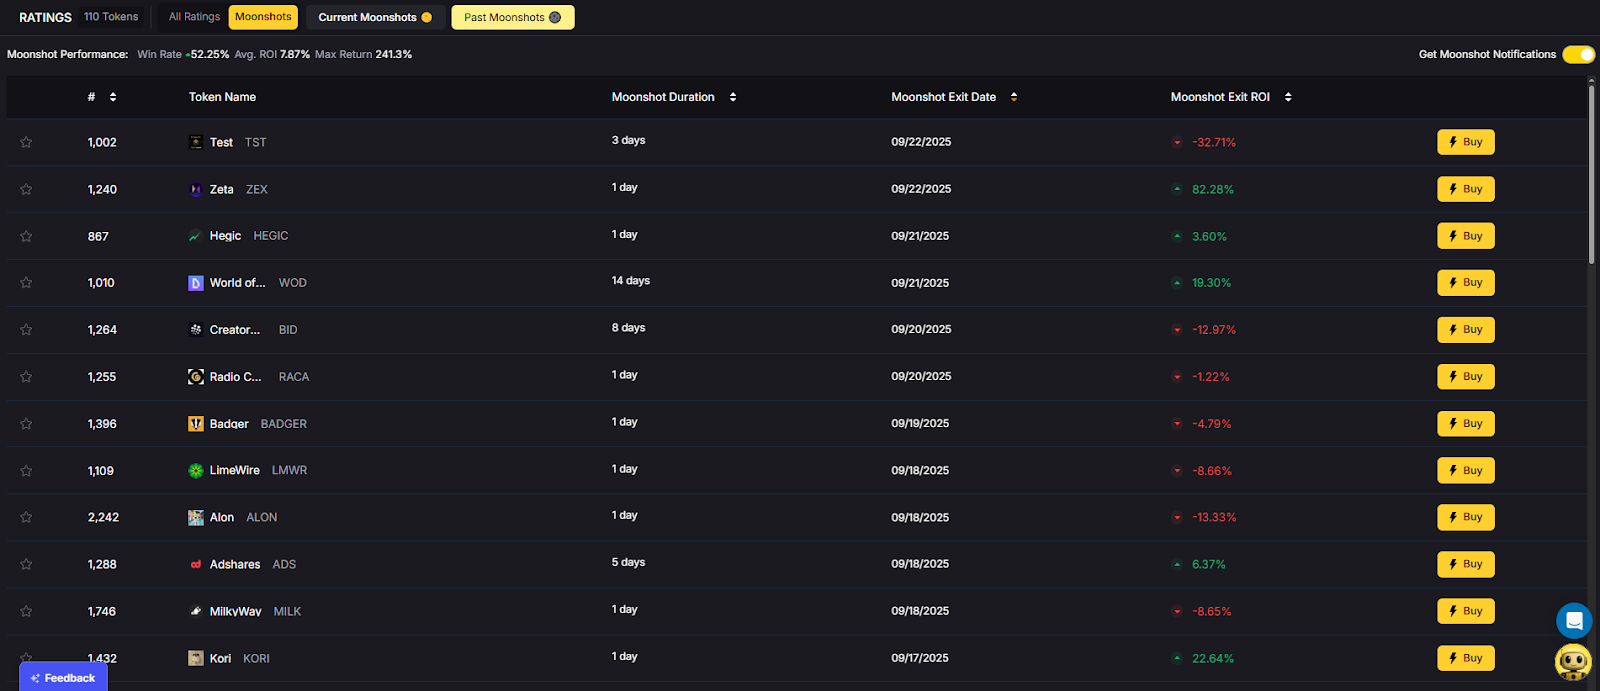
Discovery that converts. Users want more than price tickers—they want a curated, explainable list of high-potential tokens. The moonshots API encapsulates multiple signals into a short list designed for exploration, alerts, and watchlists you can monetize.
Built for builders. The endpoint returns a consistent schema with grade, signal, and context so you can immediately sort, badge, and trigger workflows. With predictable latency and clear filters, you can scale to dashboards, mobile apps, and headless bots without reinventing the discovery pipeline.
Where to Find
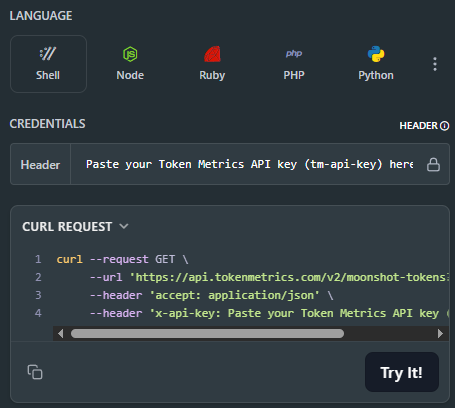
The Moonshots API cURL request is right there in the top right of the API Reference. Grab it and start tapping into the potential!

👉 Keep momentum: Get API Key • Run Hello-TM • Clone a Template
Live Demo & Templates
- Moonshots Screener (Dashboard): A discover tab that ranks tokens by TM Grade and shows the latest Bullish tags and reasons.
- Alert Bot (Discord/Telegram): DM when a new token enters the Moonshots list or when the signal flips; include S/R levels for SL/TP.
- Watchlist Widget (Product): One-click “Follow” on Moonshots; show Quantmetrics for risk and a Price Prediction range for scenario planning.
Fork a screener or alerting template, plug your key, and deploy. Validate your environment with Hello-TM. When you scale users or need higher limits, compare API plans.
How It Works (Under the Hood)
The Moonshots endpoint aggregates a set of evidence—often combining TM Grade, signal state, and momentum/volume context—into a shortlist of breakout candidates. Each row includes a symbol, grade, signal, and timestamp, plus optional reason tags for transparency.
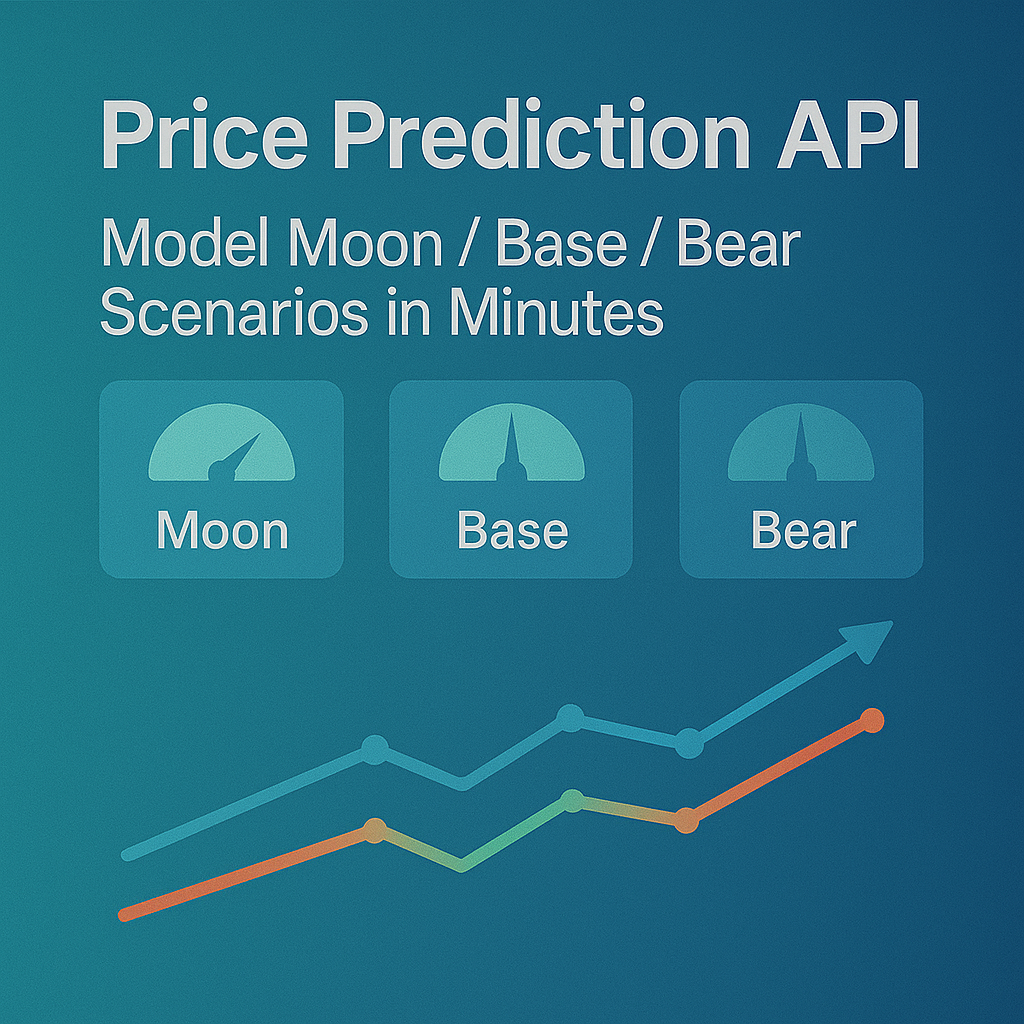
For UX, a common pattern is: headline list → token detail where you render TM Grade (quality), Trading Signals (timing), Support/Resistance (risk placement), Quantmetrics (risk-adjusted performance), and Price Prediction scenarios. This lets users understand why a token was flagged and how to act with risk controls.
Polling vs webhooks. Dashboards typically poll with short-TTL caching. Alerting flows use scheduled jobs or webhooks (where available) to smooth traffic and avoid duplicates. Always make notifications idempotent.

Production Checklist
- Rate limits: Respect plan caps; batch and throttle in clients/workers.
- Retries & backoff: Exponential backoff with jitter on 429/5xx; capture request IDs.
- Idempotency: De-dup alerts and downstream actions (e.g., don’t re-DM on retries).
- Caching: Memory/Redis/KV with short TTLs; pre-warm during peak hours.
- Batching: Fetch in pages (e.g., limit + offset if supported); parallelize within limits.
- Sorting & tags: Sort primarily by tm_grade or composite; surface reason tags to build trust.
- Observability: Track p95/p99, error rates, and alert delivery success; log variant versions.
- Security: Store keys in a secrets manager; rotate regularly.
Use Cases & Patterns
- Bot Builder (Headless):
- Universe filter: trade only tokens appearing in Moonshots with tm_grade ≥ X.
- Timing: confirm entry with /v2/trading-signals; place stops/targets with /v2/resistance-support; size via Quantmetrics.
- Universe filter: trade only tokens appearing in Moonshots with tm_grade ≥ X.
- Dashboard Builder (Product):
- Moonshots tab with Badges (Bullish, Grade 80+, Momentum).
- Token detail page integrating TM Grade, Signals, S/R, and Predictions for a complete decision loop.
- Moonshots tab with Badges (Bullish, Grade 80+, Momentum).
- Screener Maker (Lightweight Tools):
- Top-N list with Follow/alert toggles; export CSV.
- “New this week” and “Graduated” sections for churn/entry dynamics.
- Top-N list with Follow/alert toggles; export CSV.
- Community/Content:
- Weekly digest: new entrants, upgrades, and notable exits—link back to your product pages.
Next Steps
- Get API Key — generate a key and start free.
- Run Hello-TM — verify your first successful call.
- Clone a Template — deploy a screener or alerts bot today.
- Watch the demo: VIDEO_URL_HERE
- Compare plans: Scale confidently with API plans.
FAQs
1) What does the Moonshots API return?
A list of breakout candidates with fields such as symbol, tm_grade, signal (often Bullish/Bearish), optional reason tags, and updated_at. Use it to drive discover tabs, alerts, and watchlists.
2) How fresh is the list? What about latency/SLOs?
The endpoint targets predictable latency and timely updates for dashboards and alerts. Use short-TTL caching and queued jobs/webhooks to avoid bursty polling.
3) How do I use Moonshots in a trading workflow?
Common stack: Moonshots for discovery, Trading Signals for timing, Support/Resistance for SL/TP, Quantmetrics for sizing, and Price Prediction for scenario context. Always backtest and paper-trade first.
4) I saw results like “+241%” and a “7.5% average return.” Are these guaranteed?
No. Any historical results are illustrative and not guarantees of future performance. Markets are risky; use risk management and testing.
5) Can I filter the Moonshots list?
Yes—pass parameters like min_grade, signal, and limit (as supported) to tailor to your audience and keep pages fast.
6) Do you provide SDKs or examples?
REST works with JavaScript and Python snippets above. Docs include quickstarts, Postman collections, and templates—start with Run Hello-TM.
7) Pricing, limits, and enterprise SLAs?
Begin free and scale up. See API plans for rate limits and enterprise options.
Support and Resistance API: Auto-Calculate Smart Levels for Better Trades
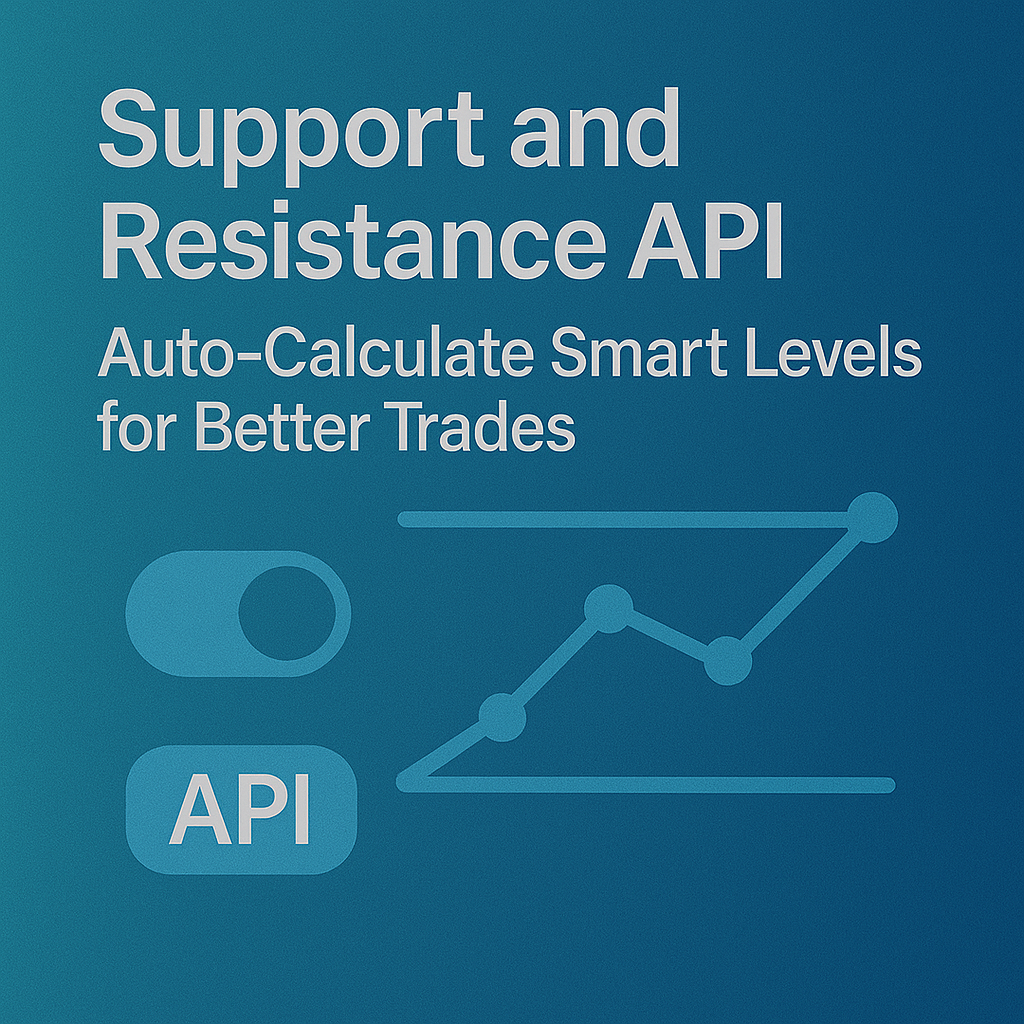
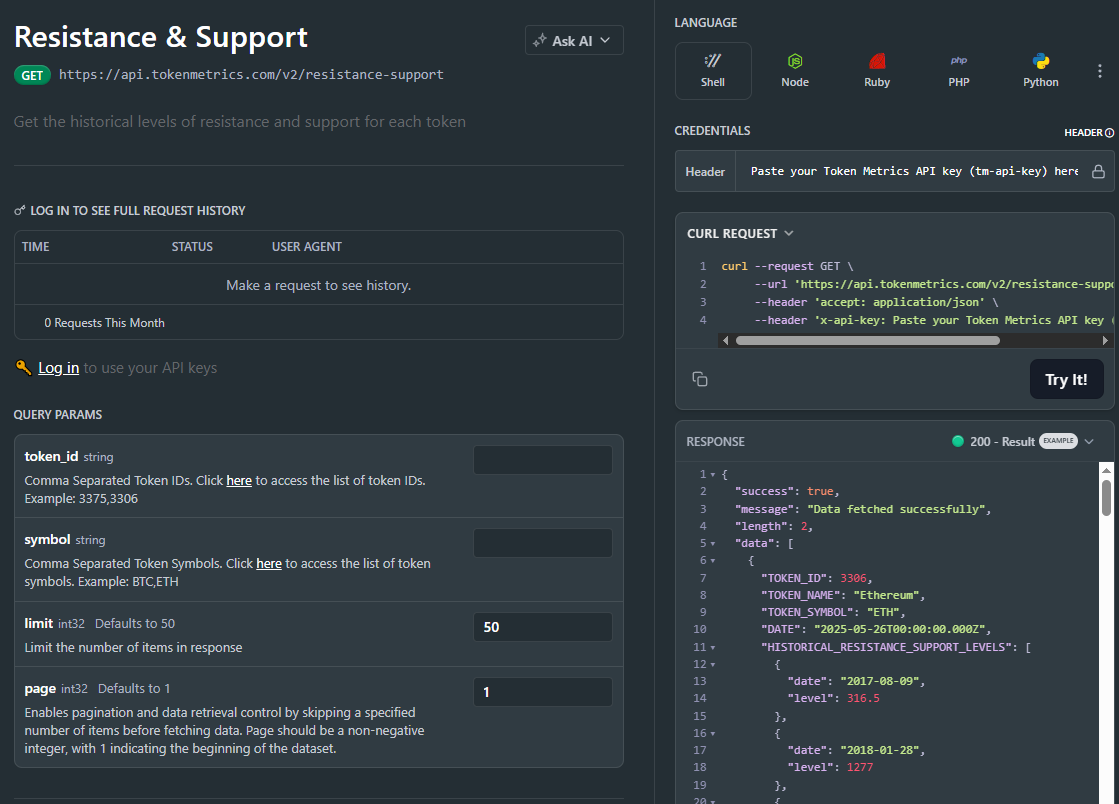
Most traders still draw lines by hand in TradingView. The support and resistance API from Token Metrics auto-calculates clean support and resistance levels from one request, so your dashboard, bot, or alerts can react instantly. In minutes, you’ll call /v2/resistance-support, render actionable levels for any token, and wire them into stops, targets, or notifications. Start by grabbing your key on Get API Key, then Run Hello-TM and Clone a Template to ship a production-ready feature fast.
What You’ll Build in 2 Minutes
- A minimal script that fetches Support/Resistance via /v2/resistance-support for a symbol (e.g., BTC, SOL).
- A one-liner curl to smoke-test your key.
- A UI pattern to display nearest support, nearest resistance, level strength, and last updated time.
- Endpoints to add next: /v2/trading-signals (entries/exits), /v2/hourly-trading-signals (intraday updates), /v2/tm-grade (single-score context), /v2/quantmetrics (risk/return framing).

Why This Matters
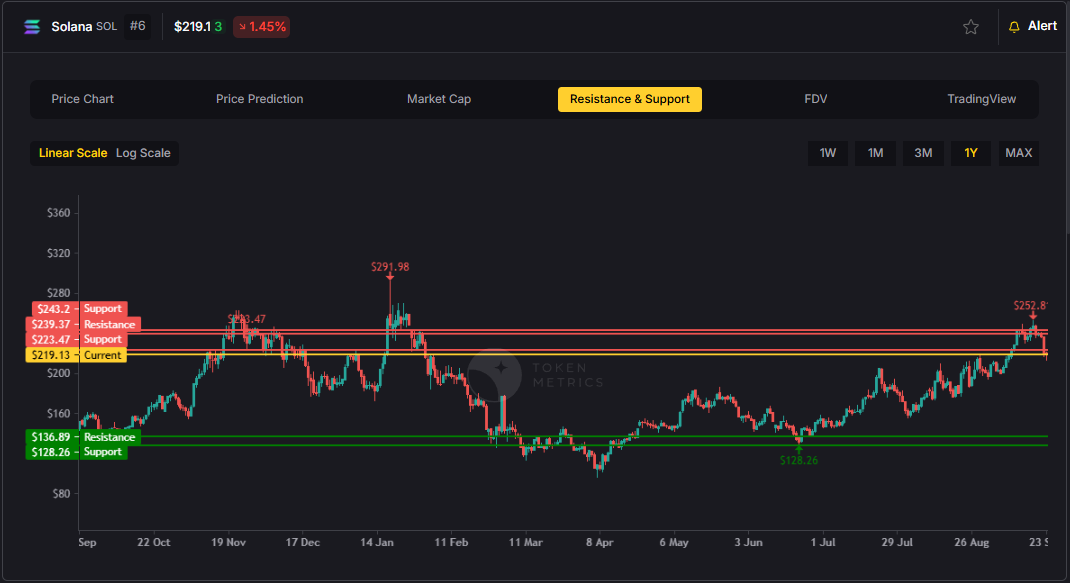
Precision beats guesswork. Hand-drawn lines are subjective and slow. The support and resistance API standardizes levels across assets and timeframes, enabling deterministic stops and take-profits your users (and bots) can trust.
Production-ready by design. A simple REST shape, predictable latency, and clear semantics let you add levels to token pages, automate SL/TP alerts, and build rule-based execution with minimal glue code.
Where to Find
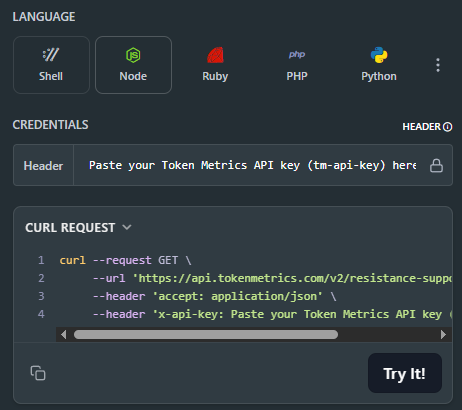
Need the Support and Resistance data? The cURL request for it is in the top right of the API Reference for quick access.

👉 Keep momentum: Get API Key • Run Hello-TM • Clone a Template
Live Demo & Templates
- SL/TP Alerts Bot (Telegram/Discord): Ping when price approaches or touches a level; include buffer %, link back to your app.
- Token Page Levels Panel (Dashboard): Show nearest support/resistance with strength badges; color the latest candle by zone.
- TradingView Overlay Companion: Use levels to annotate charts and label potential entries/exits driven by Trading Signals.
Kick off with our quickstarts—fork a bot or dashboard template, plug your key, and deploy. Confirm your environment by Running Hello-TM. When you’re scaling or need webhooks/limits, review API plans.
How It Works (Under the Hood)
The Support/Resistance endpoint analyzes recent price structure to produce discrete levels above and below current price, along with strength indicators you can use for priority and styling. Query /v2/resistance-support?symbol=<ASSET>&timeframe=<HORIZON> to receive arrays of level objects and timestamps.
Polling vs webhooks. For dashboards, short-TTL caching and batched fetches keep pages snappy. For bots and alerts, use queued jobs or webhooks (where applicable) to avoid noisy, bursty polling—especially around market opens and major events.

Production Checklist
- Rate limits: Respect plan caps; add client-side throttling.
- Retries/backoff: Exponential backoff with jitter for 429/5xx; log failures.
- Idempotency: Make alerting and order logic idempotent to prevent duplicates.
- Caching: Memory/Redis/KV with short TTLs; pre-warm top symbols.
- Batching: Fetch multiple assets per cycle; parallelize within rate limits.
- Threshold logic: Add %-of-price buffers (e.g., alert at 0.3–0.5% from level).
- Error catalog: Map common 4xx/5xx to actionable user guidance; keep request IDs.
- Observability: Track p95/p99; measure alert precision (touch vs approach).
- Security: Store API keys in a secrets manager; rotate regularly.
Use Cases & Patterns
- Bot Builder (Headless):
- Use nearest support for stop placement and nearest resistance for profit targets.
- Combine with /v2/trading-signals for entries/exits and size via Quantmetrics (volatility, drawdown).
- Use nearest support for stop placement and nearest resistance for profit targets.
- Dashboard Builder (Product):
- Add a Levels widget to token pages; badge strength (e.g., High/Med/Low) and show last touch time.
- Color the price region (below support, between levels, above resistance) for instant context.
- Add a Levels widget to token pages; badge strength (e.g., High/Med/Low) and show last touch time.
- Screener Maker (Lightweight Tools):
- “Close to level” sort: highlight tokens within X% of a strong level.
- Toggle alerts for approach vs breakout events.
- “Close to level” sort: highlight tokens within X% of a strong level.
- Risk Management:
- Create policy rules like “no new long if price is within 0.2% of strong resistance.”
- Export daily level snapshots for audit/compliance.
- Create policy rules like “no new long if price is within 0.2% of strong resistance.”
Next Steps
- Get API Key — generate a key and start free.
- Run Hello-TM — verify your first successful call.
- Clone a Template — deploy a levels panel or alerts bot today.
- Watch the demo: VIDEO_URL_HERE
- Compare plans: Scale confidently with API plans.
FAQs
1) What does the Support & Resistance API return?
A JSON payload with arrays of support and resistance levels for a symbol (and optional timeframe), each with a price and strength indicator, plus an update timestamp.
2) How timely are the levels? What are the latency/SLOs?
The endpoint targets predictable latency suitable for dashboards and alerts. Use short-TTL caching for UIs, and queued jobs or webhooks for alerting to smooth traffic.
3) How do I trigger alerts or trades from levels?
Common patterns: alert when price is within X% of a level, touches a level, or breaks beyond with confirmation. Always make downstream actions idempotent and respect rate limits.
4) Can I combine levels with other endpoints?
Yes—pair with /v2/trading-signals for timing, /v2/tm-grade for quality context, and /v2/quantmetrics for risk sizing. This yields a complete decide-plan-execute loop.
5) Which timeframe should I use?
Intraday bots prefer shorter horizons; swing/position dashboards use daily or higher-timeframe levels. Offer a timeframe toggle and cache results per setting.
6) Do you provide SDKs or examples?
Use the REST snippets above (JS/Python). The docs include quickstarts, Postman collections, and templates—start with Run Hello-TM.
7) Pricing, limits, and enterprise SLAs?
Begin free and scale as you grow. See API plans for rate limits and enterprise SLA options.
Quantmetrics API: Measure Risk & Reward in One Call
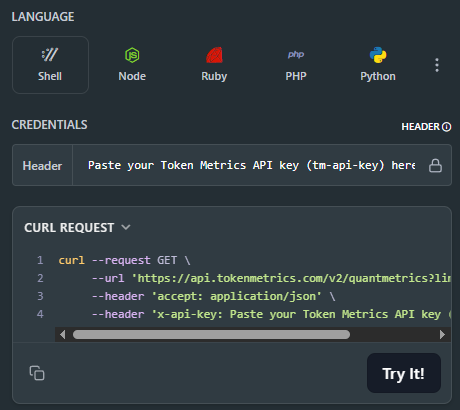
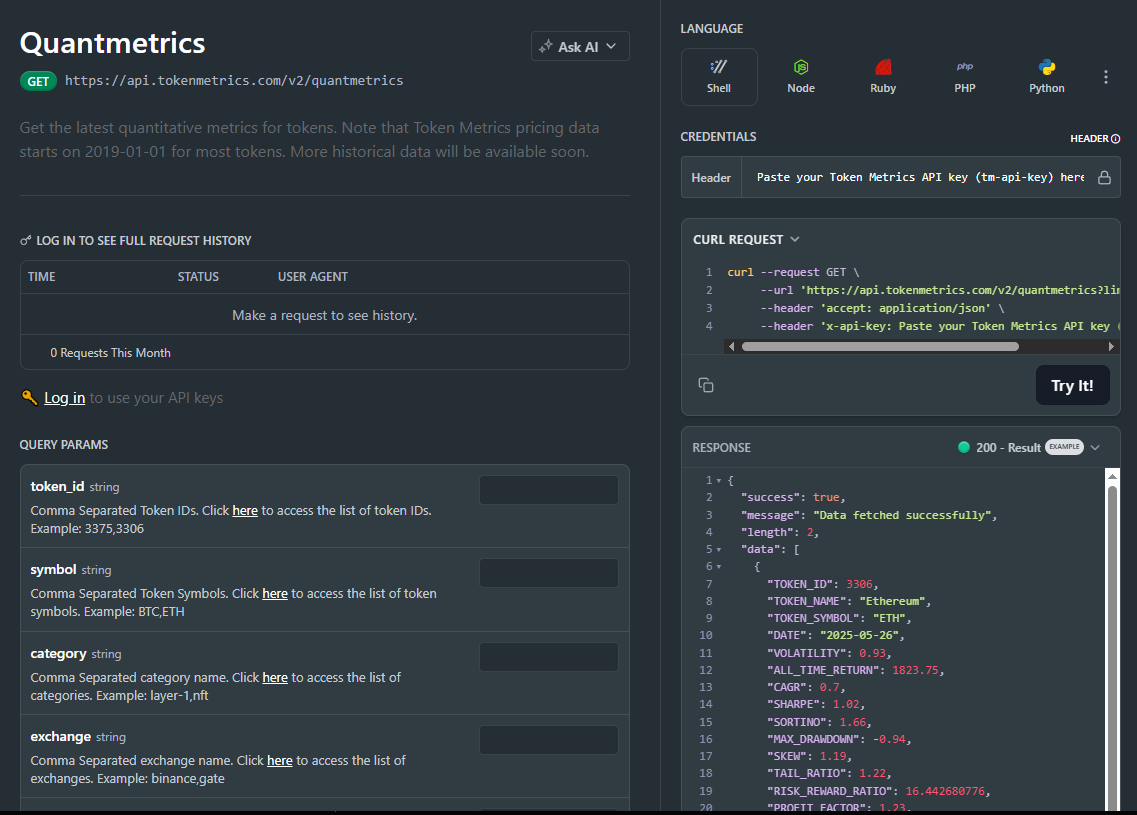
Most traders see price—quants see probabilities. The Quantmetrics API turns raw performance into risk-adjusted stats like Sharpe, Sortino, volatility, drawdown, and CAGR so you can compare tokens objectively and build smarter bots and dashboards. In minutes, you’ll query /v2/quantmetrics, render a clear performance snapshot, and ship a feature that customers trust. Start by grabbing your key at Get API Key, Run Hello-TM to verify your first call, then Clone a Template to go live fast.
What You’ll Build in 2 Minutes
- A minimal script that fetches Quantmetrics for a token via /v2/quantmetrics (e.g., BTC, ETH, SOL).
- A smoke-test curl you can paste into your terminal.
- A UI pattern that displays Sharpe, Sortino, volatility, max drawdown, CAGR, and lookback window.
- Endpoints to add next: /v2/tm-grade (one-score signal), /v2/trading-signals / /v2/hourly-trading-signals (timing), /v2/resistance-support (risk placement), /v2/price-prediction (scenario planning).

Why This Matters
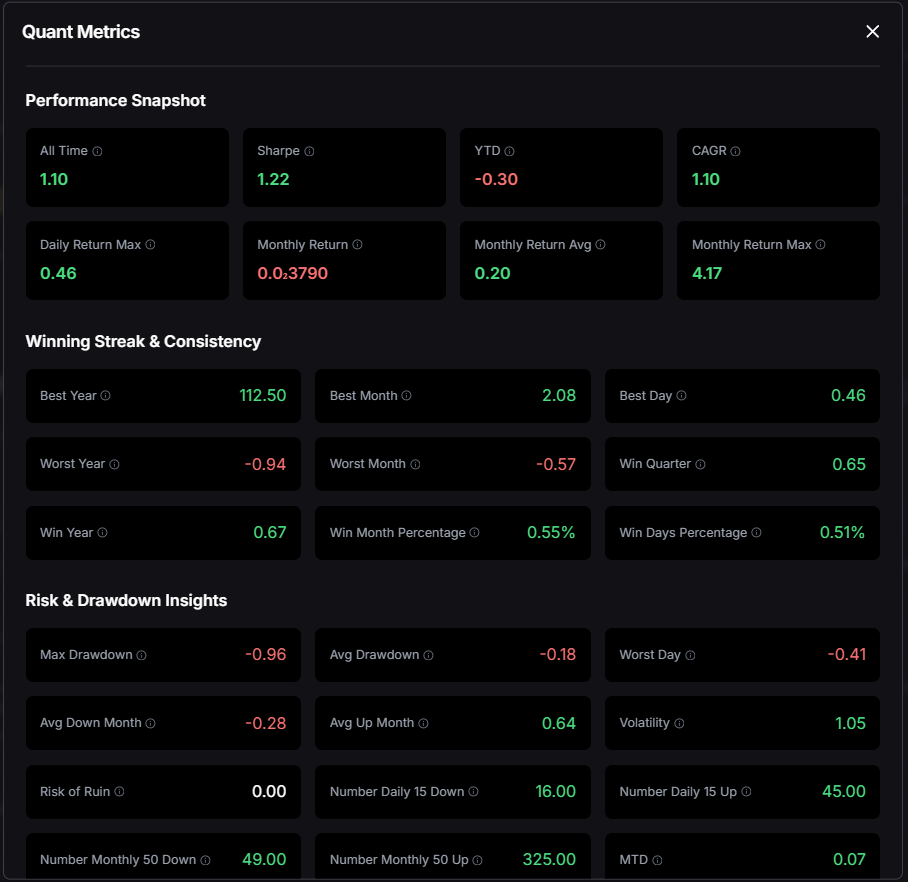
Risk-adjusted truth beats hype. Price alone hides tail risk and whipsaws. Quantmetrics compresses edge, risk, and consistency into metrics that travel across assets and timeframes—so you can rank universes, size positions, and communicate performance like a pro.
Built for dev speed. A clean REST schema, predictable latency, and easy auth mean you can plug Sharpe/Sortino into bots, dashboards, and screeners without maintaining your own analytics pipeline. Pair with caching and batching to serve fast pages at scale.
Where to Find
The Quant Metrics cURL request is located in the top right of the API Reference, allowing you to easily integrate it with your application.

👉 Keep momentum: Get API Key • Run Hello-TM • Clone a Template
Live Demo & Templates
- Risk Snapshot Widget (Dashboard): Show Sharpe, Sortino, volatility, and drawdown per token; color-code by thresholds.
- Allocator Screener: Rank tokens by Sharpe, filter by drawdown < X%, and surface a top-N list.
- Bot Sizer: Use Quantmetrics to scale position sizes (e.g., lower risk = larger size), combined with Trading Signals for entries/exits.
Kick off from quickstarts in the docs—fork a dashboard or screener template, plug your key, and deploy in minutes. Validate your environment with Run Hello-TM; when you need more throughput or webhooks, compare API plans.
How It Works (Under the Hood)
Quantmetrics computes risk-adjusted performance over a chosen lookback (e.g., 30d, 90d, 1y). You’ll receive a JSON snapshot with core statistics:
- Sharpe ratio: excess return per unit of total volatility.
- Sortino ratio: penalizes downside volatility more than upside.
- Volatility: standard deviation of returns over the window.
- Max drawdown: worst peak-to-trough decline.
- CAGR / performance snapshot: geometric growth rate and best/worst periods.
Call /v2/quantmetrics?symbol=<ASSET>&window=<LOOKBACK> to fetch the current snapshot. For dashboards spanning many tokens, batch symbols and apply short-TTL caching. If you generate alerts (e.g., “Sharpe crossed 1.5”), run a scheduled job and queue notifications to avoid bursty polling.

Production Checklist
- Rate limits: Understand your tier caps; add client-side throttling and queues.
- Retries & backoff: Exponential backoff with jitter; treat 429/5xx as transient.
- Idempotency: Prevent duplicate downstream actions on retried jobs.
- Caching: Memory/Redis/KV with short TTLs; pre-warm popular symbols and windows.
- Batching: Fetch multiple symbols per cycle; parallelize carefully within limits.
- Error catalog: Map 4xx/5xx to clear remediation; log request IDs for tracing.
- Observability: Track p95/p99 latency and error rates; alert on drift.
- Security: Store API keys in secrets managers; rotate regularly.
Use Cases & Patterns
- Bot Builder (Headless): Gate entries by Sharpe ≥ threshold and drawdown ≤ limit, then trigger with /v2/trading-signals; size by inverse volatility.
- Dashboard Builder (Product): Add a Quantmetrics panel to token pages; allow switching lookbacks (30d/90d/1y) and export CSV.
- Screener Maker (Lightweight Tools): Top-N by Sortino with filters for volatility and sector; add alert toggles when thresholds cross.
- Allocator/PM Tools: Blend CAGR, Sharpe, drawdown into a composite score to rank reallocations; show methodology for trust.
- Research/Reporting: Weekly digest of tokens with Sharpe ↑, drawdown ↓, and volatility ↓.
Next Steps
- Get API Key — start free and generate a key in seconds.
- Run Hello-TM — verify your first successful call.
- Clone a Template — deploy a screener or dashboard today.
- Watch the demo: VIDEO_URL_HERE
- Compare plans: Scale with API plans.
FAQs
1) What does the Quantmetrics API return?
A JSON snapshot of risk-adjusted metrics (e.g., Sharpe, Sortino, volatility, max drawdown, CAGR) for a symbol and lookback window—ideal for ranking, sizing, and dashboards.
2) How fresh are the stats? What about latency/SLOs?
Responses are engineered for predictable latency. For heavy UI usage, add short-TTL caching and batch requests; for alerts, use scheduled jobs or webhooks where available.
3) Can I use Quantmetrics to size positions in a live bot?
Yes—many quants size inversely to volatility or require Sharpe ≥ X to trade. Always backtest and paper-trade before going live; past results are illustrative, not guarantees.
4) Which lookback window should I choose?
Short windows (30–90d) adapt faster but are noisier; longer windows (6–12m) are steadier but slower to react. Offer users a toggle and cache each window.
5) Do you provide SDKs or examples?
REST is straightforward (JS/Python above). Docs include quickstarts, Postman collections, and templates—start with Run Hello-TM.
6) Polling vs webhooks for quant alerts?
Dashboards usually use cached polling. For threshold alerts (e.g., Sharpe crosses 1.0), run scheduled jobs and queue notifications to keep usage smooth and idempotent.
7) Pricing, limits, and enterprise SLAs?
Begin free and scale up. See API plans for rate limits and enterprise SLA options.
Recent Posts

From Retail to Institutions: Who’s Driving the Crypto Market in 2025?
Crypto markets are evolving — and fast. In the early days, retail investors dominated the space. But by 2025, the tides are shifting. Institutional investors, family offices, and algorithmic funds are entering the market at scale. This blog explores the growing divide — and how it’s reshaping opportunities for everyday traders.
The Rise of Institutional Money in Crypto
Over the last year, a new class of investors has emerged: professional firms with deep pockets and long-term horizons. They're no longer just “exploring crypto” — they’re actively deploying capital.
Why now?
- Regulatory clarity in major jurisdictions
- Bitcoin ETF approvals and crypto fund launches
- Better custody, risk management, and analytics tools (including Token Metrics)
What Are Institutions Buying?
Institutions tend to avoid meme coins and hyper-volatility. Instead, they focus on:
- Layer 1 Infrastructure – Ethereum alternatives like Sui and Avalanche
- AI Tokens – Leveraging real-world utility and strong narratives
- DeFi Blue Chips – Projects with consistent TVL and governance upgrades
- Stable Yield Strategies – On-chain bonds, staking, and real-world asset tokens
Token Metrics has seen a spike in institutional users filtering by Investor Grade and project fundamentals.
Retail Traders Still Dominate One Arena
Retail traders are far from out — they dominate high-volatility narratives:
- Meme tokens
- Social coin launches (e.g., Launchcoin)
- Short-term speculation based on influencer sentiment
Retail’s edge? Speed, risk tolerance, and virality. Many of Token Metrics’ bold signals still originate from this activity before institutions catch on.
Token Metrics Bridging the Divide
What makes Token Metrics powerful in 2025 is its ability to serve both segments:
- Institutions use it for due diligence, grades, and long-term planning.
- Retail traders use it for short-term signals, alerts, and narrative tracking.
This dual capability creates a level playing field, where data, not capital, is the edge.
How to Trade Based on Who’s in Control
- When institutions lead – expect slower but more sustainable growth. Focus on high Investor Grade tokens.
- When retail leads – expect fast-moving pumps and dumps. Use high Trader Grade + bold signals.
- Hybrid phase (now) – Use both metrics to balance volatility and long-term conviction.
Market Behavior Patterns to Watch
- Low volatility + high inflows → Institutional buildup
- High volume + sudden spikes → Retail-driven narratives
- Diverging BTC vs. altcoin trends → Mixed sentiment cycles
Conclusion
The crypto market in 2025 is being driven by both the old guard and the new wave. Institutions bring maturity. Retail brings momentum. Smart investors use tools like Token Metrics to read the room — and position themselves accordingly.

Trader vs. Investor Grade: How to Use Both for Smarter Crypto Bets
Crypto trading success often boils down to timing. But how do you know when to enter — and when to stay long? Token Metrics solves this dilemma with a dual-grade system: Trader Grade and Investor Grade. Each grade serves a different investment goal, and together, they help you make more confident decisions, whether you’re day trading or holding for the long run.
What is the Trader Grade?
The Trader Grade measures short-term momentum. It uses AI to analyze price action, volume trends, technical indicators, and recent sentiment shifts. Scores range from 0 to 100, and a score above 80 signals strong short-term potential.
Use Case:
- Perfect for swing traders and short-term opportunists.
- Look for tokens with Trader Grade > 80 for potential breakout trades.
- Example: Launchcoin had a Trader Grade above 90 before its 35x rally began.
What is the Investor Grade?
The Investor Grade focuses on long-term fundamentals. It’s designed for those who want to hold tokens for months or even years. This grade considers tokenomics, development activity, ecosystem strength, narrative alignment, and long-term price structure.
Use Case:
- Ideal for long-term portfolio builders.
- A token with Investor Grade > 80 is a strong candidate for accumulation.
- AI infrastructure tokens and modular blockchains often rank high here.
Why Use Both?
Most traders fail by only looking at hype or short-term charts. Token Metrics lets you blend data:
- High Trader Grade + Low Investor Grade? Consider a short-term trade, not a long hold.
- High Investor Grade + Low Trader Grade? Consider waiting for a better entry point.
- Both High? Green light for confidence in both entry and long-term performance.
Case Study: Balancing Your Portfolio with Grades
Users can use the dual-grade approach for smarter allocation:
- 30% of capital to high Trader Grade tokens (short-term plays)
- 70% to high Investor Grade tokens (long-term holds)
This method helps mitigate risk and improve overall ROI.
Where to Find the Grades
Both grades are displayed prominently across:
- Token Detail Pages – Real-time grade updates with historical data
- Market Page Filters – Sort tokens by grade thresholds
- Portfolio Builder Tool – Automatically selects tokens with strong grades
Tips for Grade-Based Trading
- Use Trader Grade for volatile markets or when prices are accelerating.
- Use Investor Grade when building positions in strong narratives like AI, DeFi, or infrastructure.
- Avoid tokens with both grades below 60 unless you’re making a speculative bet.
Conclusion
Trading without context is gambling. Token Metrics’ Trader and Investor Grades give you a proven framework for assessing both momentum and fundamentals. Whether you’re here for a quick flip or a long-term bet, using the dual-grade system can level up your crypto strategy.

Inside the Dashboard: How to Monitor API Key Activity and Monthly Usage in Real Time
The power of any great API isn’t just in the data it provides — it’s also in the control, visibility, and accountability it gives developers. That’s why the Token Metrics API Dashboard is more than just a place to generate keys — it’s your real-time command center for monitoring API key usage, managing access, and optimizing performance.
In this article, we’ll explore how to use the Token Metrics API Dashboard to stay in control of your app’s data usage, track request history, and ensure your integrations remain secure and efficient.
📍 Where to Find It
To access the dashboard:
- Log in to your Token Metrics account.
- Go to: https://app.tokenmetrics.com/en/api
- Navigate to the API Keys and API Usage sections.
🔐 View and Manage API Keys
The API Keys section gives you a complete overview of every active key associated with your account. For each key, you’ll see:
- Key Name: Descriptive labels like "Bot A" or "Staging Server"
- Created Date: When the key was generated
- Last Used: Timestamp of the most recent request
- Status: Active or inactive toggle
- Actions: Trash icon to instantly delete a key
💡 Why It Matters:
- Spot unused or stale keys that may pose a security risk
- Instantly disable or delete a key if it’s compromised
- Monitor which app or environment is making the most requests
📊 Monitor API Usage in Real-Time
In the Usage Dashboard, Token Metrics gives you deep insights into how your API credits are being used.
Key metrics include:
- API Calls Graph
A daily call volume chart so you can identify peaks in usage, anomalies, or unexpected surges. - Total Monthly API Calls
Example:
8,750 / 20,000
See how much of your monthly quota you’ve used — and when it resets. - Remaining API Credits
Know exactly how many calls you have left in your current cycle. - API Call Statistics Table
Each row includes:
- Endpoint accessed (e.g., /trader-grade)
- Timestamp of the request
- Status code (200 = success, 401 = unauthorized, etc.)
- Originating IP address
- Success/failure response
- Endpoint accessed (e.g., /trader-grade)
🔄 Debugging & Insights Made Easy
This dashboard doesn’t just monitor—it helps you debug and optimize.
- Quickly identify if your integration is repeatedly hitting 400 or 403 errors
- Check whether a specific key is being overused or underused
- Pinpoint spikes in usage that may indicate unauthorized access
- See which endpoints are called most often — and consider caching results
⚠️ Avoid Rate Limit Surprises
If you’re on a Basic or Advanced plan, you’ll have a rate limit (e.g., 1 req/min for free users, up to 600 req/min for VIPs). The dashboard helps ensure you stay within your limits — and scale appropriately when needed.
🚀 Build Better with Transparency
In a production environment, visibility into API activity is critical. With Token Metrics, you’re never flying blind. You always know:
- Which app is using which key
- How many credits you’re using
- When to optimize or upgrade
From security to scaling, the Token Metrics API Dashboard gives you the insight you need to build with clarity and control.

Is the Crypto Market Bullish or Bearish? Why 2025 Is the Year of Neutral Momentum
The crypto market isn't clearly bullish or bearish in mid-2025 — it's neutral. This article explores why this 'in-between' momentum could signal a maturing market cycle, and what investors should watch for as signals normalize after a sharp $1T rebound in total market cap.
As we navigate through the midpoint of 2025, one question dominates trading desks and Telegram groups alike: Is the crypto market bullish or bearish? Surprisingly, the answer might be neither. Current indicators suggest that we are in a neutral zone — an ambiguous space where the market is no longer surging with euphoric gains but isn’t plunging into panic either.
From January through mid-May, the total crypto market cap has grown from $1 trillion to $2 trillion. This swift rebound signals recovery, but not full-blown optimism. Instead, many analysts — ourselves included — interpret this as a healthy correction and stabilization following intense early-year volatility.
This kind of environment often marks the early stages of a maturing cycle. Unlike the sharp swings we saw in previous bull and bear markets, 2025’s trend suggests more measured growth, driven by fundamentals rather than hype. In other words, the market might finally be learning from its past.
That doesn’t mean the space lacks activity. Sectors like DeFi lending and AI-related tokens continue to gain traction, with significant TVL inflows. Retail interest in meme coins also remains high in select regions. But overall, what we’re seeing is consolidation — not chaos.
In this neutral setting, strategy matters more than sentiment. It's no longer about jumping into trending narratives or panic-selling on dips. Instead, identifying projects with real use cases, sustainable economics, and strong communities has become the foundation of long-term success.
For traders and builders alike, the current landscape offers both challenges and opportunities. Risk-adjusted returns are key, and disciplined portfolio rebalancing could be one of the most underrated strategies right now.
As we continue monitoring market signals, we remain committed to surfacing actionable insights backed by real-time data, not just narratives. Whether the next breakout is weeks or months away, staying informed — and unemotional — may prove to be your best edge.
How Token Metrics Helps in a Neutral Market Environment:
In times of neutral momentum, making profitable crypto decisions becomes more complex — and that's where Token Metrics shines:
- Actionable AI Signals:
Token Metrics scans thousands of tokens daily, using over 80 data points to identify bullish and bearish trends even when market sentiment is flat. This helps users cut through noise and act on real opportunities.
- Investor & Trader Grades:
When hype fades, fundamentals matter. Our proprietary grades evaluate both short-term momentum and long-term viability, helping users discover tokens with staying power — not just temporary pumps.
- Smart Rebalancing Alerts:
In a consolidating market, maintaining the right portfolio mix is crucial. Token Metrics' indices and alerts help users rebalance regularly to lock in gains and minimize downside risks.
- Sector-Based Insights:
With DeFi, AI, and meme coins behaving differently, Token Metrics allows users to dive deep into sector-specific analytics — so you can position ahead of capital flows.
- Sentiment & Volume Monitoring:
Our platform tracks shifts in on-chain activity, social sentiment, and volume trends to spot early signs of market reversals — especially useful when traditional signals stall.
In a market where being early beats being emotional, Token Metrics equips you with the clarity and tools to trade with confidence.

🚀 Announcing the Launch of the Token Metrics API & SDK — Powered by $TMAI
Introducing the Token Metrics API: Power Your Crypto Tools with AI-Driven Intelligence
We’re thrilled to announce one of our most important product launches to date: the Token Metrics API is now live.
This powerful crypto API gives developers, quant traders, and crypto startups direct access to the core AI infrastructure that powers the Token Metrics platform. Whether you’re building trading agents, investor dashboards, research tools, or mobile apps, our API and SDKs provide everything you need to build with real-time crypto data and intelligence—right out of the box.
For the first time, you can plug into the same AI API that drives our ratings, signals, and predictions—and embed it directly into your products, tools, or internal systems.
🔍 What’s Inside the Token Metrics API?
Our crypto API is designed to give you high-performance access to the exact data models we use in-house:
✅ AI Trading Signals
Access bullish and bearish calls across thousands of tokens. These API endpoints are powered by machine learning models trained on historical price action, sentiment data, and blockchain activity.
✅ Investor & Trader Grades
Through our API, you can pull dynamic 0–100 grades on any token. Designed for long-term or short-term views, these scores factor in volatility, momentum, market cap trends, and our proprietary AI predictions.
✅ AI Reports & Conversation Crypto Agent
Query the API to generate custom reports and insights using our smart crypto assistant. Analyze market trends, token health, and investment opportunities—without writing your own models.
✅ Token Performance Data
Retrieve token-level analytics like ROI, predictive volatility, and asset rankings. Perfect for powering dashboards, investor tools, or internal models.
✅ Market Sentiment Models
Use the API to access our AI-modeled sentiment engine, built from social media, news data, and trend signals—ideal for gauging crowd psychology.
All Token Metrics API endpoints are RESTful, fast, and easy to integrate. SDKs for Python, Node.js, and other environments help developers onboard quickly.
🛠️ What You Can Build With the Token Metrics API
Our users are already building next-gen tools and automation using the Token Metrics API:
- 🤖 CEX Trading Agents — Automate entries and exits with real-time signals and token grades
- ⛓️ DEX Arbitrage Engines — Scan price differences across DeFi and act instantly
- 📊 Analytics Dashboards — Build data-driven tools with predictive metrics and visualizations
- 💬 Alert Bots for Telegram & Discord — Deliver actionable alerts using our signal API
- 📱 Web & Mobile Crypto Apps — Enhance portfolios and research apps with AI intelligence
With just a few lines of code and an API key, you can turn static crypto apps into dynamic, intelligent systems.
💸 Affordable Pricing & $TMAI Utility
We’ve designed our crypto API pricing to be flexible and accessible:
- Plans start at $99/month, with high usage limits
- Save up to 35% when you pay with our native token, $TMAI
- All tiers include access to powerful AI tools and real-time crypto data
Whether you're a solo dev or scaling a trading startup, there’s a plan built for you. Paying with $TMAI also deepens your utility in the Token Metrics ecosystem—this is just the beginning of native token perks.
🧪 Try the Token Metrics API for Free
Not ready to commit? Try our free API tier with:
- Limited endpoints to explore
- Access to live documentation and test queries
- Sample code and SDKs for instant implementation
Start exploring at tokenmetrics.com/api
🌐 Why We Built This Crypto API
Token Metrics has always been focused on empowering smarter investing. But as the market evolves, we believe the future lies in infrastructure, automation, and open access.
That’s why we built the Token Metrics API—to give developers access to the exact AI systems we use ourselves. Our models have been fine-tuned over years, and now, that same intelligence can power your platform, tools, or trading agents.
Whether you're building research platforms, signal-based apps, or automated execution tools—this API is your edge.
⚡ Start Building with Token Metrics API for FREE→ tokenmetrics.com/api
The crypto market never sleeps—and with the Token Metrics API, neither do your tools.

Inside Token Metrics’ Market Page Upgrade: Smarter Signal Discovery
Introduction
With thousands of crypto tokens flooding the market, finding the best-performing assets can feel like searching for a needle in a haystack. Token Metrics is solving this with a revamped Market Page experience — designed to surface top signals faster and help users make smarter trading decisions.
Why the Market Page Matters
The Market Page is the heartbeat of Token Metrics' analytics platform. It showcases real-time data on the latest bullish and bearish signals across tokens, providing users with instant access to the platform’s top-rated opportunities. With the recent update, it’s now more powerful and user-friendly than ever.
What’s New in the Market Page?
- Top-Performing Signals First – The layout now prioritizes tokens with the highest ROI bold signals. This means the most alpha-generating opportunities are surfaced first — saving users valuable time.
- Smarter Filters – Users can sort by return, grade, time frame, and signal type. Want only tokens with a Trader Grade above 80? Just one click away.
- Improved Visuals – A cleaner UI now highlights key metrics like entry price, ROI since signal, and latest update date.
How It Helps Traders
This upgrade isn't just cosmetic. It fundamentally changes how traders interact with the platform:
- Faster decision-making by highlighting the best signals up front
- Better precision using advanced filters for investor profiles
- Increased confidence from seeing clear data behind every signal
Case Study: Launch Coin
Launch Coin, the best performing token in 2025 with a 35x return, was identified early thanks to the Market Page’s bold signal tracking. Its signal rose to the top immediately after performance started climbing — helping early users lock in life-changing gains.
How to Use the Market Page Like a Pro
- Visit the Market Page daily to track new signal updates
- Filter by 24H/7D ROI to catch fast movers
- Use Grades to Align with Your Strategy
- Follow Narratives: Filter by AI, DeFi, Gaming, and other emerging themes
The Power of Daily Signals
With market conditions changing fast, the daily updates on the Market Page give Token Metrics users an edge — surfacing fresh opportunities before they trend on social media or make headlines.
Conclusion
The new Market Page isn’t just a dashboard — it’s a discovery engine. Designed for both beginner and experienced traders, it brings clarity, speed, and precision to crypto investing.

Bitcoin vs. Altcoin Season: Where the Market's Headed in 2025
Introduction
In the ever-evolving world of crypto, understanding the cyclical relationship between Bitcoin and altcoins is crucial for successful trading. During Token Metrics’ latest market update, Ian Balina highlighted key indicators pointing to a shift in momentum — possibly signaling the return of an altcoin season.
What Is Altcoin Season?
Altcoin season is a period in the crypto market where altcoins outperform Bitcoin in terms of price gains. Historically, this shift occurs when Bitcoin stabilizes after a rally, giving room for capital rotation into smaller-cap tokens with higher risk/reward potential.
Bitcoin’s Dominance and the Signs of Rotation
As of May 2025, Bitcoin remains a market anchor, but its dominance is showing signs of plateauing. Ian pointed out that capital is beginning to flow into AI tokens, new infrastructure plays, and community-driven projects like Launchcoin — which has already returned 35x gains. These trends are classic precursors to altcoin season.
Top Performing Altcoins Identified by Token Metrics
Token Metrics’ bold signals have identified several high-performing altcoins, such as:
- Launchcoin: 35x gain since the signal triggered.
- AI Infrastructure Tokens: Benefiting from the broader AI narrative in crypto.
- DeFi 2.0 Protocols: Getting renewed attention amid institutional interest.
Key Indicators to Watch
- Bitcoin Dominance Chart – A drop below 50% dominance often precedes altcoin rallies.
- Volume Trends – Increasing volume on altcoin pairs indicates rising interest.
- Token Metrics Grades – Look for altcoins with high Trader and Investor Grades — a dual signal of short- and long-term strength.
How to Prepare Your Portfolio
Traders should consider gradual rotation — locking in BTC gains and reallocating to top-rated altcoins. Using Token Metrics’ tools:
- Monitor daily signal updates
- Filter by Trader Grade > 80 and recent bold signals
- Keep an eye on AI and DeFi narratives, as they dominate 2025’s momentum
Conclusion
Whether we’re entering a full-blown altcoin season or just a mini-cycle, the signals are clear: capital is rotating. Use data, not guesswork. With Token Metrics’ AI-powered tools, you can identify high-potential opportunities and stay ahead of the curve in both Bitcoin and altcoin markets.

Rise of AI Coins: How AI Narratives Are Fueling the Next Bull Run
Introduction
AI is no longer just a tech buzzword — it’s a dominant force driving the next wave of crypto innovation. In 2025, artificial intelligence has found a new frontier: blockchain. From infrastructure protocols to AI-native tokens, the market is seeing a surge in interest, investment, and returns for coins tied to the AI narrative. Token Metrics is at the forefront, helping users identify these explosive opportunities.
Why AI Coins Are Surging
The intersection of AI and crypto isn’t random. Three forces are converging to power this narrative:
- Mainstream AI Adoption – With tools like ChatGPT and Claude going mainstream, interest in AI has exploded.
- Decentralized Intelligence – Blockchain offers a secure, transparent way to distribute AI models and datasets.
- Speculative Momentum – The hype around AI is creating high-risk, high-reward token launches with strong upside potential.
Token Metrics’ AI Token Detection Strategy
Token Metrics uses its proprietary AI to identify early momentum in the market. Here's how it helped surface the best-performing AI tokens:
- Volume spikes and unusual trading patterns
- Token grades showing >80 Trader Score
- Bold signals based on narrative tracking
- Cross-chain analysis for upcoming projects
Ian Balina noted during the recent webinar that several AI coins have already delivered outsized returns — and this is just the beginning.
Examples of AI Tokens to Watch
- Launch Coin – While not an AI token itself, its virality shows how fast narratives spread.
- AI Infrastructure Projects – Platforms building decentralized compute for training and deploying models.
- AI DeFi Hybrids – Tokens merging machine learning with trading, risk management, or yield optimization.
How to Ride the AI Wave
Using the Token Metrics platform, here’s how to position your portfolio:
- Use Bold Signals: Sort by AI narrative to find breakout projects.
- Set Alerts: Monitor new signal generation across top AI narratives.
- Filter by Grade: Combine high Trader Grade with AI tag for high-conviction trades.
What This Means for Investors
The AI narrative is not a flash in the pan. It represents a paradigm shift in both technology and finance. Tokens that combine utility, vision, and timing will thrive. As always, early entry is key — and that’s where Token Metrics’ daily insights give users the edge.
Conclusion
AI tokens are fueling the next crypto bull run — and the smartest investors are already positioned. With real-time signals, narrative filters, and AI-powered grading, Token Metrics is your map through the chaos. The next big opportunity may already be on the Market Page.

📈 Launch Coin’s Wild Ride: From 54 SOL to $4 Million
The crypto world thrives on narratives, and few have captured attention in recent weeks like Launchcoin. Born from a blend of SocialFi innovation and meme-driven virality, Launchcoin has surged into the spotlight—offering both eye-popping returns and warnings of extreme volatility. Powered by Token Metrics’ AI insights, here’s a detailed look at where Launchcoin stands today.
🚀 AI Detected the Breakout Early
On April 20, 2025, Token Metrics’ proprietary AI model flipped bullish on Launchcoin. Since then, the token has rallied over 3x, proving the strength of the signal. Backed by machine learning models that track on-chain data, sentiment, and price action across multiple timeframes, the Trader Grade for Launchcoin is currently at a whopping 93.15%, designating it a Strong Buy in the short term.
However, after such an exponential surge, the platform’s analysts expect natural pullbacks as early buyers and whales begin to take profits. These corrections are healthy and expected in any meteoric price run—and should not be confused with a loss of fundamental strength.
🧠 Token Metrics Investor Grade: A Balanced Perspective
While short-term indicators are overwhelmingly bullish, the Investor Grade remains neutral, pointing to a more measured view on Launchcoin’s long-term potential. This signals that while there’s momentum, there are still structural risks—particularly due to its meme coin characteristics and reliance on hype cycles.
Still, a neutral long-term grade isn’t bearish. It suggests Launchcoin is currently stable at its elevated valuation, but investors should monitor developments carefully—especially as new features and ecosystem growth unfold.
📈 Launchcoin’s Wild Ride: From 54 SOL to $4 Million
The Launchcoin story has already minted millionaires. One trader reportedly turned an $8,191 investment (54 SOL) into $4 million after purchasing 14.62 million LAUNCHCOIN tokens when the market cap was below $500,000. This kind of exponential return is rare—even in crypto—and helped drive speculative interest across social media and trading forums.
Within just 22 days, Launchcoin’s market cap crossed $300 million, illustrating how quickly meme-based projects can capture market momentum, especially when they ride the wave of a compelling narrative.
🔄 Listings and Market Access
Launchcoin’s liquidity and accessibility have improved significantly. The token is now trading on major centralized exchanges:
- Spot listings: Bitget, KuCoin, Gate.io, and MEXC
- Futures: Recently launched on ByBit
These listings have broadened exposure, attracting a wider investor base and allowing leveraged traders to participate. Increased liquidity also reduces slippage, enabling larger capital inflows while minimizing execution risk.
🎭 From PASTERNAK to LAUNCHCOIN: The Rebranding
Initially launched as PASTERNAK, named after Believe’s founder Ben Pasternak, the project was rebranded to Launchcoin on May 2, 2025. The new name better reflects its core value proposition: empowering creators to launch tokens through a SocialFi model.
The model is simple but revolutionary—anyone can create a token by posting on social media with the “@launchcoin” tag. This lowers the barrier for entry into token creation and adds viral potential to every social interaction.
🧨 Risk and Volatility: A Speculative Bet
Despite its recent success, Launchcoin remains a highly speculative asset. Its meteoric rise is reminiscent of meme coin cycles seen with tokens like PEPE or DOGE. While Launchcoin offers a unique utility layer with its token-creation feature, its current valuation includes a significant hype premium.
Token Metrics encourages traders to stay nimble. With the AI trading signals, users can track grade changes in real-time, ensuring they’re not caught off guard by sharp reversals or cooldowns.
🧠 Final Thoughts
Launchcoin represents a blend of viral marketing, social token innovation, and AI-predicted trading opportunity. With strong short-term momentum, neutral long-term positioning, and significant ecosystem buzz, it’s a token to watch—but not without caution.
Whether you’re a trader riding the momentum or an investor assessing long-term viability, Token Metrics provides the data-driven edge to navigate Launchcoin’s volatility with confidence.
New Token Metrics Products
Featured Posts
NFT's Blogs
Crypto Basics Blog
Research Blogs
Announcement Blogs


9450 SW Gemini Dr
PMB 59348
Beaverton, Oregon 97008-7105 US
No Credit Card Required

Online Payment
SSL Encrypted
.png)
Products
Subscribe to Newsletter
Token Metrics Media LLC is a regular publication of information, analysis, and commentary focused especially on blockchain technology and business, cryptocurrency, blockchain-based tokens, market trends, and trading strategies.
Token Metrics Media LLC does not provide individually tailored investment advice and does not take a subscriber’s or anyone’s personal circumstances into consideration when discussing investments; nor is Token Metrics Advisers LLC registered as an investment adviser or broker-dealer in any jurisdiction.
Information contained herein is not an offer or solicitation to buy, hold, or sell any security. The Token Metrics team has advised and invested in many blockchain companies. A complete list of their advisory roles and current holdings can be viewed here: https://tokenmetrics.com/disclosures.html/
Token Metrics Media LLC relies on information from various sources believed to be reliable, including clients and third parties, but cannot guarantee the accuracy and completeness of that information. Additionally, Token Metrics Media LLC does not provide tax advice, and investors are encouraged to consult with their personal tax advisors.
All investing involves risk, including the possible loss of money you invest, and past performance does not guarantee future performance. Ratings and price predictions are provided for informational and illustrative purposes, and may not reflect actual future performance.