


.png)


.png)
.png)


.png)


.png)
%201%20(1).png)

.png)


.png)


.png)
.png)


.png)


.png)

.png)
.png)
.png)
.png)
.png)
.png)
.png)
.png)
.png)


.png)


.png)

.png)
.png)


.png)


.png)
.png)
.png)
.png)

.png)
.png)


Research
Top Crypto Trading Platforms in 2025
When it comes to crypto trading platforms, Token Metrics is not an exchange, but a crypto analytics and crypto trading intelligence platform powered by AI.
Token Metrics Team
10


%201.svg)
%201.svg)
Big news: We’re cranking up the heat on AI-driven crypto analytics with the launch of the Token Metrics API and our official SDK (Software Development Kit). This isn’t just an upgrade – it's a quantum leap, giving traders, hedge funds, developers, and institutions direct access to cutting-edge market intelligence, trading signals, and predictive analytics.
Crypto markets move fast, and having real-time, AI-powered insights can be the difference between catching the next big trend or getting left behind. Until now, traders and quants have been wrestling with scattered data, delayed reporting, and a lack of truly predictive analytics. Not anymore.
The Token Metrics API delivers 32+ high-performance endpoints packed with powerful AI-driven insights right into your lap, including:
Getting started with the Token Metrics API is simple:
At Token Metrics, we believe data should be decentralized, predictive, and actionable.
The Token Metrics API & SDK bring next-gen AI-powered crypto intelligence to anyone looking to trade smarter, build better, and stay ahead of the curve. With our official SDK, developers can plug these insights into their own trading bots, dashboards, and research tools – no need to reinvent the wheel.
The Layer 1 landscape is consolidating as users and developers gravitate to chains with clear specialization. Bitcoin Cash positions itself as a payment-focused chain with low fees and quick settlement for everyday usage.
The scenario projections below map potential outcomes for BCH across different total crypto market sizes. Base cases assume steady usage and listings, while moon scenarios factor in stronger liquidity and accelerated adoption.

Disclosure
Educational purposes only, not financial advice. Crypto is volatile, do your own research and manage risk.
How to read it: Each band blends cycle analogues and market-cap share math with TA guardrails. Base assumes steady adoption and neutral or positive macro. Moon layers in a liquidity boom. Bear assumes muted flows and tighter liquidity.
TM Agent baseline:
Token Metrics lead metric for Bitcoin Cash, cashtag $BCH, is a TM Grade of 54.81%, which translates to Neutral, and the trading signal is bearish, indicating short-term downward momentum. This implies Token Metrics views $BCH as mixed value long term: fundamentals look strong, while valuation and technology scores are weak, so upside depends on improvements in adoption or technical development. Market context: Bitcoin has been setting market direction, and with broader risk-off moves altcoins face pressure, which increases downside risk for $BCH in the near term.
Live details:
Affiliate Disclosure: We may earn a commission from qualifying purchases made via this link, at no extra cost to you.
Token Metrics scenarios span four market cap tiers, each representing different levels of crypto market maturity and liquidity:


Each tier assumes progressively stronger market conditions, with the base case reflecting steady growth and the moon case requiring sustained bull market dynamics.
Bitcoin Cash represents one opportunity among hundreds in crypto markets. Token Metrics Indices bundle BCH with top one hundred assets for systematic exposure to the strongest projects. Single tokens face idiosyncratic risks that diversified baskets mitigate.
Historical index performance demonstrates the value of systematic diversification versus concentrated positions.
Bitcoin Cash is a peer-to-peer electronic cash network focused on fast confirmation and low fees. It launched in 2017 as a hard fork of Bitcoin with larger block capacity to prioritize payments. The chain secures value transfers using proof of work and aims to keep everyday transactions affordable.
BCH is used to pay transaction fees and settle transfers, and it is widely listed across major exchanges. Adoption centers on payments, micropayments, and remittances where low fees matter. It competes as a payment‑focused Layer 1 within the broader crypto market.
Token Metrics AI provides comprehensive context on Bitcoin Cash's positioning and challenges.
Vision:
Bitcoin Cash (BCH) is a cryptocurrency that emerged from a 2017 hard fork of Bitcoin, aiming to function as a peer-to-peer electronic cash system with faster transactions and lower fees. It is known for prioritizing on-chain scalability by increasing block sizes, allowing more transactions per block compared to Bitcoin. This design choice supports its use in everyday payments, appealing to users seeking a digital cash alternative. Adoption has been driven by its utility in micropayments and remittances, particularly in regions with limited banking infrastructure. However, Bitcoin Cash faces challenges including lower network security due to reduced mining hash rate compared to Bitcoin, and ongoing competition from both Bitcoin and other scalable blockchains. Its value proposition centers on accessibility and transaction efficiency, but it operates in a crowded space with evolving technological and regulatory risks.
Problem:
The project addresses scalability limitations in Bitcoin, where rising transaction fees and slow confirmation times hinder its use for small, frequent payments. As Bitcoin evolved into a store of value, a gap emerged for a blockchain-based currency optimized for fast, low-cost transactions accessible to the general public.
Solution:
Bitcoin Cash increases block size limits from 1 MB to 32 MB, enabling more transactions per block and reducing congestion. This on-chain scaling approach allows for faster confirmations and lower fees, making microtransactions feasible. The network supports basic smart contract functionality and replay protection, maintaining compatibility with Bitcoin's core architecture while prioritizing payment utility.
Market Analysis:
Bitcoin Cash operates in the digital currency segment, competing with Bitcoin, Litecoin, and stablecoins for use in payments and remittances. While not the market leader, it occupies a niche focused on on-chain scalability for transactional use. Its adoption is influenced by merchant acceptance, exchange liquidity, and narratives around digital cash. Key risks include competition from layer-2 solutions on other blockchains, regulatory scrutiny of cryptocurrencies, and lower developer and miner activity compared to larger networks. Price movements are often tied to broader crypto market trends and internal protocol developments. Despite its established presence, long-term growth depends on sustained utility, network security, and differentiation in a market increasingly dominated by high-throughput smart contract platforms.
Fundamental Grade: 80.41% (Community 62%, Tokenomics 100%, Exchange 100%, VC —, DeFi Scanner 72%).
Technology Grade: 29.63% (Activity 22%, Repository 70%, Collaboration 48%, Security —, DeFi Scanner 72%).
Can BCH reach $3,000?
Based on the scenarios, BCH could reach $3,000 in the 23T moon case and 31T base case. The 23T tier projects $3,446.53 in the moon case. Not financial advice.
Can BCH 10x from current levels?
At current price of $553.54, a 10x would reach $5,535.40. This falls within the 31T base and moon cases. Bear in mind that 10x returns require substantial market cap expansion. Not financial advice.
Should I buy BCH now or wait?
Timing depends on your risk tolerance and macro outlook. Current price of $553.54 sits below the 8T bear case in our scenarios. Dollar-cost averaging may reduce timing risk. Not financial advice.
Want exposure? Buy BCH on MEXC
Disclosure
Educational purposes only, not financial advice. Crypto is volatile, do your own research and manage risk.
Infrastructure protocols become more valuable as the crypto ecosystem scales and relies on robust middleware. Chainlink provides critical oracle infrastructure where proven utility and deep integrations drive long-term value over retail speculation. Increasing institutional adoption raises demand for professional-grade data delivery and security.
Token Metrics projections for LINK below span multiple total market cap scenarios from conservative to aggressive. Each tier assumes different levels of infrastructure demand as crypto evolves from speculative markets to institutional-grade systems. These bands frame LINK's potential outcomes into 2027.

Disclosure
Educational purposes only, not financial advice. Crypto is volatile, do your own research and manage risk.
How to read it: Each band blends cycle analogues and market-cap share math with TA guardrails. Base assumes steady adoption and neutral or positive macro. Moon layers in a liquidity boom. Bear assumes muted flows and tighter liquidity.
TM Agent baseline: Token Metrics lead metric for Chainlink, cashtag $LINK, is a TM Grade of 23.31%, which translates to a Sell, and the trading signal is bearish, indicating short-term downward momentum. This means Token Metrics currently does not endorse $LINK as a long-term buy at current conditions.
Live details: Chainlink Token Details
Affiliate Disclosure: We may earn a commission from qualifying purchases made via this link, at no extra cost to you.
Token Metrics scenarios span four market cap tiers, each representing different levels of crypto market maturity and liquidity:
8T: At an 8 trillion dollar total crypto market cap, LINK projects to $26.10 in bear conditions, $30.65 in the base case, and $35.20 in bullish scenarios.
16T: Doubling the market to 16 trillion expands the range to $42.64 (bear), $56.29 (base), and $69.95 (moon).
23T: At 23 trillion, the scenarios show $59.18, $81.94, and $104.70 respectively.
31T: In the maximum liquidity scenario of 31 trillion, LINK could reach $75.71 (bear), $107.58 (base), or $139.44 (moon).
Chainlink represents one opportunity among hundreds in crypto markets. Token Metrics Indices bundle LINK with top one hundred assets for systematic exposure to the strongest projects. Single tokens face idiosyncratic risks that diversified baskets mitigate.
Historical index performance demonstrates the value of systematic diversification versus concentrated positions.
Chainlink is a decentralized oracle network that connects smart contracts to real-world data and systems. It enables secure retrieval and verification of off-chain information, supports computation, and integrates across multiple blockchains. As adoption grows, Chainlink serves as critical infrastructure for reliable data feeds and automation.
The LINK token is used to pay node operators and secure the network’s services. Common use cases include DeFi price feeds, insurance, and enterprise integrations, with CCIP extending cross-chain messaging and token transfers.
Vision: Chainlink aims to create a decentralized, secure, and reliable network for connecting smart contracts with real-world data and systems. Its vision is to become the standard for how blockchains interact with external environments, enabling trust-minimized automation across industries.
Problem: Smart contracts cannot natively access data outside their blockchain, limiting their functionality. Relying on centralized oracles introduces single points of failure and undermines the security and decentralization of blockchain applications. This creates a critical need for a trustless, tamper-proof way to bring real-world information onto blockchains.
Solution: Chainlink solves this by operating a decentralized network of node operators that fetch, aggregate, and deliver data from off-chain sources to smart contracts. It uses cryptographic proofs, reputation systems, and economic incentives to ensure data integrity. The network supports various data types and computation tasks, allowing developers to build complex, data-driven decentralized applications.
Market Analysis: Chainlink is a market leader in the oracle space and a key infrastructure component in the broader blockchain ecosystem, particularly within Ethereum and other smart contract platforms. It faces competition from emerging oracle networks like Band Protocol and API3, but maintains a strong first-mover advantage and widespread integration across DeFi, NFTs, and enterprise blockchain solutions. Adoption is driven by developer activity, partnerships with major blockchain projects, and demand for secure data feeds. Key risks include technological shifts, regulatory scrutiny on data providers, and execution challenges in scaling decentralized oracle networks. As smart contract usage grows, so does the potential for oracle services, positioning Chainlink at the center of a critical niche, though its success depends on maintaining security and decentralization over time.
Fundamental Grade: 74.58% (Community 81%, Tokenomics 100%, Exchange 100%, VC —, DeFi Scanner 17%).
Technology Grade: 88.50% (Activity 81%, Repository 72%, Collaboration 100%, Security 86%, DeFi Scanner 17%).
Can LINK reach $100?
Yes. Based on the scenarios, LINK could reach $100+ in the 23T moon case. The 23T tier projects $104.70 in the moon case. Not financial advice.
What price could LINK reach in the moon case?
Moon case projections range from $35.20 at 8T to $139.44 at 31T. These scenarios assume maximum liquidity expansion and strong Chainlink adoption. Not financial advice.
Should I buy LINK now or wait?
Timing depends on risk tolerance and macro outlook. Current price of $18.09 sits below the 8T bear case in the scenarios. Dollar-cost averaging may reduce timing risk. Not financial advice.
Track live grades and signals: Token Details
Want exposure? Buy LINK on MEXC
Disclosure
Educational purposes only, not financial advice. Crypto is volatile, do your own research and manage risk.
Discover the full potential of your crypto research and portfolio management with Token Metrics. Our ratings combine AI-driven analytics, on-chain data, and decades of investing expertise—giving you the edge to navigate fast-changing markets. Try our platform to access scenario-based price targets, token grades, indices, and more for institutional and individual investors. Token Metrics is your research partner through every crypto market cycle.
The crypto market is tilting bullish into 2026 as liquidity, infrastructure, and participation improve across the board. Clearer rules and standards are reshaping the classic four-year cycle, flows can arrive earlier, and strength can persist longer than in prior expansions.
Institutional access is widening through ETFs and custody, while L2 scaling and real-world integrations help sustain on‑chain activity. This healthier backdrop frames our scenario work for HYPE. The ranges below reflect different total crypto market sizes and the share Hyperliquid could capture under each regime.

Disclosure
Educational purposes only, not financial advice. Crypto is volatile, do your own research and manage risk.
How to read it: Each band blends cycle analogues and market-cap share math with TA guardrails. Base assumes steady adoption and neutral or positive macro. Moon layers in a liquidity boom. Bear assumes muted flows and tighter liquidity.
TM Agent baseline: Token Metrics TM Grade is 73.9%, a Buy, and the trading signal is bearish, indicating short-term downward momentum. This means Token Metrics judges HYPE as fundamentally attractive over the long term, while near-term momentum is negative and may limit rallies.
Live details: Hyperliquid Token Details
Affiliate Disclosure: We may earn a commission from qualifying purchases made via this link, at no extra cost to you.
Scenario Analysis
Token Metrics scenarios span four market cap tiers, each representing different levels of crypto market maturity and liquidity:
8T: At an 8 trillion dollar total crypto market cap, HYPE projects to $48.81 in bear conditions, $49.92 in the base case, and $51.03 in bullish scenarios.
16T: Doubling the market to 16 trillion expands the range to $50.72 (bear), $54.05 (base), and $57.38 (moon).
23T: At 23 trillion, the scenarios show $52.62, $58.17, and $63.72 respectively.
31T: In the maximum liquidity scenario of 31 trillion, HYPE could reach $54.52 (bear), $62.29 (base), or $70.07 (moon).
Each tier assumes progressively stronger market conditions, with the base case reflecting steady growth and the moon case requiring sustained bull market dynamics.
Diversification matters. HYPE is compelling, yet concentrated bets can be volatile. Token Metrics Indices hold HYPE alongside the top one hundred tokens for broad exposure to leaders and emerging winners.
Our backtests indicate that owning the full market with diversified indices has historically outperformed both the total market and Bitcoin in many regimes due to diversification and rotation.
Hyperliquid is a decentralized exchange focused on perpetual futures with a high-performance order book architecture. The project emphasizes low-latency trading, risk controls, and capital efficiency aimed at professional and retail derivatives traders. Its token, HYPE, is used for ecosystem incentives and governance-related utilities.
Can HYPE reach $60?
Yes, the 23T and 31T tiers imply ranges above $60 in the Base and Moon bands, though outcomes depend on liquidity and adoption. Not financial advice.
Is HYPE a good long-term investment?
Outcome depends on adoption, liquidity regime, competition, and supply dynamics. Diversify and size positions responsibly.
Disclosure
Educational purposes only, not financial advice. Crypto is volatile, do your own research and manage risk.
Token Metrics delivers AI-based crypto ratings, scenario projections, and portfolio tools so you can make smarter decisions. Discover real-time analytics on Token Metrics.

Etherscan has revolutionized the way we interact with the Ethereum blockchain. With its powerful features and user-friendly interface, Etherscan provides a comprehensive overview of Ethereum transactions and smart contracts.
Whether you're an investor, developer, or simply curious about blockchain technology, Etherscan offers valuable insights and tools to navigate the Ethereum network effectively.
In this article, we will explore the Etherscan platform by highlighting its functionalities, benefits, and we will discover the endless possibilities it unlocks for the Ethereum ecosystem. So let's start by understanding, what exactly is Etherscan?
Etherscan is a blockchain explorer specifically designed for the Ethereum network. It was launched in 2015 by a team of blockchain enthusiasts with the goal of providing a reliable and user-friendly platform for exploring and analyzing the Ethereum network.
In simple words, Etherscan serves as a window into the Ethereum blockchain, allowing users to easily search, verify, and explore transactions, addresses, and smart contracts. Etherscan provides a user-friendly interface that simplifies the process of navigating through the vast amount of data on the Ethereum blockchain.
Etherscan works by providing a user-friendly interface to access and analyze blockchain data. When a user interacts with Etherscan, they can search for specific transactions, wallet addresses, or smart contracts.
To use Etherscan, just enter a public Ethereum wallet address into the search bar located at the top of the Etherscan.io homepage. By doing this, users gain access to a comprehensive list of transactions linked to that specific address.

Etherscan retrieves and presents detailed information about the requested data, such as transaction status, sender and recipient addresses, gas fees, and even the associated smart contract code. This information helps users verify the validity of transactions and track the movement of tokens on the Ethereum network.

Moreover, Etherscan allows users to monitor and track specific wallet addresses. By entering an address, users can view the balance, transaction history, and token holdings associated with that address. This feature enables individuals to keep a close eye on their Ethereum holdings and monitor the activity of their wallets.
Reading Etherscan is a straightforward process that allows users to understand and interpret the information presented on the platform. To read Etherscan effectively, users should follow these simple steps:
By following these steps, users can easily read and comprehend the information displayed on Etherscan, gaining insights into Ethereum transactions, addresses, and smart contracts.
Etherscan provides so many features with an intuitive interface, which makes it easy for individuals and businesses to explore the Ethereum network effortlessly. Let's delve deeper into its key features, uses and functionalities.
Following the Footsteps of Ethereum Transactions - Etherscan's transaction tracking feature enables users to monitor and trace Ethereum transactions in real-time.
By simply entering the transaction hash or wallet address, users can gain valuable insights into transaction details, including the sender, recipient, timestamp, gas used, and more. This feature proves invaluable for traders, investors, and businesses seeking transparency and accountability within the Ethereum ecosystem.
Decoding the Power of Ethereum Smart Contracts - Ethereum's smart contracts have revolutionized industries by introducing programmable and decentralized applications. Etherscan provides a comprehensive platform for analyzing these smart contracts.
By entering the contract address, users can explore contract details, view transaction history, and access source code. This functionality proves essential for developers and auditors, ensuring the integrity and security of smart contracts.
Tracking Ethereum Assets - Etherscan allows users to monitor their Ethereum account balances and token holdings effortlessly.
By simply inputting the wallet address, users can obtain an overview of their account balance, token portfolio, and transaction history. This functionality proves particularly useful for individuals managing multiple wallets and diversified token investments.
Exploring the Vast Ethereum Token Ecosystem - The Ethereum blockchain is home to a vast array of tokens, each serving unique purposes within the ecosystem.
Etherscan's Token Tracker provides a comprehensive list of ERC-20, ERC-721, and ERC-1155 tokens, allowing users to explore token details, holders, and transaction history. This feature proves valuable for investors, traders, and developers looking to gain insights into the token economy.
Unveiling the Details of Smart Contract Interactions - Ethereum's event logs capture important data about smart contract interactions. Etherscan allows users to explore these event logs, providing a detailed overview of contract events, their parameters, and associated transactions.
This feature proves invaluable for developers and auditors seeking to understand the inner workings of smart contracts.
Optimizing Ethereum Transaction Costs - Gas is the fuel that powers transactions and smart contracts on the Ethereum network. Etherscan's Gas Tracker feature enables users to monitor and analyze gas prices, ensuring optimal cost efficiency.
By providing real-time gas data, Etherscan helps users make informed decisions regarding transaction fees and contract deployment costs.
While Etherscan is a widely used and trusted blockchain explorer for the Ethereum network, there are also alternative platforms available that offer similar functionalities.
These alternatives provide users with additional options for exploring and analyzing the Ethereum blockchain. Some notable Etherscan alternatives include:
Etherchain: Etherchain is a popular blockchain explorer that offers comprehensive transaction tracking, address monitoring, and smart contract exploration features. It provides users with detailed information about Ethereum transactions and addresses, allowing for in-depth analysis of the blockchain.
Blockchair: Blockchair is a versatile blockchain explorer that supports multiple blockchains, including Ethereum. It provides users with the ability to explore transactions, addresses, and blocks, along with advanced search options and data export capabilities.
Ethplorer: Ethplorer is a user-friendly Ethereum explorer that focuses on token analytics. It allows users to easily search for and explore ERC-20 and ERC-721 tokens, view token balances, transaction history, and token holders.
TokenView: TokenView is a comprehensive blockchain explorer that supports Ethereum and various other blockchains. It offers features such as transaction tracking, address monitoring, token analytics, and market data, providing users with a holistic view of the blockchain ecosystem.
Q1. How can I access Etherscan?
To access Etherscan, simply navigate to etherscan.io in your web browser.
Q2. Is Etherscan a free service?
Yes, Etherscan provides its core functionalities for free. However, there are additional features and premium services available for advanced users and businesses who require more in-depth analysis, API, data and support.
Q3. Can I use Etherscan to explore transactions on other blockchains?
No, Etherscan is specifically designed for the Ethereum blockchain. If you are looking to explore transactions on other blockchains, there are alternative blockchain explorers available for those networks.
Q4. Can I trust the information provided by Etherscan?
Etherscan is widely regarded as a reliable and trustworthy platform within the Ethereum community. However, it's important to exercise caution and verify information from multiple sources when dealing with critical transactions or contracts.
Q5. Can I use Etherscan to track my token investments?
Yes, Etherscan provides a token tracker feature that allows users to monitor their token holdings. By inputting the token contract address or wallet address, users can view their token balances, transaction history, and other relevant information.
Q6. Can I use Etherscan for smart contract verification?
Absolutely! Etherscan offers a feature that allows users to verify smart contracts. By uploading the contract's source code, users can ensure that the deployed contract matches the intended code and hasn't been tampered with.
Q7. Is Etherscan a wallet?
No, Etherscan is not a wallet. It is a blockchain explorer that provides information about Ethereum transactions and smart contracts.
Q8. Do users need an account to use Etherscan?
No, users do not need an account to use Etherscan. The platform is accessible to anyone and allows users to explore and analyze Ethereum transactions and smart contracts without the need for an account or login credentials.
In conclusion, Etherscan is an indispensable tool for anyone looking to explore, analyze, and understand the Ethereum blockchain. With its user-friendly interface, extensive features, and wealth of information, Etherscan empowers users to navigate the Ethereum ecosystem with ease and confidence.
Whether you're a casual user, a developer, an investor, or a researcher, Etherscan provides the necessary tools to verify transactions, monitor addresses, explore smart contracts, and gain valuable insights into the token economy.
So, if you're looking for a tool that can provide you with deep insights into the Ethereum blockchain, Etherscan is the go-to platform. Its user-friendly interface, powerful features, and comprehensive data make it an invaluable resource for both individuals and businesses in the cryptocurrency space.
The information provided on this website does not constitute investment advice, financial advice, trading advice, or any other sort of advice and you should not treat any of the website's content as such.
Token Metrics does not recommend that any cryptocurrency should be bought, sold, or held by you. Do conduct your own due diligence and consult your financial advisor before making any investment decisions.

In the world of cryptocurrencies, stablecoins have gained significant popularity due to their ability to provide stability and reduce volatility. Among the various stablecoins available, Tether (USDT) and USD Coin (USDC) have emerged as two prominent contenders.
Both USDT and USDC are pegged to the US dollar, aiming to maintain a 1:1 ratio with the fiat currency. However, they differ in terms of their underlying technology, transparency, and issuer.
In this article, we will conduct an in-depth comparison between Tether and USD Coin to help you make an informed decision.
Stablecoins are cryptocurrencies that are pegged to a stable asset, such as the US dollar. This provides stability and reduces volatility, making them a popular option for investors who want to avoid the fluctuations associated with traditional cryptocurrencies like Bitcoin and Ethereum.
There are two main types of stablecoins: fiat-backed and crypto-backed. Fiat-backed stablecoins, like USDT and USDC, are backed by fiat currencies such as the US dollar. Crypto-backed stablecoins, on the other hand, are backed by other cryptocurrencies.
USDT, or Tether, is a fiat-backed stablecoin that is pegged to the US dollar. It was created in 2014 and is managed by Tether Limited. USDT is the most widely used stablecoin in the cryptocurrency market, with a market capitalization of over $60 billion.
USDC, or USD Coin, is also a fiat-backed stablecoin that is pegged to the US dollar. It was created in 2018 by Circle and Coinbase and is managed by the Centre Consortium. USDC has a market capitalization of over $27 billion.
Both USDT and USDC are ERC-20 tokens, which means they are built on the Ethereum blockchain.
While USDT and USDC are similar in many ways, there are some key differences to consider.
Both USDT and USDC are built on different blockchain networks, which play a crucial role in their functionality and operations.
USDT: Riding on the Waves of Omni Layer and Ethereum
Tether (USDT) was initially launched on the Omni Layer protocol, which operates on the Bitcoin blockchain. However, to enhance efficiency and scalability, Tether later expanded its offerings to the Ethereum blockchain using the ERC-20 standard. This move allowed for faster transactions and wider compatibility with various cryptocurrency exchanges.
USDC: The Ethereum-Based Stablecoin
USD Coin (USDC), on the other hand, is primarily based on the Ethereum blockchain. As an ERC-20 token, it benefits from the robustness and extensive developer support of the Ethereum ecosystem. The Ethereum network provides a reliable infrastructure for USDC transactions and ensures secure and transparent operations.
The entities responsible for issuing and maintaining USDT and USDC play a crucial role in establishing trust and credibility within the cryptocurrency community.
USDT: The Controversies and Transparency Concerns
Tether Limited, a Hong Kong-based company, is the issuer of Tether (USDT). Over the years, Tether has faced scrutiny and controversies surrounding its transparency and reserves. Questions have been raised about the company's ability to fully back each USDT token with an equivalent amount of USD reserves. While Tether has taken steps to address these concerns and provide periodic audits, some investors remain cautious.
USDC: Regulated and Transparent Approach
USD Coin (USDC) is a product of Centre Consortium, a collaborative effort between Circle and Coinbase. The consortium takes a regulated and transparent approach, providing regular attestations of its USDC reserves. These attestations are conducted by independent auditors to ensure that each USDC token is backed by a corresponding amount of USD held in reserve accounts.
The supply and market capitalization of stablecoins can significantly impact their liquidity and stability.
USDT: Leading the Stablecoin Market
Tether (USDT) has been the dominant stablecoin in the market for several years. With a substantial supply of tokens in circulation, USDT has established itself as a go-to stablecoin for many cryptocurrency traders and exchanges. The market capitalization of USDT has consistently been the highest among stablecoins.
USDC: Rapid Growth and Increasing Adoption
While USD Coin (USDC) entered the market later than USDT, it has experienced rapid growth and increasing adoption. The market capitalization of USDC has been steadily rising, reflecting the growing confidence and demand for this stablecoin. The increasing support from major cryptocurrency exchanges has contributed to the expansion of its user base.
The regulatory landscape surrounding stablecoins is evolving, and adherence to regulatory guidelines is crucial for their long-term viability.
USDT: Regulatory Scrutiny
Tether (USDT) has faced regulatory scrutiny in the past due to concerns over its transparency, reserve backing, and potential implications for the broader cryptocurrency market. As stablecoins gain more attention from regulators worldwide, Tether's compliance measures and engagement with regulatory authorities will play a significant role in its future.
USDC: Embracing Regulatory Compliance
USD Coin (USDC) has taken a proactive approach to regulatory compliance. It has obtained licenses from various regulatory bodies, including the U.S. Financial Crimes Enforcement Network (FinCEN). By adhering to these regulations, USDC aims to provide a stablecoin that meets the compliance requirements of traditional financial systems.
Stablecoins offer various use cases, ranging from facilitating transactions to providing stability within decentralized finance (DeFi) applications.
USDT: Widely adopted in trading and Investments
Due to its long-standing presence and high liquidity, Tether (USDT) is widely adopted in cryptocurrency trading and investments. It serves as a bridge between traditional fiat currencies and the crypto market, enabling seamless transfers and minimizing exposure to volatile assets during trading.
USDC: Fostering DeFi Applications
USD Coin (USDC) has gained significant traction within the decentralized finance (DeFi) ecosystem. Many DeFi protocols, such as lending platforms and decentralized exchanges, have integrated USDC as a stable asset for users to access the benefits of DeFi while minimizing exposure to market volatility.
The future of USDT and USDC is uncertain, but both stablecoins are likely to continue to play an important role in the cryptocurrency market. As more people become interested in cryptocurrency, the demand for stablecoins is likely to increase.
There are also a number of new stablecoins being developed, such as Diem (formerly known as Libra), which is backed by Facebook. These new stablecoins could potentially challenge the dominance of USDT and USDC in the future.
Also Read - Future of Crypto in the Next 5 Years
While stablecoins like USDT and USDC are less volatile than traditional cryptocurrencies, they are not risk-free. One of the biggest risks is the potential for the stablecoin to lose its peg to the US dollar. This could happen if the company behind the stablecoin does not have enough reserves to back up the tokens in circulation.
There is also the risk of fraud or hacking. While USDT and USDC are considered to be relatively secure, there have been instances in the past where stablecoins have been hacked or stolen.
Ultimately, the choice between USDT and USDC will depend on your individual needs and preferences. If you value transparency and security, USDC may be the better option for you. However, if you are looking for a stablecoin that is widely accepted in the cryptocurrency market, USDT may be the way to go.
It is also worth considering the fees associated with each stablecoin. USDT is often cheaper to use than USDC, which could be a deciding factor for some investors.
USDT and USDC can be bought and sold on a wide range of cryptocurrency exchanges. Some of the most popular exchanges include Binance, Coinbase, and Kraken.
Before buying either stablecoin, it is important to do your research and choose a reputable exchange. Look for an exchange that is widely used, regulated and has a good reputation in the cryptocurrency community.
Stablecoins like USDT and USDC have become an increasingly popular option for investors looking to mitigate volatility in the cryptocurrency market. Both stablecoins have their advantages and disadvantages, and the choice between them will ultimately depend on your individual needs and preferences. However, USDT has faced controversies and transparency concerns, while USDC takes a more transparent and regulated approach.
It is important to stay updated on the latest developments and regulatory changes surrounding stablecoins, as the cryptocurrency landscape continues to evolve. As with any investment, it is important to do your research and weigh the risks and rewards before investing in USDT, USDC or any other cryptocurrency.
If you're interested in learning more about cryptocurrency and how to invest in it, be sure to check out our other articles and resources.
The information provided on this website does not constitute investment advice, financial advice, trading advice, or any other sort of advice and you should not treat any of the website's content as such.
Token Metrics does not recommend that any cryptocurrency should be bought, sold, or held by you. Do conduct your own due diligence and consult your financial advisor before making any investment decisions.

Cryptocurrencies have revolutionized the financial industry, allowing individuals to make transactions without intermediaries such as banks or financial institutions.
However, traditional centralized exchanges, where cryptocurrencies are traded, have been criticized for their lack of transparency, security vulnerabilities, and susceptibility to hacking.
Decentralized exchanges, on the other hand, provide a more secure and transparent way of trading cryptocurrencies. If you are a cryptocurrency enthusiast, you may have heard about DEX. But what is a DEX, and how does it work?
In this article, we will explore the concept of decentralized exchanges, their benefits and drawbacks, and how they differ from centralized exchanges.
A decentralized exchange, or DEX, is a platform that allows users to trade cryptocurrencies without intermediaries or a centralized authority. DEXs are built on blockchain technology and use smart contracts to execute trades automatically.
Unlike centralized exchanges, where users have to deposit their funds into a third-party wallet, DEXs allow users to trade directly from their wallets, providing more control over their funds.
DEX (Decentralized exchanges) use a peer-to-peer network of computers to connect buyers and sellers, allowing them to trade cryptocurrencies directly without intermediaries.
DEXs operate using a decentralized order book, where users can submit buy and sell orders. When a buyer and seller agree on a price, a smart contract is executed automatically, transferring the funds from the buyer's wallet to the seller's wallet.
To get started with a decentralized exchange (DEX), you need to follow few steps:
Note: Before utilizing a DEX, traders need to obtain a software crypto wallet that is compatible with the specific exchange. For instance, if someone intends to use an Ethereum based DEX, they should have an Ethereum-compatible wallet such as MetaMask.
DEX fees are generally higher than those charged by centralized exchanges because there is no central authority to process transactions. Instead, transactions on a DEX are processed through a network of users who are incentivized to keep the network running.
This incentive comes in the form of transaction fees paid by users who want their transactions to be processed quickly. The more people who are using the network, the higher the fees will be.
Additionally, some DEXs charge a fee for listing new tokens on their platform, which can be a way for the exchange to generate revenue. To avoid overpaying on fees, it's important to do your research and compare fees across different DEXs.
With a little bit of knowledge and careful consideration, you can make the most of your DEX trading experience while minimizing fees.
There are several DEXs available in the market, each with its unique features and benefits.
Uniswap - Uniswap is among the most popular DEXs, which is based on the Ethereum blockchain and allows users to trade Ethereum-based tokens.
PancakeSwap - Another popular DEX is PancakeSwap, which is based on the Binance Smart Chain and offers lower fees compared to other DEXs.
SushiSwap - SushiSwap is also a well-known DEX that offers yield farming, allowing users to earn additional tokens by providing liquidity to the platform.
1inch - Another popular DEX is 1inch, which aggregates liquidity from multiple DEXs, providing users with the best possible price for their trades.

With a range of options available, it's important to do your research and compare different DEXs to find the one that best suits your trading needs.
Decentralized exchanges provide several benefits over centralized exchanges, including:
Security - One of the main benefits of DEXs is their security. Unlike centralized exchanges, where users' funds are held in a third-party wallet, DEXs allow users to maintain control over their funds at all times. DEXs use smart contracts to execute trades automatically, eliminating the risk of a hack or a security breach.
Transparency - Another benefit of DEXs is their transparency. All trades on a DEX are recorded on the blockchain, which is a public ledger. This means that anyone can view the trades and verify that they have been executed correctly.
No KYC Requirements - Many centralized exchanges require users to complete a KYC (Know Your Customer) process to verify their identity. DEXs, on the other hand, do not require any KYC information, providing users with more privacy and anonymity.
Access to More Coins - Unlike centralized exchanges, which often have a limited selection of coins available for trading, DEXs provide access to a broader range of cryptocurrencies.
While decentralized exchanges offer several benefits, they also have some drawbacks, including:
Lack of Liquidity - One of the main drawbacks of DEXs is their lack of liquidity. Because DEXs operate on a peer-to-peer network, the number of buyers and sellers can be limited, making it challenging to execute trades quickly.
Complexity - DEXs can be more complex to use than centralized exchanges, requiring users to have a certain level of technical knowledge and experience with blockchain technology.
Slower Transaction Times - Because DEXs use a peer-to-peer network to execute trades, transactions can be slower than on centralized exchanges, where trades are executed almost instantly.
Q1. What is the difference between a centralized exchange and a decentralized exchange (DEX)?
Centralized exchanges are traditional exchanges where users deposit their funds into a third-party wallet, and trades are executed by a central authority. In contrast, DEXs allow users to trade directly from their wallets and use smart contracts to execute trades automatically, eliminating the need for a third-party intermediary.
Q2. Are decentralized exchanges safe?
Decentralized exchanges are generally considered to be safer than centralized exchanges, as they use smart contracts to execute trades automatically, eliminating the need for a third-party intermediary and reducing the risk of a security breach.
Q3. What are the benefits of using a decentralized exchange?
Decentralized exchanges provide several benefits, including increased security, transparency, and access to a broader range of cryptocurrencies.
Q4. Are decentralized exchanges more difficult to use than centralized exchanges?
Decentralized exchanges can be more complex to use than centralized exchanges, requiring users to have a certain level of technical knowledge and experience with blockchain technology.
Q5. What is the main drawback of using a decentralized exchange?
The main drawback of using a decentralized exchange is the lack of liquidity, which can make it challenging to execute trades quickly.
Q6. How can I start using a decentralized exchange?
To start using a decentralized exchange, you will need to have a cryptocurrency wallet that supports the DEX you want to use. You can then connect your wallet to the DEX and start trading cryptocurrencies.
Decentralized exchanges (DEXs) are regarded as a noteworthy breakthrough in the cryptocurrency arena, although they do not possess the same level of user-friendliness as centralized exchanges (CEXs).
DEXs' efforts towards decentralization and anonymity align with the fundamental values of cryptocurrency, making them particularly appealing to individuals who prioritize these tenets. With the anticipated influx of investors in the cryptocurrency market, it is foreseeable that DEXs will emerge as a more influential player in the financial landscape.
So, if you're looking for a more secure and transparent way to trade cryptocurrencies, consider giving decentralized exchange a try.
The information provided on this website does not constitute investment advice, financial advice, trading advice, or any other sort of advice and you should not treat any of the website's content as such.
Token Metrics does not recommend that any cryptocurrency should be bought, sold, or held by you. Do conduct your own due diligence and consult your financial advisor before making any investment decisions.

When it comes to investing, bullish and bearish are two terms that investors often come across. These two terms are used to describe the market outlook or individual asset, and understanding their fundamental differences is crucial for making informed investment decisions.
In this article, we will delve deeper into the meanings and differences between Bullish and Bearish trends. So, buckle up and keep reading to learn more about the fundamental differences between the two.
The bullish trend is a term used in financial markets to describe a positive or optimistic outlook on the market or a particular asset like stocks or crypto. In a bullish trend, the market or asset is experiencing a steady increase in value, with buyers outnumbering sellers.
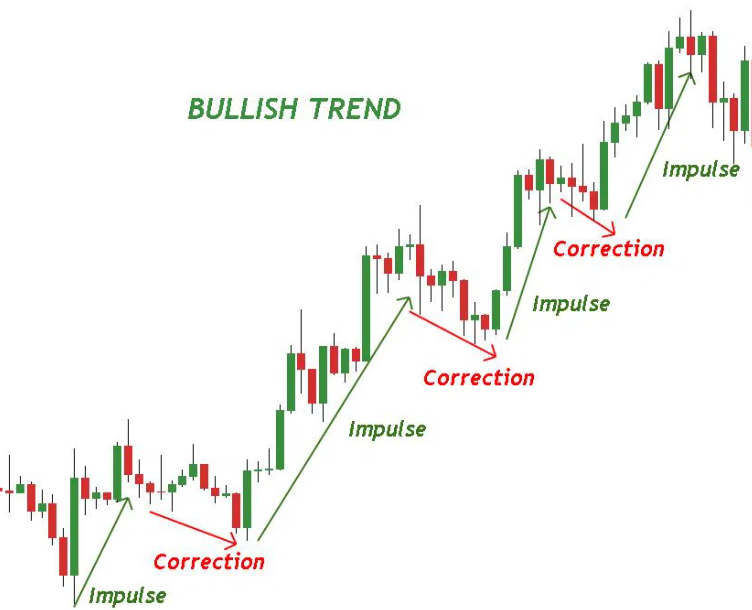
This often results in higher stock or crypto prices, increased trading volumes, and positive sentiment among investors. The bullish trend can be influenced by a variety of factors, including strong earnings growth, a positive economic outlook, and favorable government policies.
The bearish trend is a term commonly used in financial markets to describe a negative or pessimistic outlook on the market or a particular asset. Unlike the bullish trend, which is characterized by an increase in value, the bearish trend is marked by a decrease in value, lower stock/crypto prices, and negative sentiment among investors.

This bearish trend can be influenced by a variety of factors, including economic downturns, declining earnings, and unfavorable policies and regulations.
Now that we have understood the basic definitions let's look at the fundamental differences between the two.
1. Market Sentiment - The primary difference between Bullish and Bearish trends is the market sentiment. Bullish trends indicate positive sentiments, whereas Bearish trends indicate negative sentiments. The market sentiment is often driven by various factors such as economic conditions, political events, and company performance.
2. Price Movement - Another significant difference between Bullish and Bearish trends is the direction of price movement. In a Bullish trend, the prices of assets rise steadily, while in a Bearish trend, prices fall.
3. Trading Volume - The trading volume is an important indicator of market trends. A higher trading volume is often associated with Bullish trends, indicating increased investor participation and positive sentiment. On the other hand, a lower trading volume is often associated with Bearish trends, indicating decreased investor participation and negative sentiment.
4. Investor Behavior - Investor behavior is also an important factor that distinguishes Bullish and Bearish trends. In a Bullish trend, investors are more likely to buy digital assets, hoping to sell them at a higher price in the future. In contrast, in a Bearish trend, investors are more likely to sell digital assets, fearing a further decline in prices.
5. Timeframe - The duration of Bullish and Bearish trends can vary significantly. Bullish trends can last for months or even years, while Bearish trends can also last for extended periods.
6. Implications - Bullish and Bearish trends have significant implications for investors. A Bullish trend indicates a positivity for the market, leading to increased investments and higher asset prices. On the other hand, a Bearish trend indicates a negative approach, leading to decreased investments and lower asset prices.
Analyzing bullish and bearish patterns is a key component of successful investing. To identify these patterns, investors use technical analysis, which involves examining charts and data to determine market trends.
Bullish patterns may include higher highs and higher lows, while bearish patterns may include lower highs and lower lows. Other indicators that investors may look for include support and resistance levels, moving averages, and volume.
It's important to note that these patterns are not foolproof and should be used in conjunction with fundamental analysis, which involves examining a company's financial health and other factors that may impact its future growth prospects.
Over time, the market has witnessed numerous bullish and bearish trends, with some being particularly noteworthy. Let's take a look at some real-life examples of such trends in the market.
Example of Bullish Trend - In late 2017, the price of Bitcoin experienced an unprecedented surge, rising from around $1,000 at the beginning of the year to nearly $20,000 by December. This was fueled by increased interest and adoption of cryptocurrencies, particularly by institutional investors. The bullish trend continued into early 2018, with the total market capitalization of all cryptocurrencies reaching an all-time high.
Example of Bearish Trend - One classic example of a bearish trend in Ethereum was the period from January 2018 to December 2018. During this time, the price of Ethereum experienced a significant correction, dropping from an all-time high of around $1,400 in January 2018 to around $85 by December 2018.
This bearish trend was fueled by several factors, including the general market downturn, concerns over scalability and network congestion, and increased competition from other blockchain projects. However, since then, Ethereum has seen a recovery and has undergone significant upgrades, such as the transition to Ethereum 2.0, which has increased interest and adoption of the platform.
1. How can I identify a Bullish or Bearish trend?
You can identify a Bullish or Bearish trend by analyzing the price movements and trading volumes of the asset over a specific period. If the prices are rising, and the trading volumes are high, it indicates a Bullish trend. Conversely, if the prices are falling, and the trading volumes are low, it indicates a Bearish trend.
2. How can I profit from a Bullish or Bearish trend?
You can profit from a Bullish or Bearish trend by buying or selling assets at the right time. In a Bullish trend, you can buy stocks at a lower price and sell them at a higher price when the trend ends. In a Bearish trend, you can sell stocks at a higher price and buy them back at a lower price when the trend ends.
3. Is it possible to have a Bullish and Bearish trend at the same time?
Yes, it is possible to have a Bullish and Bearish trend in different sectors of the market simultaneously. For instance, the technology sector can have a Bullish trend while the energy sector has a Bearish trend.
4. How do market trends impact my investments?
Market trends have a significant impact on your investments. If you invest during a Bullish trend, you are more likely to see positive returns. In contrast, if you invest during a Bearish trend, you may incur losses.
5. How can I prepare for market trends?
You can prepare for market trends by staying updated with economic and political news that impact the market. Additionally, you can diversify your portfolio to minimize risks and invest in long-term assets.
6. Can Bullish and Bearish trends change quickly?
Yes, market trends can change quickly, and it's crucial to stay updated with the latest news and trends. It's advisable to set stop-loss orders to minimize losses during sudden market changes.
In conclusion, understanding the fundamental differences between bullish and bearish sentiment can be helpful in making informed investment decisions. By considering economic indicators, company-specific news, and your own investment goals and risk tolerance, you can determine whether you're bullish or bearish on a particular asset or the overall market.
Remember that while these views can be useful, they are not infallible, and it's important to remain vigilant and adaptable in a constantly evolving market. Investing involves risks, and it's essential to consult a financial advisor before making any investment decisions.
The information provided on this website does not constitute investment advice, financial advice, trading advice, or any other sort of advice and you should not treat any of the website's content as such.
Token Metrics does not recommend that any cryptocurrency should be bought, sold, or held by you. Do conduct your own due diligence and consult your financial advisor before making any investment decisions.

Dogecoin, the cryptocurrency that started as a joke, has taken the world by storm in recent years. It has become a popular digital currency, with a market capitalization of over $30 billion.
However, in recent months, there have been concerns about its future. The question on everyone's mind is, "Is Dogecoin dead?" In this article, we will take an in-depth look at the current state of Dogecoin and explore its future prospects.
Dogecoin is a cryptocurrency that was created in 2013 by software engineers Billy Markus and Jackson Palmer. It was intended to be a fun, lighthearted version of Bitcoin.
The name "Dogecoin" comes from the "Doge" meme, which features a Shiba Inu dog. Initially, Dogecoin was meant to be a joke, but it quickly gained popularity and became a legitimate cryptocurrency.
Dogecoin gained a massive following on social media platforms like Reddit and Twitter, where users shared memes and created a community around the digital currency.
In 2021, Dogecoin gained mainstream attention after Tesla CEO Elon Musk tweeted about it several times. These tweets caused the price of Dogecoin to soar, and it reached an all-time high range of $0.64 in May 2021.

After reaching its all-time high, the price of Dogecoin began to decline. As of May 2023, Dogecoin is trading at around $0.079. The decline in price has led many to question the future of Dogecoin. Is it a dying meme, or does it still have potential? Let's take a closer look.
Several factors have contributed to the decline of Dogecoin. A few of them are:
The question on everyone's mind is, "Is Dogecoin dead?" The answer is complicated. It's impossible to say with certainty whether Dogecoin is truly deceased. Despite being the most recognizable of the meme coins and a way to transfer money to others, only a few merchants accept Dogecoin for transactions. However, the meme coin could still be feasible, even if it doesn't reach the same price point.
One challenge with Dogecoin is how much of it is owned by a few people. Allegedly, a single wallet holds 28% of all dogecoin, and a group of nine wallets accounts for over 40% of the total supply. This raises the risk of market manipulation in the cryptocurrency sector.
It's also important to remember that Dogecoin has a large and dedicated community. This community has helped to keep Dogecoin relevant, and they continue to use and promote the cryptocurrency.
Nevertheless, if enough people decide to buy the dip, or if owning Dogecoin continues to be attractive, it could remain a fixture in the cryptocurrency world. Moreover, ownership can be diluted through mining, which provides a reward. If more people choose to mine Dogecoin, then ownership will be more evenly spread out.
Let's take a closer look at some of the controversies that have surrounded Dogecoin.
Association with Pump-and-Dump Schemes - Dogecoin has been associated with several pump-and-dump schemes, where groups of investors artificially inflate the price of a cryptocurrency before selling off their holdings and causing the price to crash. Dogecoin has been targeted by several such schemes, leading to significant losses for many investors.
Toxic Behavior within the Community - The community surrounding Dogecoin has also been criticized for promoting toxic behavior and trolling. While the community is known for its light-hearted and humorous approach, some members have engaged in harassing and intimidating behavior towards other users and even mainstream figures.
Association with Elon Musk - Another controversy surrounding Dogecoin is its association with Elon Musk. While the Tesla CEO has publicly expressed support for Dogecoin, his tweets and comments about the cryptocurrency have led to significant fluctuations in its value, causing some to question whether his influence is healthy for the crypto market.
Lack of Real-World Utility - Another controversy surrounding Dogecoin is its lack of real-world utility. While Dogecoin was created as a joke, it has gained a significant following and market cap, which has led some to question its overall value. Critics argue that Dogecoin is simply a speculative asset with little practical use beyond trading and investing.
Criticisms from the Founder - Lastly, Dogecoin's founder, Jackson Palmer, has been critical of the cryptocurrency in recent years, calling it a "vehicle for hype and speculation" and questioning its overall value. He shared his opinion about crypto on Twitter-
I am often asked if I will “return to cryptocurrency” or begin regularly sharing my thoughts on the topic again. My answer is a wholehearted “no”, but to avoid repeating myself I figure it might be worthwhile briefly explaining why here…
— Jackson Palmer (@ummjackson) July 14, 2021
While Dogecoin's future may be uncertain, it is safe to say that it has gained a significant following and has proven its potential as an investment opportunity. Its success can be attributed to both its meme culture and accessibility to small-scale investors.
But there are few factors that may influence its future include increased regulation, adoption as a means of payment, and community-driven support. Investors must approach it with caution, but for those who believe in its potential, Dogecoin may offer a promising opportunity.
Also Read - Can Dogecoin Reach $1?
Will Dogecoin go up and reach $1
While some enthusiasts remain hopeful that Dogecoin will experience a surge in value and possibly even reach the $1 mark, there are others who are more skeptical.
Neil Patel, a prominent investor and bestselling author, has expressed doubts that such a milestone is achievable due to the hype surrounding Dogecoin, which is largely driven by social media. While examining Dogecoin's price history, it seems unlikely that it will reach $1 anytime soon. Nevertheless, it cannot be entirely dismissed as a possibility, especially if there is renewed interest and demand in the cryptocurrency.
Why has the price of Dogecoin declined?
There are several factors contributing to the decline in price, including increasing competition from other cryptocurrencies, crypto regulation uncertainty and the lack of development on the Dogecoin network.
What can be done to improve the future prospects of Dogecoin?
Dogecoin developers will need to work on improving the network's technology and expanding its use cases. Additionally, Dogecoin will need to differentiate itself from other cryptocurrencies and offer something unique and valuable to investors.
What is the future of cryptocurrencies?
The future of cryptocurrencies is still uncertain. While they have gained mainstream acceptance, there are still concerns about their stability and regulation. However, many believe that cryptocurrencies will continue to play an important role in the future of finance.
In conclusion, the question of whether Dogecoin is dead is a complicated one. While its decline in price and lack of development are concerning, Dogecoin still has a dedicated community and the potential to make improvements and regain popularity. The future of Dogecoin will depend on the efforts of its developers and its ability to differentiate itself from other coins.
If you are considering investing in Dogecoin or any other cryptocurrency, it's important to do your research and consider the potential risks and rewards. Cryptocurrencies can be volatile, and it's important to be aware of the potential for price fluctuations.
The information provided on this website does not constitute investment advice, financial advice, trading advice, or any other sort of advice and you should not treat any of the website's content as such.
Token Metrics does not recommend that any cryptocurrency should be bought, sold, or held by you. Do conduct your own due diligence and consult your financial advisor before making any investment decisions.

In the world of trading and investing, bull traps can be a significant threat to your portfolio. A bull trap is a deceptive market signal that tricks you into thinking that a particular asset or market is going up, when in reality, it is about to fall. This can result in significant losses if you're not careful.
Identifying bull trap patterns can be tricky, but with the right knowledge, you can protect your investments and avoid costly mistakes.
In this comprehensive guide, we'll take a closer look at the bull trap, how it works, how to identify it with examples and most importantly, how you can avoid falling into it.
This term bull trap refers to a deceptive market scenario in which an asset appears to be experiencing a significant upward trend, leading traders to believe that it is a good time to buy. However, the reality is that this uptrend is a false signal, and the price is about to take a sharp dive.
Typically, a bull trap happens when a stock or market shows signs of an upward trend, such as rising prices or trading volume. However, instead of continuing to rise, the stock or market suddenly drops, catching traders and investors off-guard.
Psychologically, bull traps can occur when bulls fail to support a rally above the breakout level due to a lack of momentum and/or profit-taking. As a result, bears may take advantage of this and sell the security, causing prices to drop below the resistance level. This can trigger stop-loss orders, which are designed to limit losses when the security price falls below a predetermined level.
Bull traps work by exploiting the natural human tendency to follow trends. When a stock or market shows signs of an upward or bullish trend, traders and investors often assume that the trend will continue.
This assumption can lead them to buy into the stock or market, driving prices up even further. However, at a certain point, the trend may start to weaken, and those who bought into the stock or market may start to sell, causing prices to drop.
Bull traps can be difficult to spot, but there are some signs to look out for. Here are some of the most common signs of a bull trap:
Sudden price increases: If a particular asset or market suddenly jumps in price without any strong reason, it may be a sign of a bull trap.
High trading volume: If an asset experiences a sudden surge in trading volume, it may be a sign of a bull trap.
Overbought indicators: If technical indicators show that a particular asset is overbought, it may be a sign of a bull trap.
False breakouts: If a stock or digital asset breaks out of a trading range but quickly falls back into it, it may be a sign of a bull trap.
The example of a bull trap can be observed in the chart depicted below.

An example of a bull trap in the world of cryptocurrency can be seen in the case of Bitcoin's price fluctuations in early 2021. After reaching an all-time high of nearly $65,000 in April 2021, Bitcoin experienced a significant price correction, dropping to around $30,000 by the end of May.
However, in early June, the price of Bitcoin suddenly spiked, reaching a value of nearly $42,000. Many traders saw this uptick as a signal that the bearish trend was over, and it was a good time to invest. Unfortunately, this surge was short-lived, and the price soon plummeted again, eventually dropping to below $30,000 once more.
Another example of a bull trap occurred in the early 2000s during the dot-com bubble. During this time, many technology stocks experienced massive price increases, with some stocks increasing by over 1000%. However, in 2001, the bubble burst, and many of these companies went bankrupt, wiping out billions of dollars in wealth.
These scenarios are a classic example of a bull trap, as the market lured traders into believing that the uptrend would continue, only to sharply reverse direction and leave many traders with significant losses.
Avoiding a bull trap requires a combination of knowledge, discipline, and patience. Here are some tips to help you avoid falling into a bull trap:
Do your research: Before investing in a stock or market, make sure you thoroughly research it. Look at its financials, read news articles, and consider any technical indicators that may be relevant. This will help you make a more informed decision and avoid falling for a bull trap.
Use stop-loss orders: A stop-loss order is an order to sell a stock or market if it falls below a certain price. By using a stop-loss order, you can limit your losses in case the stock or market experiences a sudden drop.
Be patient: One of the biggest mistakes traders and investors make is buying into a stock or market too early. Instead, be patient and wait for the right entry point. This will help you avoid buying into a bull trap.
Follow your trading plan: It's essential to have a trading plan that outlines your entry and exit points. By following your plan, you can avoid making impulsive decisions that may lead you into a bull trap.
Stay informed: Finally, make sure you stay informed about the stock or market you're investing in. This includes keeping up with news and market trends, as well as paying attention to any technical indicators that may be relevant.
If you find yourself caught in a bull trap, there are several strategies you can use to minimize your losses:
Cut your losses: One of the most important things you can do is cut your losses early. Don't hold onto a stock or market hoping that it will recover. Instead, take a small loss and move on to the next opportunity.
Hedge your position: Another strategy is to hedge your position. This means taking a position in a stock or market that is negatively correlated to your current position. For example, if you're long on a stock, you may want to short a stock in a similar industry to hedge your position.
Take profits: If you've already made a significant profit, it may be a good idea to take some profits off the table. This will help you lock in your gains and minimize your losses if the stock or market experiences a sudden drop.
Let's delve into the difference between a bull trap and a bear trap. While both scenarios involve a false signal in the market, they refer to opposite situations.
A bull trap occurs when the market appears to be experiencing an uptrend, leading traders to believe that it is a good time to buy, but the price then sharply drops.
Conversely, a bear trap occurs when the market appears to be experiencing a downtrend, leading traders to believe that it is a good time to sell, but the price then suddenly increases.
Both traps are intended to deceive inexperienced traders and lure them into making poor investment decisions. It's crucial to keep a keen eye on market trends and indicators to avoid falling into either trap.
In conclusion, a bull trap can be a costly mistake for inexperienced traders and investors. It's important to thoroughly analyze the market trends and indicators to avoid falling prey to these traps.
Remember, the market can be unpredictable, and what appears to be a promising opportunity may turn out to be a trap. By staying vigilant and keeping an eye out for false signals, traders and investors can avoid making hasty investment decisions that could lead to significant losses.
With the knowledge gained from this comprehensive guide, traders and investors can navigate the market with greater confidence and avoid the pitfalls of bull traps. So, keep learning, stay informed, and happy trading!
The information provided on this website does not constitute investment advice, financial advice, trading advice, or any other sort of advice and you should not treat any of the website's content as such.
Token Metrics does not recommend that any cryptocurrency should be bought, sold, or held by you. Do conduct your own due diligence and consult your financial advisor before making any investment decisions.

Are you ready to unlock the secrets of Bitcoin's price movements? Look no further than the Bitcoin Rainbow Chart! This colorful chart is a powerful tool for traders and investors looking to better understand the market.
In this article, we're going to cover the ins and outs of the bitcoin rainbow chart. Let's start by understanding what it is, how it works and how you can use it to make more informed investment decisions.
The Bitcoin Rainbow Chart is a technical analysis tool that visualizes Bitcoin's historical price movements. It's called a "rainbow" chart because it uses different colors to represent different price ranges. The chart consists of seven colored bands, each representing a different percentage increase in Bitcoin's price.
The seven bands on the chart are:
Each band has a corresponding range of Bitcoin prices that falls within that band. For example, the Dark Red band represents a price range of $0 to $9.8, while the Purple band represents a price range of $19,762 to infinity.
The Bitcoin Rainbow Chart has an interesting history that dates back to the early days of Bitcoin. The first version of the chart was created by a Reddit user named Azop as a fun way to depict Bitcoin's price history.
However, it wasn't until a trader known as "Trolololo" on the BitcoinTalk forum developed the second version of the chart that it gained widespread recognition as a technical analysis tool. Trolololo paired the rainbow chart with logarithmic regression, creating a more sophisticated version of the chart that has become a valuable tool for traders and investors alike.
Over time, the chart evolved to include seven different colored bands, each representing a different percentage increase in Bitcoin's price. Today, the Bitcoin Rainbow Chart is a widely recognized tool in the cryptocurrency community, used by traders and investors to gain insights into Bitcoin's market movements.
Now that you know what the Bitcoin Rainbow Chart is, let's talk about how to use it. The Rainbow Chart can be used to help traders and investors identify potential buying and selling opportunities. The chart can also be used to help investors gauge the overall health and strength of the Bitcoin market.
Here are some tips on how to use the Rainbow Chart:
Identify the current price band: The first step in using the Rainbow Chart is to identify the current price band that Bitcoin is in. This will help you determine whether Bitcoin is currently overvalued or undervalued.
Look for potential buying opportunities: If Bitcoin is in one of the lower price bands (Dark Red, Red, or Orange), this could be a good opportunity to buy. These lower price bands typically indicate that Bitcoin is undervalued.
Look for potential selling opportunities: If Bitcoin is in one of the higher price bands (Green, Blue, or Purple), this could be a good opportunity to sell. These higher price bands typically indicate that Bitcoin is overvalued.
Consider the trend: The Rainbow Chart can also be used to identify trends in Bitcoin's price movements. If Bitcoin is consistently moving up the chart, this could indicate a bullish trend, while a consistent move down the chart could indicate a bearish trend.
Use other indicators: While the Rainbow Chart can be a helpful tool, it's important to use other indicators and analysis methods in conjunction with it. No single tool or method can provide a complete picture of the market.
It's also important to note that the Rainbow Chart is not a perfect tool. While it can be helpful in identifying potential buying and selling opportunities, it should not be the only tool used to make investment decisions. It's important to do your own research and analysis before making any investment decisions.
The BTC Rainbow Chart is a popular tool in the cryptocurrency world, but the question on many traders' minds is whether it's accurate or not.
While it's true that the chart is based on historical data and doesn't take into account future market conditions, it can still be a valuable tool when used in conjunction with other forms of analysis.
Critics of the Rainbow Chart argue that it's too simplistic and doesn't take into account the nuances of the market. While this may be true to some extent, it's important to remember that the chart is just one tool in a trader's toolbox.
Ultimately, the accuracy of the BTC Rainbow Chart depends on how it's used and in what context. Traders who rely solely on the chart may find themselves in trouble, but those who use it as part of a broader trading strategy may find it to be a valuable tool for gaining insights into Bitcoin's market movements.
Also Read - Is Bitcoin Dead? - Complete Analysis for BTC Investors
Here are the main limitations of the Bitcoin Rainbow Chart:
There are indeed more crypto rainbow charts available, as the concept has been adapted and expanded upon by various individuals and organizations in the crypto space. While the original Bitcoin Rainbow Chart remains one of the most well-known examples, other rainbow charts have emerged for different cryptocurrencies, such as Ethereum.
The Ethereum Rainbow Chart and the Bitcoin Rainbow Chart share similarities in that they both use a similar color-coded system to depict the historical price movements of their respective cryptocurrencies.
However, there are also differences between the two charts. The Ethereum Rainbow Chart has a different set of parameters, as the chart is tailored to the unique characteristics of the Ethereum blockchain and its associated token.
Additionally, the Ethereum Rainbow Chart has a different color scheme than the Bitcoin Rainbow Chart, with shades of green representing bullish sentiment and shades of red representing bearish sentiment.
In conclusion, the BTC Rainbow Chart is a useful tool for traders and investors to better understand Bitcoin's price movements. By using the chart, traders can identify potential buying and selling opportunities.
While its accuracy may be questioned by some, it's important to remember that no single tool can predict the future of the market.
However, it's important to use the chart in conjunction with other analysis methods and to do your own research before making any investment decisions.
The information provided on this website does not constitute investment advice, financial advice, trading advice, or any other sort of advice and you should not treat any of the website's content as such.
Token Metrics does not recommend that any cryptocurrency should be bought, sold, or held by you. Do conduct your own due diligence and consult your financial advisor before making any investment decisions.

Bitcoin (BTC) and Ethereum (ETH) are undeniably the top cryptocurrencies that have played a significant role in the development of the crypto industry.
BTC, being the pioneer of cryptocurrencies, is often referred to as the digital equivalent of gold. On the other hand, ETH can be viewed as a decentralized computing platform that can revolutionize various industries.
In this article, we will take an in-depth look at the differences between Bitcoin and Ethereum. So, let's start with a brief overview of Bitcoin and Ethereum.
Bitcoin(BTC) was the first cryptocurrency, created in 2009 by an anonymous individual or group of individuals using the pseudonym Satoshi Nakamoto. Bitcoin is a decentralized digital currency that operates on a peer-to-peer network, allowing for secure, anonymous transactions without the need for intermediaries.
One of the key features of Bitcoin is its limited supply. There will only ever be 21 million bitcoins in circulation, which helps to ensure that the value of each bitcoin is protected and can increase over time as demand grows. The process of generating new bitcoins is called mining, and it involves solving complex mathematical equations using specialized computer hardware.
Ethereum, on the other hand, is a decentralized computing platform that was introduced in 2015 by Vitalik Buterin. Ethereum's blockchain technology allows developers to create and deploy smart contracts, which are self-executing contracts with the terms of the agreement between buyer and seller being directly written into lines of code.
Ethereum also has its own cryptocurrency, called Ether (ETH), which is used to pay for transactions and computational services on the Ethereum network. Unlike Bitcoin, there is no limit to the number of Ethers that can be created.
Although Bitcoin and Ethereum share the fundamental principles of distributed ledger technology and encryption, they differ greatly in terms of technical specifications. Let's delve into the technical and operational differences that set Bitcoin and Ethereum apart.
1. Transaction Speed and Cost
Bitcoin's transaction speed is slower than Ethereum's due to its block size limit of 1MB, which restricts the number of transactions that can be processed per block. As a result, Bitcoin transactions can take up to 10 minutes to be confirmed, while Ethereum transactions are typically confirmed in under a minute.
The cost of Bitcoin transactions can also be higher than Ethereum's due to its popularity and limited block size, which can lead to network congestion and higher fees. Ethereum's transaction fees are generally lower due to its larger block size and more efficient use of the network.
2. Mining - Proof of Work vs. Proof of Stake
Both Bitcoin and Ethereum use a consensus mechanism to verify transactions and maintain the integrity of the blockchain. However, they use different methods to achieve this.
Bitcoin uses a proof-of-work (PoW) consensus algorithm, which requires miners to solve complex mathematical problems to validate transactions and add new blocks to the blockchain. This process requires significant computational power and energy consumption, making it costly and environmentally unfriendly.
Ethereum is currently in the process of transitioning from a proof-of-work (PoW) consensus algorithm to a proof-of-stake (PoS) algorithm. Proof of stake requires validators to hold a certain amount of cryptocurrency to validate transactions, eliminating the need for energy-intensive mining. This is expected to make Ethereum more environmentally friendly and cost-effective.
3. Smart Contracts and Decentralized Applications
One of Ethereum's main advantages over Bitcoin is its ability to support smart contracts and decentralized applications (dapps). Smart contracts are self-executing contracts with the terms of the agreement between buyer and seller being directly written into lines of code. This allows for secure, automated transactions without the need for intermediaries.
Ethereum's support for smart contracts has led to the development of a wide range of decentralized applications, including decentralized finance (DeFi) platforms, non-fungible token marketplaces, and more.
Bitcoin, on the other hand, does not currently support smart contracts or dapps. While some developers have created solutions to enable smart contracts on the Bitcoin blockchain, these solutions are not as widely adopted as Ethereum's smart contract capabilities.
Let's take a closer look at how Ethereum and Bitcoin stack up against each other. Here is an in-depth comparison of ETH and BTC -
| Ethereum | Bitcoin | |
|---|---|---|
| Creator | Vitaly Dmitrievich Buterin | Satoshi Nakamoto |
| Launch date | July 30, 2015 | 9 January 2009 |
| Supply | Infinite | 21 Million BTC |
| Transactions per Second | 30 per Second | 7 per Second |
| Consensus algorithm | Proof of Work moves to Proof of Stake | Proof of Work |
| Block Time | 15 Seconds on Average | 10 Minutes on Average |
Bitcoin and Ethereum have many similarities. They are both decentralized currencies that operate on blockchain technology.
BTC and ETH can be used as payment or stored as a form of investment, and they have strong developer communities. They are also volatile and vulnerable to market fluctuations, but have attracted significant attention from institutional investors.
Despite some differences, their similarities suggest that both cryptocurrencies have the potential to remain relevant and valuable in the long term. Investors should carefully evaluate their risk tolerance and investment goals before making any investment related decision..
Both Bitcoin and Ethereum have large and dedicated development communities working to improve and evolve their respective technologies. Bitcoin has a more established development community and has been around longer, which has allowed it to gain wider acceptance and adoption.
Ethereum, on the other hand, has a more active development community, thanks in part to its support for smart contracts and dapps. This has led to a wider range of innovations and use cases for Ethereum, making it a more versatile and adaptable platform.
Looking to the future, both Bitcoin and Ethereum have strong prospects. Bitcoin is likely to continue to be the dominant cryptocurrency, thanks to its first-mover advantage and widespread adoption.
Ethereum, meanwhile, is likely to continue to grow and evolve, thanks to its smart contract capabilities and active development community.
Also Read - Is Bitcoin Dead? - Complete Analysis for BTC Investors
When deciding whether to invest in ETH or BTC for the long term, it's important to consider several factors. Both cryptocurrencies have shown potential for growth and acceptance, but they have their differences.
Bitcoin is the more established and mainstream of the two, making it a relatively safer investment option. Ethereum, on the other hand, is newer and slightly riskier, but it offers more diverse use cases beyond just being a digital currency.
Ultimately, the decision comes down to an investor's risk tolerance and investment goals. Those looking for a more stable investment option may prefer Bitcoin, while those seeking potentially higher rewards and a more diverse range of applications may choose Ethereum. It's essential to conduct thorough research and seek expert advice before making any investment decisions.
Bitcoin and Ethereum are two of the most well-known cryptocurrencies in the world, with unique features and advantages. While Bitcoin has gained widespread adoption and is the more established cryptocurrency, Ethereum has been driving innovation through its support for smart contracts and decentralized applications.
It is important for investors and users to understand the differences between Bitcoin and Ethereum to make informed decisions in the cryptocurrency market. Bitcoin's dominant position and reputation for stability make it a safer investment option, while Ethereum's versatility and adaptability make it a platform for new and innovative blockchain projects.
The information provided on this website does not constitute investment advice, financial advice, trading advice, or any other sort of advice and you should not treat any of the website's content as such.
Token Metrics does not recommend that any cryptocurrency should be bought, sold, or held by you. Do conduct your own due diligence and consult your financial advisor before making any investment decisions.

As the world of cryptocurrency continues to evolve, new opportunities for investment and profit are emerging. One such opportunity is crypto arbitrage, a trading strategy that can yield significant returns for savvy investors.
In this article, we'll explain what crypto arbitrage is, how it works, and why it's become an increasingly popular investment strategy in crypto space.
Crypto arbitrage involves taking advantage of price differences for a cryptocurrency on different exchanges. Cryptocurrencies are traded on many different exchanges, and the prices for each currency can vary significantly between these exchanges.
This creates an opportunity for arbitrageurs to buy a currency on one exchange where the price is low and then sell it on another exchange where the price is high. The difference between the buy and sell price is the profit.
There are several types of crypto arbitrage, each with its own unique characteristics and risks. Let's explore some of them.
Exchange Arbitrage - Exchange arbitrage is the most common type of crypto arbitrage. It involves buying a cryptocurrency on one exchange where it is priced lower and selling it on another exchange where the price is higher.
This type of arbitrage is possible because different exchanges have different prices for the same cryptocurrency due to differences in supply and demand, trading volumes, and market manipulation.
Triangular Arbitrage - Triangular arbitrage is a more complex type of crypto arbitrage that involves taking advantage of price differences between three cryptocurrencies on different exchanges.
For example, you could buy Bitcoin on Exchange A, trade it for Ethereum on Exchange B, and then trade the Ethereum for Litecoin on Exchange C, and then sell the Litecoin back for Bitcoin on Exchange A. This type of arbitrage requires a lot of research, expertise, and quick decision-making to execute successfully.
Statistical Arbitrage - Statistical arbitrage involves using mathematical models and statistical analysis to identify mispricing's in the market. This type of arbitrage is often used in the stock market but can also be applied to cryptocurrencies. Statistical arbitrage requires extensive data analysis and algorithmic trading strategies to take advantage of the market inefficiencies.
Inter-Exchange Arbitrage - Inter-exchange arbitrage involves taking advantage of price differences between different exchanges by buying and selling cryptocurrencies simultaneously.
This type of arbitrage requires access to multiple exchanges, high-speed internet, and advanced trading tools to execute quickly and effectively.
Cross-Currency Arbitrage - Cross-currency arbitrage involves buying and selling different cryptocurrencies denominated in different currencies.
For example, you could buy Bitcoin in USD on one exchange and sell it for Bitcoin in EUR on another exchange. This type of arbitrage requires a deep understanding of the currency markets and exchange rates.
The concept of arbitrage trading is based on the idea that the price of an asset can vary in different markets due to various factors such as supply and demand, transaction costs, and currency exchange rates.
The goal of arbitrage trading is to purchase an asset in one market at a lower price and sell it in another market at a higher price, making a profit from the price difference.
To execute an arbitrage trade, traders need to be quick and efficient in analyzing the markets and executing trades. In recent years, technology has played a significant role in enabling traders to execute arbitrage trades in real-time by using automated trading systems that can quickly identify price discrepancies and execute trades.
Overall, arbitrage trading is a sophisticated trading strategy that requires expertise in analyzing markets and executing trades efficiently.
Arbitrage trading can be a lucrative trading strategy for those with the skills and knowledge to execute it successfully. Here are some important things to know before starting the arbitrage trading -
Understand the concept: Before starting arbitrage trading, it is essential to understand the basic concept of the strategy. This includes understanding the factors that can lead to price differences between markets and the techniques used to exploit them.
Choose the markets: The next step is to identify the markets and exchanges to trade in. This can include different asset classes such as stocks, commodities, and currencies. It is important to research and analyze the markets thoroughly before making any trades.
Analyze the markets: Analyzing the markets involves looking for price discrepancies and opportunities to make a profit. Traders need to use various tools and techniques such as chart analysis, technical indicators, and fundamental analysis to identify potential trades.
Develop a trading strategy: Once traders have identified potential trades, they need to develop a trading strategy. This involves deciding on the entry and exit points, the size of the trade, and the risk management strategy.
Execute the trades: After developing a trading strategy, traders need to execute the trades. This involves using trading platforms and brokers to place the trades and monitor them in real-time.
Monitor the trades: Monitoring the trades is an essential part of arbitrage trading. Traders need to track the prices of the assets in both markets and make adjustments to their trades as needed.
Keep learning and adapting: Arbitrage trading is a complex trading strategy that requires continuous learning and adaptation. Traders need to stay up to date with the latest trends and developments in the markets and adjust their trading strategies accordingly.
Here are some detailed pointers to understand the benefits and risks associated with crypto arbitrage trading:
Arbitrage trading offers several benefits to traders, including:
These are few risks, associated with arbitrage trading:
The profitability of crypto arbitrage depends on various factors such as current market conditions, trading fees charged by exchanges, speed of execution, and the amount of capital available.
If there are significant price discrepancies between exchanges, traders can potentially make a profit. However, if the price discrepancies are minimal, the potential profit margins may not be worth the effort.
Additionally, traders need to carefully consider the fees charged by exchanges, execute trades quickly and efficiently, and have enough capital to cover trading fees and take advantage of profitable trades. By continuously monitoring the markets and weighing these factors, traders can increase their chances of success in crypto arbitrage trading.
The legality of crypto arbitrage varies from country to country. In general, crypto arbitrage is legal in most countries, but traders should be aware of local regulations and laws governing cryptocurrencies and financial trading.
In the United States, arbitrage trading is considered legal, and it is even encouraged as it helps to increase market efficiency. In addition to that, arbitrageurs play a crucial role in providing liquidity in different markets and acting as intermediaries between buyers and sellers.
It is recommended that traders consult with legal and financial experts and conduct thorough research before engaging in crypto arbitrage trading to ensure compliance with local laws and regulations.
Arbitrage opportunities are commonly found in financial markets, where the same asset is traded at different prices in various locations, including stocks, bonds, and commodities.
Since the cryptocurrency market is complicated, devising successful arbitrage strategies can be challenging. Nevertheless, the practice is legal, and it has the potential to yield substantial returns, while also exposing investors to significant risks.
With the right knowledge, research and expertise, traders can potentially benefit from crypto arbitrage and contribute to the overall efficiency and liquidity of cryptocurrency markets in 2024 and beyond.
The information provided on this website does not constitute investment advice, financial advice, trading advice, or any other sort of advice and you should not treat any of the website's content as such.
Token Metrics does not recommend that any cryptocurrency should be bought, sold, or held by you. Do conduct your own due diligence and consult your financial advisor before making any investment decisions.


9450 SW Gemini Dr
PMB 59348
Beaverton, Oregon 97008-7105 US
.svg)


.png)
Token Metrics Media LLC is a regular publication of information, analysis, and commentary focused especially on blockchain technology and business, cryptocurrency, blockchain-based tokens, market trends, and trading strategies.
Token Metrics Media LLC does not provide individually tailored investment advice and does not take a subscriber’s or anyone’s personal circumstances into consideration when discussing investments; nor is Token Metrics Advisers LLC registered as an investment adviser or broker-dealer in any jurisdiction.
Information contained herein is not an offer or solicitation to buy, hold, or sell any security. The Token Metrics team has advised and invested in many blockchain companies. A complete list of their advisory roles and current holdings can be viewed here: https://tokenmetrics.com/disclosures.html/
Token Metrics Media LLC relies on information from various sources believed to be reliable, including clients and third parties, but cannot guarantee the accuracy and completeness of that information. Additionally, Token Metrics Media LLC does not provide tax advice, and investors are encouraged to consult with their personal tax advisors.
All investing involves risk, including the possible loss of money you invest, and past performance does not guarantee future performance. Ratings and price predictions are provided for informational and illustrative purposes, and may not reflect actual future performance.


%20Price%20Prediction%202025%2C%202030%20-%20Forecast%20Analysis.png)


.png)
%20Price%20Prediction%20.webp)


%20Price%20Prediction.webp)


%20Price%20Prediction%20Analysis%20-%20Can%20it%20Reach%20%24500%20in%20Future_.png)


