


.png)


.png)
.png)


.png)


.png)
%201%20(1).png)

.png)


.png)


.png)
.png)


.png)


.png)

.png)
.png)
.png)
.png)
.png)
.png)
.png)
.png)
.png)


.png)


.png)

.png)
.png)


.png)


.png)
.png)
.png)
.png)

.png)
.png)


Research
Top Crypto Trading Platforms in 2025
When it comes to crypto trading platforms, Token Metrics is not an exchange, but a crypto analytics and crypto trading intelligence platform powered by AI.
Token Metrics Team
10


%201.svg)
%201.svg)
Big news: We’re cranking up the heat on AI-driven crypto analytics with the launch of the Token Metrics API and our official SDK (Software Development Kit). This isn’t just an upgrade – it's a quantum leap, giving traders, hedge funds, developers, and institutions direct access to cutting-edge market intelligence, trading signals, and predictive analytics.
Crypto markets move fast, and having real-time, AI-powered insights can be the difference between catching the next big trend or getting left behind. Until now, traders and quants have been wrestling with scattered data, delayed reporting, and a lack of truly predictive analytics. Not anymore.
The Token Metrics API delivers 32+ high-performance endpoints packed with powerful AI-driven insights right into your lap, including:
Getting started with the Token Metrics API is simple:
At Token Metrics, we believe data should be decentralized, predictive, and actionable.
The Token Metrics API & SDK bring next-gen AI-powered crypto intelligence to anyone looking to trade smarter, build better, and stay ahead of the curve. With our official SDK, developers can plug these insights into their own trading bots, dashboards, and research tools – no need to reinvent the wheel.
Why 2026 Looks Bullish, And What It Could Mean for TRX
The crypto market is shifting toward a broadly bullish regime into 2026 as liquidity improves and risk appetite normalizes.
Regulatory clarity across major regions is reshaping the classic four-year cycle, flows can arrive earlier and persist longer.
Institutional access keeps expanding through ETFs and qualified custody, while L2 scaling and real-world integrations broaden utility.
Infrastructure maturity lowers frictions for capital, which supports deeper order books and more persistent participation.
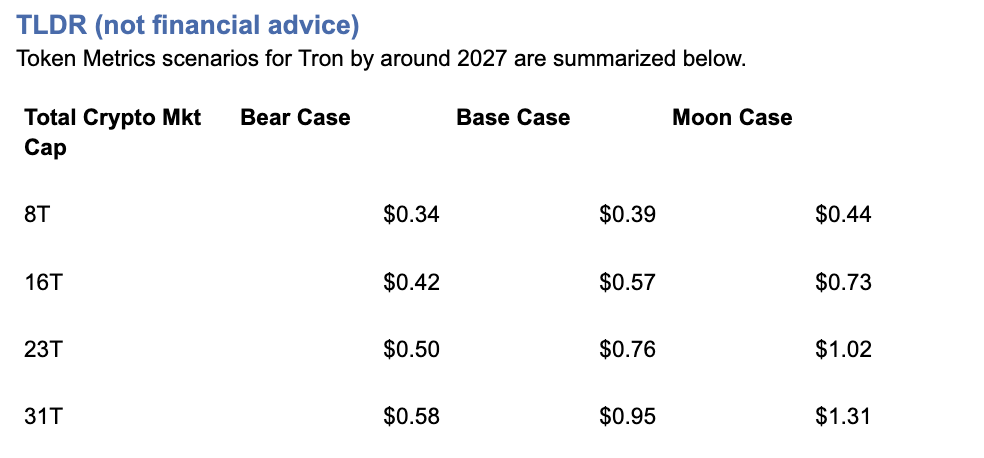
This backdrop frames our scenario work for TRX.
The bands below map potential outcomes to different total crypto market sizes.
Use the table as a quick benchmark, then layer in live grades and signals for timing.
Current price: $0.2971.
How to read it: Each band blends cycle analogues and market-cap share math with TA guardrails. Base assumes steady adoption and neutral or positive macro. Moon layers in a liquidity boom. Bear assumes muted flows and tighter liquidity.
TM Agent baseline: Token Metrics TM Grade for $TRX is 19.06, which translates to a Strong Sell, and the trading signal is bearish, indicating short-term downward momentum.
Price context: $TRX is trading around $0.297, market cap rank #10, and is down about 11% over 30 days while up about 80% year-over-year, it has returned roughly 963% since the last trading signal flip.
Live details: Tron Token Details → https://app.tokenmetrics.com/en/tron
Buy TRX: https://www.mexc.com/acquisition/custom-sign-up?shareCode=mexc-2djd4
Scenario driven, outcomes hinge on total crypto market cap, higher liquidity and adoption lift the bands.
TM Agent gist: bearish near term, upside depends on a sustained risk-on regime and improvements in TM Grade and the trading signal.
Education only, not financial advice.
8T: 
16T: 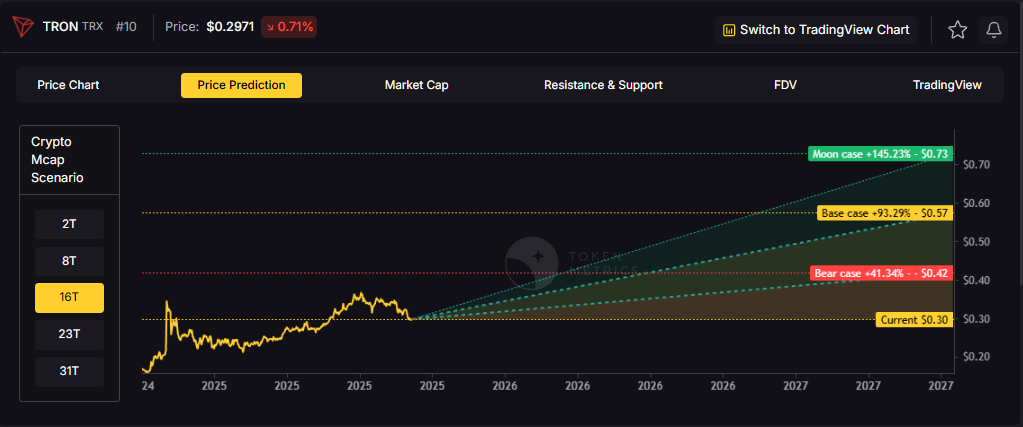
23T: 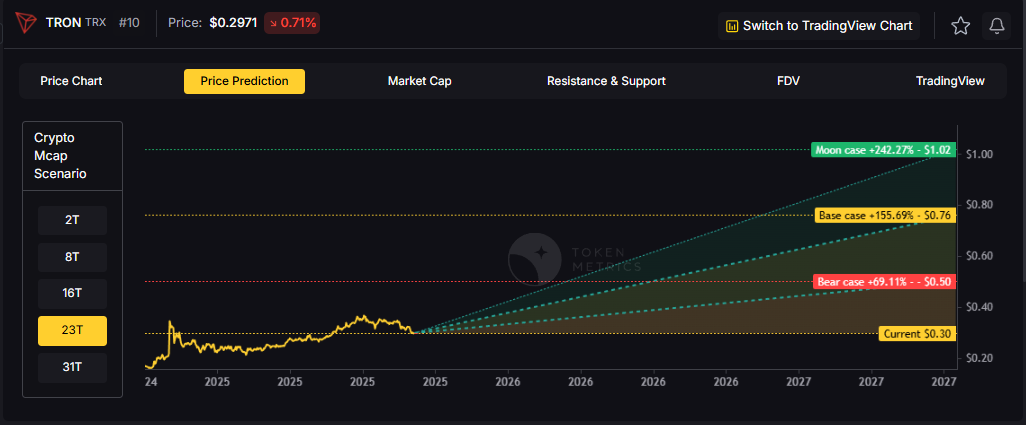
Diversification matters.
Tron is compelling, yet concentrated bets can be volatile.
Token Metrics Indices hold TRX alongside the top one hundred tokens for broad exposure to leaders and emerging winners.
Our backtests indicate that owning the full market with diversified indices has historically outperformed both the total market and Bitcoin in many regimes due to diversification and rotation.
Get early access: https://docs.google.com/forms/d/1AnJr8hn51ita6654sRGiiW1K6sE10F1JX-plqTUssXk/preview
If your editor supports embeds, place a form embed here. Otherwise, include the link above as a button labeled Join Indices Early Access.
Tron is a smart-contract blockchain focused on low-cost, high-throughput transactions and cross-border settlement.
The network supports token issuance and a broad set of dApps, with an emphasis on stablecoin transfer volume and payments.
TRX is the native asset that powers fees and staking for validators and delegators within the network.
Developers and enterprises use the chain for predictable costs and fast finality, which supports consumer-facing use cases.
• Institutional and retail access expands with ETFs, listings, and integrations.
• Macro tailwinds from lower real rates and improving liquidity.
• Product or roadmap milestones such as upgrades, scaling, or partnerships.
• Macro risk-off from tightening or liquidity shocks.
• Regulatory actions or infrastructure outages.
• Concentration or validator economics and competitive displacement.
Unlock platform-wide intelligence on every major crypto asset. Use code ADVANCED20 at checkout for twenty percent off.
AI powered ratings on thousands of tokens for traders and investors.
Interactive TM AI Agent to ask any crypto question.
Indices explorer to surface promising tokens and diversified baskets.
Signal dashboards, backtests, and historical performance views.
Watchlists, alerts, and portfolio tools to track what matters.
Early feature access and enhanced research coverage.
Start with Advanced today → https://www.tokenmetrics.com/token-metrics-pricing
Can TRX reach $1?
Yes, the 23T moon case shows $1.02 and the 31T moon case shows $1.31, which imply a path to $1 in higher-liquidity regimes. Not financial advice.
Is TRX a good long-term investment
Outcome depends on adoption, liquidity regime, competition, and supply dynamics. Diversify and size positions responsibly.

Track live grades and signals: Token Details → https://app.tokenmetrics.com/en/tron
Join Indices Early Access: https://docs.google.com/forms/d/1AnJr8hn51ita6654sRGiiW1K6sE10F1JX-plqTUssXk/preview
Want exposure Buy TRX on MEXC → https://www.mexc.com/acquisition/custom-sign-up?shareCode=mexc-2djd4
Educational purposes only, not financial advice. Crypto is volatile, do your own research and manage risk.
Token Metrics delivers AI-powered crypto ratings, research, and portfolio tools for every level of investor and trader seeking an edge.
Bitcoin
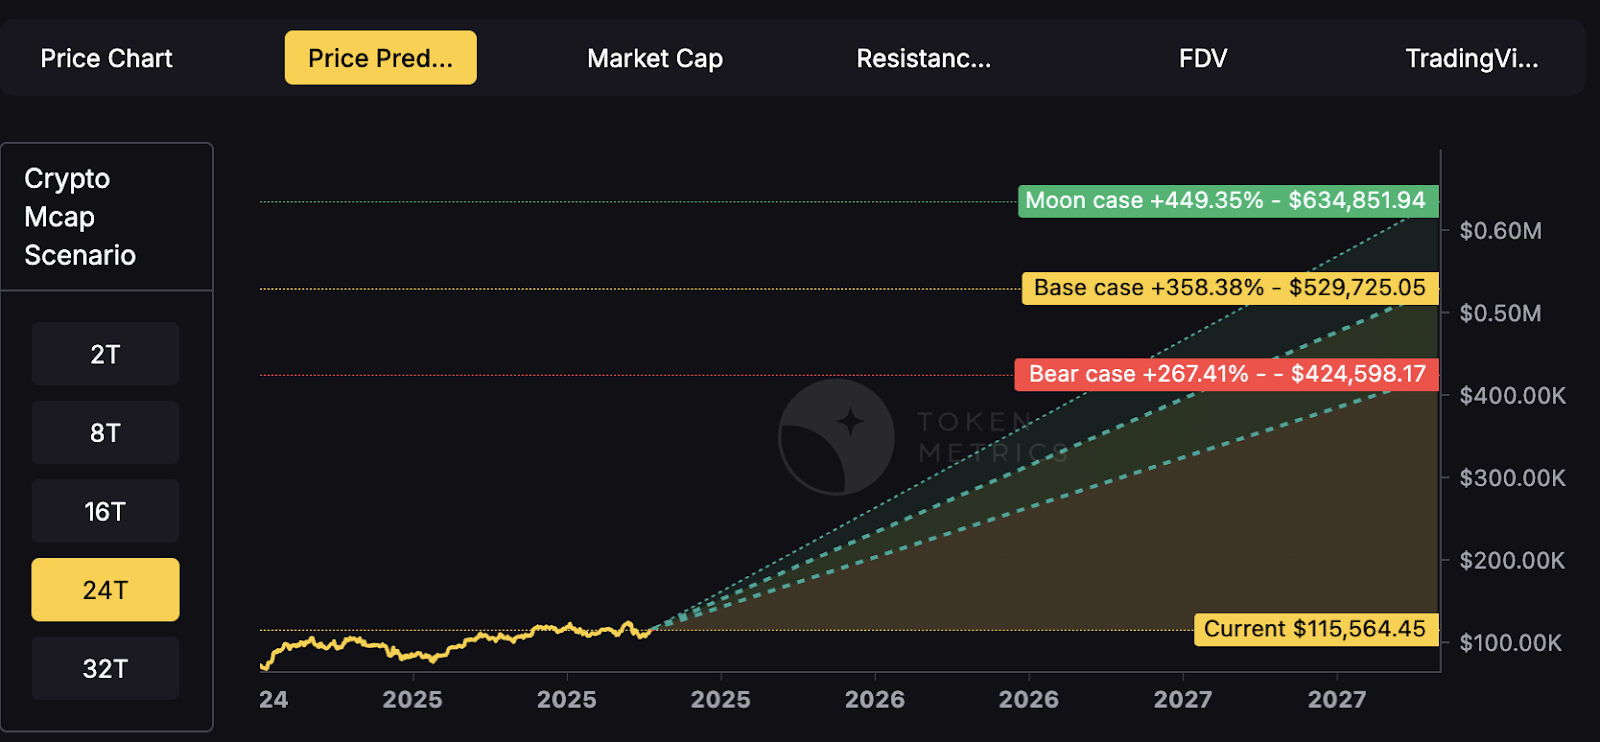
TL;DR (not financial advice): Token Metrics scenarios put BTC between ~$177k–$219k in an $8T total crypto market, $301k–$427k at $16T, $425k–$635k at $24T, and $548k–$843k at $32T by ~2027.
Baseline long-term view from TM Agent: $100k–$250k if macro stays favorable; $20k–$40k downside in a prolonged risk-off regime.
→ Deep dive & live signals: Bitcoin Token Details
→ Want to buy BTC? Use our partner link: MEXC sign-up
Scenario-driven: BTC outcomes hinge on total crypto market cap. Higher aggregate liquidity/adoption = higher BTC bands.
Fundamentals strong: Fundamental Grade 89.53% (Tokenomics 100%, Exchange 100%, Community 84%).
Tech solid: Technology Grade 69.78% (Repo 79%, Collaboration 70%, Activity 63%).
TM Agent baseline: multi-year $100k–$250k with upside if institutions & macro cooperate; risk to $20k–$40k in a severe risk-off.
This article is education only; not financial advice.
Total Crypto Mkt Cap |
Bear Case |
Base Case |
Moon Case |
$8T |
$176,934 |
$197,959 |
$218,985 |
$16T |
$300,766 |
$363,842 |
$426,918 |
$24T |
$424,598 |
$529,725 |
$634,852 |
$32T |
$548,430 |
$695,608 |
$842,786 |
Current price when modeled: ~$115.6k.
How to read it: Each band blends cycle analogues + market-cap share math and applies TA guardrails.
The base path assumes steady ETF/treasury adoption and neutral-to-positive macro; moon adds a liquidity boom + accelerated institutional flows; bear assumes muted flows and tighter liquidity.
8T MCap Scenario

16T MCap Scenario

24T MCap Scenario
32T MCap Scenario

Spot ETF flows, corporate/treasury allocations, and global liquidity are the swing factors that push BTC between the $100k–$250k baseline and the higher scenario bands.
If real rates fall and risk appetite rises, the system can support $16T–$24T crypto, putting BTC’s base case in the $364k–$530k zone.
Programmatic issuance cuts keep the scarcity story intact; historically, post-halving windows have supported asymmetric upside as demand shocks meet slower new supply.
Fundamental Grade 89.53% with perfect Tokenomics and Exchange access supports liquidity and distribution.
Technology Grade 69.78% (Repo 79%, Collaboration 70%) signals a mature, continuously maintained codebase—even if raw dev “Activity” cycles with market phases.
With price recently around $115k, the $8T path implies a medium-term corridor of $177k–$219k if crypto caps stall near cycle mid.
Reclaims above prior weekly supply zones (mid-$100ks to high-$100ks) would bias toward the $16T track ($301k–$427k).
A macro/liquidity slump that undercuts weekly supports could revisit the TM Agent downside zone ($20k–$40k), though that would require a deep and sustained risk-off.
For live support/resistance levels and signals, open: Bitcoin Token Details.
Fundamental Grade: 89.53%
Community: 84%
Tokenomics: 100%
Exchange availability: 100%
DeFi Scanner: 77%
VC Score: N/A

Technology Grade: 69.78%
Activity: 63%
Repository: 79%
Collaboration: 70%
Security: N/A
DeFi Scanner: 77%
Interpretation: Liquidity/access + pristine token mechanics keep BTC the market’s base collateral; tech metrics reflect a conservative, security-first core with steady maintenance rather than hype-driven burst commits.
• ETF/retirement channel penetration broadens demand beyond crypto-native cohorts.
• Treasury adoption (corporates, macro funds) increases “digital collateral” utility.
• Macro easing / falling real yields can push total crypto mkt cap toward $16T–$24T.
• Global tightening (higher real rates, QT) compresses risk premiums.
• Regulatory shocks curtail flows or custody rails.
• Vol/liquidity pockets amplify drawdowns; deep retests remain possible.
Can BTC hit $200k–$250k?
Yes—those sit inside our $8T–$16T bands (base/mid), contingent on continued institutional adoption and constructive macro. Not guaranteed.
Could BTC reach $500k–$800k?
Those levels map to $24T–$32T total crypto scenarios (base → moon). They require a powerful liquidity cycle plus broader balance-sheet adoption.
What invalidates the bull case?
Sustained high real rates, policy tightening, or adverse regulation that throttles ETF/fiat rails—conditions aligned with the TM Agent $20k–$40k downside.
Track the live grade & signals: Bitcoin Token Details
Set alerts around key breakout/retest levels inside Token Metrics.
Want exposure? Consider our partner: Buy BTC on MEXC
Disclosure & disclaimer: This content is for educational purposes only and not financial advice. Cryptocurrency is volatile; do your own research and manage risk.
Cryptocurrency's digital nature creates unprecedented investment opportunities—24/7 global markets, instant transactions, and direct ownership without intermediaries.
But this same digital nature introduces unique security challenges absent from traditional investing.
You can't lose your stock certificates to hackers, but you absolutely can lose your cryptocurrency to theft, scams, or user error.
Industry estimates suggest billions of dollars in cryptocurrency are lost or stolen annually through hacks, phishing attacks, forgotten passwords, and fraudulent schemes.
For many prospective crypto investors, security concerns represent the primary barrier to entry.
"What if I get hacked?" "How do I keep my crypto safe?" "What happens if I lose my password?"
These aren't trivial concerns—they're legitimate questions demanding thoughtful answers before committing capital to digital assets.
Token Metrics AI Indices approach security holistically, addressing not just portfolio construction and performance but the entire ecosystem of risks facing crypto investors.
From selecting fundamentally secure cryptocurrencies to providing guidance on safe custody practices, Token Metrics prioritizes investor protection alongside return generation.
This comprehensive guide explores the complete landscape of crypto security risks, reveals best practices for protecting your investments, and demonstrates how Token Metrics' systematic approach enhances safety across multiple dimensions.
Exchange Hacks and Platform Vulnerabilities
Cryptocurrency exchanges—platforms where users buy, sell, and store digital assets—represent prime targets for hackers given the enormous value they custody.
History is littered with devastating exchange hacks including Mt. Gox (2014): 850,000 Bitcoin stolen, worth $450 million then, billions today; Coincheck (2018): $530 million in NEM tokens stolen; QuadrigaCX (2019): $190 million lost when founder died with only access to cold wallets; and FTX (2022): Collapse resulting in billions in customer losses.
These incidents highlight fundamental custody risks. When you hold cryptocurrency on exchanges, you don't truly control it—the exchange does.
The industry saying captures this reality: "Not your keys, not your coins." Exchange bankruptcy, hacking, or fraud can result in total loss of funds held on platforms.
Token Metrics addresses exchange risk by never directly holding user funds—the platform provides investment guidance and analysis, but users maintain custody of their assets through personal wallets or trusted custodians they select.
This architecture eliminates single-point-of-failure risks inherent in centralized exchange custody.
Private Key Loss and User Error
Unlike traditional bank accounts where forgotten passwords can be reset, cryptocurrency relies on cryptographic private keys providing sole access to funds.
Lose your private key, and your cryptocurrency becomes permanently inaccessible—no customer service department can recover it.
Studies suggest 20% of all Bitcoin (worth hundreds of billions of dollars) is lost forever due to forgotten passwords, discarded hard drives, or deceased holders without key succession plans.
This user-error risk proves particularly acute for non-technical investors unfamiliar with proper key management.
Token Metrics provides educational resources on proper key management, wallet selection, and security best practices.
The platform emphasizes that regardless of how well indices perform, poor personal security practices can negate all investment success.
Phishing, Social Engineering, and Scams
Crypto scams exploit human psychology rather than technical vulnerabilities.
Common schemes include phishing emails impersonating legitimate platforms, fake customer support targeting victims through social media, romance scams building relationships before requesting crypto, pump-and-dump schemes artificially inflating token prices, and fake investment opportunities promising unrealistic returns.
These scams succeed because they manipulate emotions—fear, greed, trust. Even sophisticated investors occasionally fall victim to well-crafted social engineering.
Token Metrics protects users by vetting all cryptocurrencies included in indices, filtering out known scams and suspicious projects.
The platform's AI analyzes on-chain data, code quality, team credentials, and community sentiment, identifying red flags invisible to casual investors. This comprehensive due diligence provides first-line defense against fraudulent projects.
Smart Contract Vulnerabilities
Many cryptocurrencies operate on smart contract platforms where code executes automatically.
Bugs in smart contract code can be exploited, resulting in fund loss. Notable incidents include the DAO hack (2016): $50 million stolen through smart contract vulnerability; Parity wallet bug (2017): $280 million frozen permanently; and numerous DeFi protocol exploits draining millions from liquidity pools.
Token Metrics' analysis evaluates code quality and security audits for projects included in indices.
The AI monitors for smart contract risks, deprioritizing projects with poor code quality or unaudited contracts. This systematic evaluation reduces but doesn't eliminate smart contract risk—inherent to DeFi investing.
Regulatory and Compliance Risks
Cryptocurrency's evolving regulatory landscape creates risks including sudden regulatory restrictions limiting trading or access, tax compliance issues from unclear reporting requirements, securities law violations for certain tokens, and jurisdictional complications from crypto's borderless nature.
Token Metrics monitors regulatory developments globally, adjusting index compositions when regulatory risks emerge.
If specific tokens face heightened regulatory scrutiny, the AI can reduce or eliminate exposure, protecting investors from compliance-related losses.
Understanding Wallet Types
Cryptocurrency storage options exist along a security-convenience spectrum. Hot wallets (software wallets connected to internet) offer convenience for frequent trading but increased hacking vulnerability.
Cold wallets (hardware wallets or paper wallets offline) provide maximum security but reduced convenience for active trading. Custodial wallets (exchanges holding keys) offer simplicity but require trusting third parties.
For Token Metrics investors, recommended approach depends on portfolio size and trading frequency.
Smaller portfolios with frequent rebalancing might warrant hot wallet convenience. Larger portfolios benefit from cold wallet security, moving only amounts needed for rebalancing to hot wallets temporarily.
Hardware Wallet Security
Hardware wallets—physical devices storing private keys offline—represent the gold standard for cryptocurrency security. Popular options include Ledger, Trezor, and others providing "cold storage" immunity to online hacking.
Best practices for hardware wallets include:
• Purchasing directly from manufacturers
• Never buying used
• Verifying device authenticity through manufacturer verification
• Storing recovery seeds securely (physical copies in safe locations)
• Using strong PINs and never sharing device access
For substantial Token Metrics allocations, hardware wallets prove essential.
The modest cost ($50-200) pales compared to security benefits for portfolios exceeding several thousand dollars.
Multi-Signature Security
Multi-signature (multisig) wallets require multiple private keys to authorize transactions—for example, requiring 2-of-3 keys. This protects against single-point-of-failure risks: if one key is compromised, funds remain secure; if one key is lost, remaining keys still enable access.
Advanced Token Metrics investors with substantial holdings should explore multisig solutions through platforms like Gnosis Safe or Casa.
While more complex to set up, multisig dramatically enhances security for large portfolios.
Institutional Custody Solutions
For investors with six-figure+ crypto allocations, institutional custody services provide professional-grade security including:
• Regulated custodians holding cryptocurrency with insurance
• Cold storage with enterprise security protocols
• Compliance with financial industry standards
Services like Coinbase Custody, Fidelity Digital Assets, and others offer insured custody for qualified investors.
While expensive (typically basis points on assets), institutional custody eliminates personal security burdens for substantial holdings.
Password Management and Two-Factor Authentication
Basic security hygiene proves critical for crypto safety.
Use unique, complex passwords for every exchange and platform—password managers like 1Password or Bitwarden facilitate this. Enable two-factor authentication (2FA) using authenticator apps (Google Authenticator, Authy) rather than SMS which can be intercepted.
Never reuse passwords across platforms. A data breach exposing credentials from one service could compromise all accounts using identical passwords. Token Metrics recommends comprehensive password management as foundational security practice.
Recognizing and Avoiding Phishing
Phishing attacks impersonate legitimate services to steal credentials. Red flags include emails requesting immediate action or login, suspicious sender addresses with subtle misspellings, links to domains not matching official websites, and unsolicited contact from "customer support."
Always navigate directly to platforms by typing URLs rather than clicking email links. Verify sender authenticity before responding to any crypto-related communications. Token Metrics will never request passwords, private keys, or urgent fund transfers—any such requests are fraudulent.
Device Security and Network Safety
Maintain device security by:
• Keeping operating systems and software updated
• Running antivirus/anti-malware software
• Avoiding public WiFi for crypto transactions
• Considering dedicated devices for high-value crypto management
The computer or phone accessing crypto accounts represents potential vulnerability.
Compromised devices enable keyloggers capturing credentials or malware stealing keys. For substantial portfolios, dedicated devices used only for crypto management enhance security.
Cold Storage for Long-Term Holdings
For cryptocurrency not needed for active trading—long-term holdings in Token Metrics indices not requiring frequent rebalancing—cold storage provides maximum security.
Generate addresses on air-gapped computers, transfer funds to cold storage addresses, and store private keys/recovery seeds in physical safes or bank safety deposit boxes.
This approach trades convenience for security—appropriate for the majority of holdings requiring only occasional access.
No Custody Model
Token Metrics' fundamental security advantage is never taking custody of user funds. Unlike exchanges that become honeypots for hackers by concentrating billions in crypto, Token Metrics operates as an information and analytics platform. Users implement index strategies through their own chosen custody solutions.
This architecture eliminates platform hacking risk to user funds. Even if Token Metrics platform experienced data breach (which comprehensive security measures prevent), user cryptocurrency remains safe in personal or custodial wallets.
Data Security and Privacy
Token Metrics implements enterprise-grade security for user data including:
• Encrypted data transmission and storage
• Regular security audits and penetration testing
• Access controls limiting employee data access
• Compliance with data protection regulations
While Token Metrics doesn't hold crypto, protecting user data—account information, portfolio holdings, personal details—remains paramount.
The platform's security infrastructure meets standards expected of professional financial services.
API Security and Access Control
For users implementing Token Metrics strategies through API connections to exchanges, the platform supports secure API practices including:
• Read-only API keys when possible (avoiding withdrawal permissions)
• IP whitelisting restricting API access to specific addresses
• Regularly rotating API keys as security best practice
Never grant withdrawal permissions through API keys unless absolutely necessary.
Token Metrics strategies can be implemented through read-only keys providing portfolio data without risking unauthorized fund movement.
Continuous Monitoring and Threat Detection
Token Metrics employs active security monitoring including:
• Unusual activity detection flagging suspicious account access
• Threat intelligence monitoring for emerging crypto security risks
• Rapid incident response protocols should breaches occur
This proactive approach identifies and addresses security threats before they impact users, maintaining platform integrity and protecting user interests.
Diversification as Risk Management
Security isn't just about preventing theft—it's also about preventing portfolio devastation through poor investment decisions. Token Metrics' diversification inherently provides risk management by:
• Preventing over-concentration in any single cryptocurrency
• Spreading exposure across projects with different risk profiles
• Combining assets with low correlations reducing portfolio volatility
This diversification protects against the "secure wallet, worthless holdings" scenario where cryptocurrency is safely stored but becomes valueless due to project failure or market collapse.
Liquidity Risk Management
Liquidity—ability to buy or sell without significantly impacting price—represents important risk dimension. Token Metrics indices prioritize liquid cryptocurrencies with substantial trading volumes, multiple exchange listings, and deep order books.
This liquidity focus ensures you can implement index strategies efficiently and exit positions when necessary without severe slippage.
Illiquid tokens might offer higher theoretical returns but expose investors to inability to realize those returns when selling.
Regulatory Compliance and Tax Security
Following applicable laws and regulations protects against government enforcement actions, penalties, or asset seizures. Token Metrics provides transaction histories supporting tax compliance but users must maintain detailed records of all crypto activities including purchases, sales, rebalancing transactions, and transfers between wallets.
Consider working with crypto-specialized tax professionals ensuring full compliance with reporting requirements. The cost of professional tax assistance proves trivial compared to risks from non-compliance.
Emergency Preparedness and Succession Planning
Comprehensive security includes planning for emergencies including:
• Documenting wallet access instructions for trusted individuals
• Maintaining secure backup of recovery seeds and passwords
• Creating crypto asset inventory for estate planning
• Considering legal documents addressing cryptocurrency inheritance
Without proper planning, your cryptocurrency could become inaccessible to heirs upon death. Many families have lost access to substantial crypto holdings due to lack of succession planning.
Assessing Your Security Needs
Security requirements scale with portfolio size and complexity.
For small portfolios under $5,000, reputable exchange custody with 2FA and strong passwords may suffice. For portfolios of $5,000-$50,000, hardware wallets become essential for majority of holdings.
For portfolios exceeding $50,000, multisig or institutional custody warrant serious consideration. For portfolios exceeding $500,000, professional security consultation and institutional custody become prudent.
Assess your specific situation honestly, implementing security measures appropriate for your holdings and technical capabilities.
Creating Security Checklists
Develop systematic security checklists covering:
• Regular security audits of wallet configurations
• Password rotation schedules
• 2FA verification across all platforms
• Recovery seed backup verification
• Device security updates
Regular checklist execution ensures security doesn't degrade over time as you become complacent. Set quarterly reminders for comprehensive security reviews.
Continuous Education
Crypto security threats evolve constantly. Stay informed through:
• Token Metrics educational resources and platform updates
• Cryptocurrency security news and advisories
• Community forums discussing emerging threats
• Periodic security webinars and training
Knowledge proves the most powerful security tool. Understanding threat landscape enables proactive defense rather than reactive damage control.
Cryptocurrency's revolutionary potential means nothing if your investment is lost to theft, hacks, or user error.
Security isn't an afterthought—it's the foundation enabling confident long-term investing. Without proper security measures, even the most sophisticated investment strategies become meaningless.
Token Metrics AI Indices provide comprehensive security through multiple dimensions—selecting fundamentally secure cryptocurrencies, providing educational resources on custody best practices, implementing platform-level security protecting user data, and maintaining no-custody architecture eliminating single-point-of-failure risks.
But ultimately, security requires your active participation. Token Metrics provides tools, knowledge, and guidance, but you must implement proper custody solutions, maintain operational security hygiene, and stay vigilant against evolving threats.
The investors who build lasting crypto wealth aren't just those who select winning tokens—they're those who protect their investments with appropriate security measures. In cryptocurrency's digital landscape where irreversible transactions and pseudonymous attackers create unique challenges, security determines who ultimately enjoys their gains and who watches helplessly as value evaporates.
Invest intelligently with Token Metrics' AI-powered indices. Protect that investment with comprehensive security practices. This combination—sophisticated strategy plus robust security—positions you for long-term success in cryptocurrency's high-opportunity, high-risk environment.
Your crypto investments deserve professional-grade portfolio management and professional-grade security. Token Metrics delivers both.
At Token Metrics, safeguarding your crypto assets is fundamentally built into our platform.
We never take custody of client funds; instead, our AI-driven indices provide guidance, education, and advanced risk screening so you retain full control over your assets at all times.
Our robust platform-level security—encompassing encrypted communications, role-based access, and continuous threat monitoring—offers enterprise-grade protection for your data and strategies.
Whether you want to analyze secure projects, develop stronger portfolio management, or combine expert research with your own secure storage, Token Metrics provides a comprehensive support system to help you invest confidently and safely.
Use unique, complex passwords for every platform, enable two-factor authentication using authenticator apps (not SMS), avoid custodial wallets on exchanges for long-term holdings, store large balances in hardware wallets, and never share your private keys with anyone.
Hardware wallets offer the highest level of security for most users. For substantial balances, using multi-signature wallets or institutional custodians (for qualified investors) adds protection. Always keep backup recovery phrases in secure physical locations.
AI indices, such as those from Token Metrics, systematically vet projects for smart contract vulnerabilities, regulatory issues, code security, liquidity, and signs of fraudulent activity, thus reducing exposure to compromised or risky assets.
Do not interact with the suspicious message. Instead, independently visit the platform’s website by typing the URL directly and contact official customer support if needed. Never provide passwords or private keys to unsolicited contacts.
Document wallet access information and recovery instructions for trusted family or legal representatives. Maintain secure, physical records of all backup phrases, and consider legal estate planning that addresses your digital assets.
This blog is for informational and educational purposes only and does not constitute investment advice, a recommendation, or an offer to buy or sell any cryptocurrency or digital asset. You should consult your own legal, tax, and financial professionals before making any investment or security decisions. While every effort was made to ensure accuracy, neither Token Metrics nor its contributors accept liability for losses or damages resulting from information in this blog.
.svg)


.png)
Token Metrics Media LLC is a regular publication of information, analysis, and commentary focused especially on blockchain technology and business, cryptocurrency, blockchain-based tokens, market trends, and trading strategies.
Token Metrics Media LLC does not provide individually tailored investment advice and does not take a subscriber’s or anyone’s personal circumstances into consideration when discussing investments; nor is Token Metrics Advisers LLC registered as an investment adviser or broker-dealer in any jurisdiction.
Information contained herein is not an offer or solicitation to buy, hold, or sell any security. The Token Metrics team has advised and invested in many blockchain companies. A complete list of their advisory roles and current holdings can be viewed here: https://tokenmetrics.com/disclosures.html/
Token Metrics Media LLC relies on information from various sources believed to be reliable, including clients and third parties, but cannot guarantee the accuracy and completeness of that information. Additionally, Token Metrics Media LLC does not provide tax advice, and investors are encouraged to consult with their personal tax advisors.
All investing involves risk, including the possible loss of money you invest, and past performance does not guarantee future performance. Ratings and price predictions are provided for informational and illustrative purposes, and may not reflect actual future performance.


%20Price%20Prediction%202025%2C%202030%20-%20Forecast%20Analysis.png)


.png)

%20Price%20Prediction%20.webp)


%20Price%20Prediction.webp)


%20Price%20Prediction%20Analysis%20-%20Can%20it%20Reach%20%24500%20in%20Future_.png)


