


%20Price%20Prediction.webp)


.png)


.png)
.png)


.png)


.png)
%201%20(1).png)

.png)


.png)


.png)
.png)


.png)


.png)

.png)
.png)
.png)
.png)
.png)
.png)
.png)
.png)
.png)


.png)


.png)

.png)
.png)


.png)


.png)
.png)
.png)
.png)

.png)
.png)


Research
Top Crypto Trading Platforms in 2025
When it comes to crypto trading platforms, Token Metrics is not an exchange, but a crypto analytics and crypto trading intelligence platform powered by AI.
Token Metrics Team
10 min


%201.svg)
%201.svg)
Big news: We’re cranking up the heat on AI-driven crypto analytics with the launch of the Token Metrics API and our official SDK (Software Development Kit). This isn’t just an upgrade – it's a quantum leap, giving traders, hedge funds, developers, and institutions direct access to cutting-edge market intelligence, trading signals, and predictive analytics.
Crypto markets move fast, and having real-time, AI-powered insights can be the difference between catching the next big trend or getting left behind. Until now, traders and quants have been wrestling with scattered data, delayed reporting, and a lack of truly predictive analytics. Not anymore.
The Token Metrics API delivers 32+ high-performance endpoints packed with powerful AI-driven insights right into your lap, including:
Getting started with the Token Metrics API is simple:
At Token Metrics, we believe data should be decentralized, predictive, and actionable.
The Token Metrics API & SDK bring next-gen AI-powered crypto intelligence to anyone looking to trade smarter, build better, and stay ahead of the curve. With our official SDK, developers can plug these insights into their own trading bots, dashboards, and research tools – no need to reinvent the wheel.
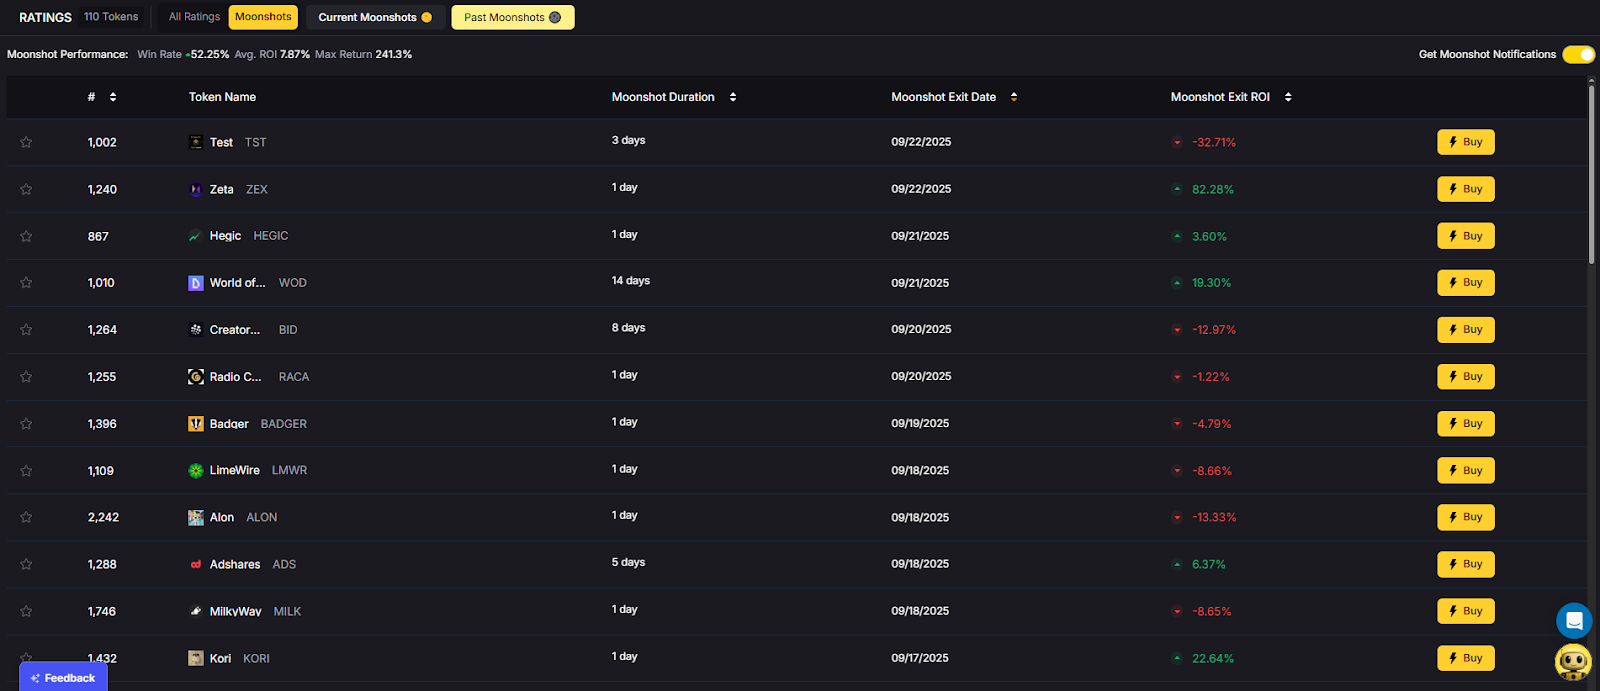
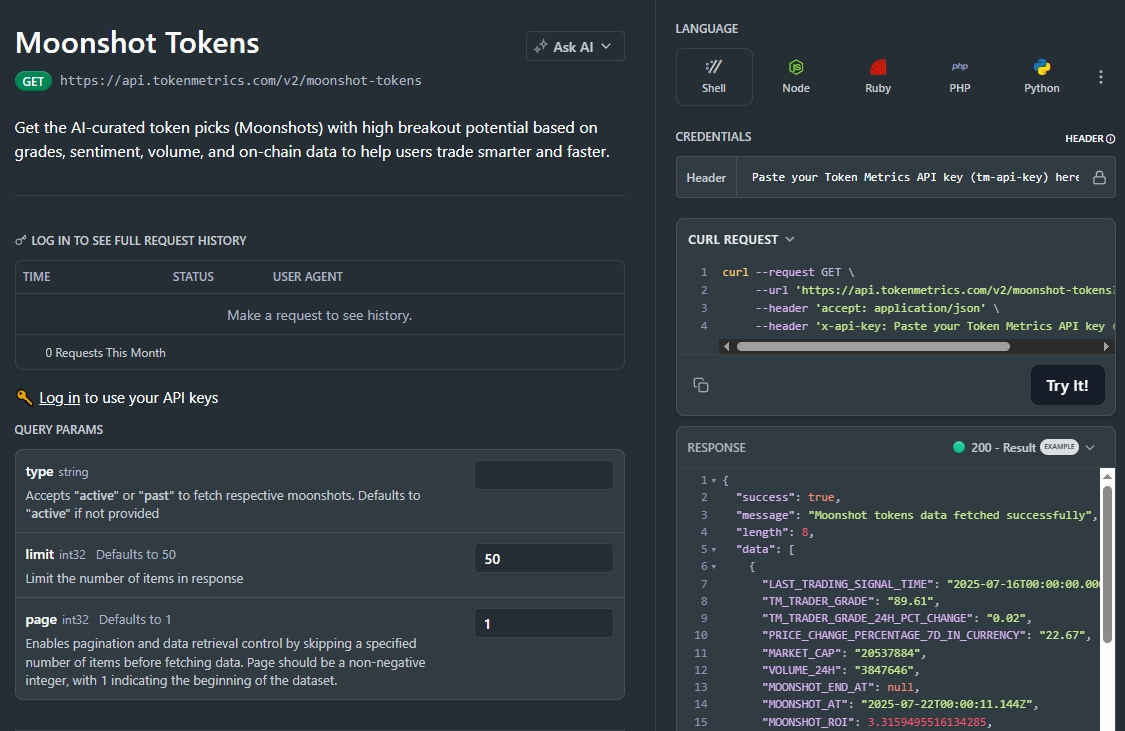
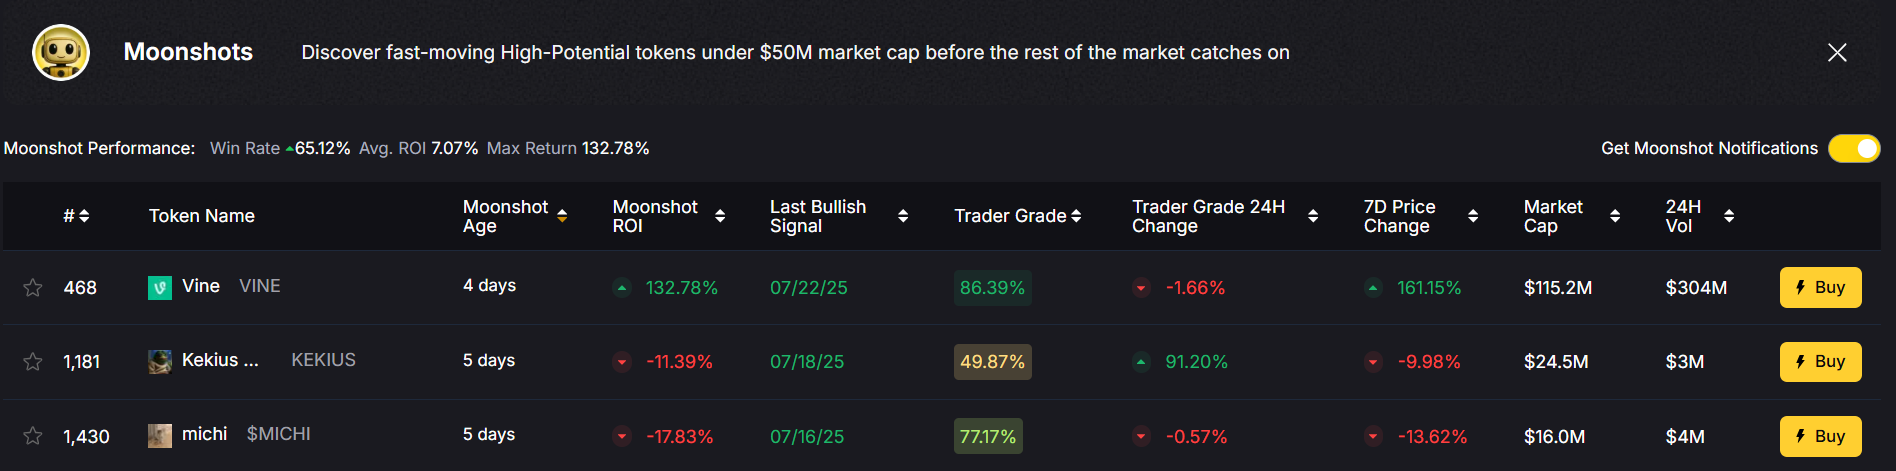
The biggest gains in crypto rarely come from the majors. They come from Moonshots—fast-moving tokens with breakout potential. The Moonshots API surfaces these candidates programmatically so you can rank, alert, and act inside your product. In this guide, you’ll call /v2/moonshots, display a high-signal list with TM Grade and Bullish tags, and wire it into bots, dashboards, or screeners in minutes. Start by grabbing your key at Get API Key, then Run Hello-TM and Clone a Template to ship fast.
Discovery that converts. Users want more than price tickers—they want a curated, explainable list of high-potential tokens. The moonshots API encapsulates multiple signals into a short list designed for exploration, alerts, and watchlists you can monetize.
Built for builders. The endpoint returns a consistent schema with grade, signal, and context so you can immediately sort, badge, and trigger workflows. With predictable latency and clear filters, you can scale to dashboards, mobile apps, and headless bots without reinventing the discovery pipeline.
The Moonshots API cURL request is right there in the top right of the API Reference. Grab it and start tapping into the potential!
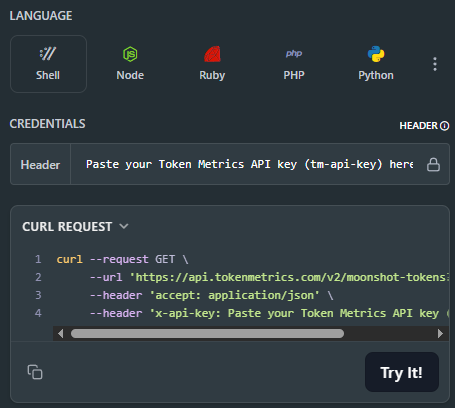
👉 Keep momentum: Get API Key • Run Hello-TM • Clone a Template
Fork a screener or alerting template, plug your key, and deploy. Validate your environment with Hello-TM. When you scale users or need higher limits, compare API plans.
The Moonshots endpoint aggregates a set of evidence—often combining TM Grade, signal state, and momentum/volume context—into a shortlist of breakout candidates. Each row includes a symbol, grade, signal, and timestamp, plus optional reason tags for transparency.
For UX, a common pattern is: headline list → token detail where you render TM Grade (quality), Trading Signals (timing), Support/Resistance (risk placement), Quantmetrics (risk-adjusted performance), and Price Prediction scenarios. This lets users understand why a token was flagged and how to act with risk controls.
Polling vs webhooks. Dashboards typically poll with short-TTL caching. Alerting flows use scheduled jobs or webhooks (where available) to smooth traffic and avoid duplicates. Always make notifications idempotent.
1) What does the Moonshots API return?
A list of breakout candidates with fields such as symbol, tm_grade, signal (often Bullish/Bearish), optional reason tags, and updated_at. Use it to drive discover tabs, alerts, and watchlists.
2) How fresh is the list? What about latency/SLOs?
The endpoint targets predictable latency and timely updates for dashboards and alerts. Use short-TTL caching and queued jobs/webhooks to avoid bursty polling.
3) How do I use Moonshots in a trading workflow?
Common stack: Moonshots for discovery, Trading Signals for timing, Support/Resistance for SL/TP, Quantmetrics for sizing, and Price Prediction for scenario context. Always backtest and paper-trade first.
4) I saw results like “+241%” and a “7.5% average return.” Are these guaranteed?
No. Any historical results are illustrative and not guarantees of future performance. Markets are risky; use risk management and testing.
5) Can I filter the Moonshots list?
Yes—pass parameters like min_grade, signal, and limit (as supported) to tailor to your audience and keep pages fast.
6) Do you provide SDKs or examples?
REST works with JavaScript and Python snippets above. Docs include quickstarts, Postman collections, and templates—start with Run Hello-TM.
7) Pricing, limits, and enterprise SLAs?
Begin free and scale up. See API plans for rate limits and enterprise options.
Most traders still draw lines by hand in TradingView. The support and resistance API from Token Metrics auto-calculates clean support and resistance levels from one request, so your dashboard, bot, or alerts can react instantly. In minutes, you’ll call /v2/resistance-support, render actionable levels for any token, and wire them into stops, targets, or notifications. Start by grabbing your key on Get API Key, then Run Hello-TM and Clone a Template to ship a production-ready feature fast.
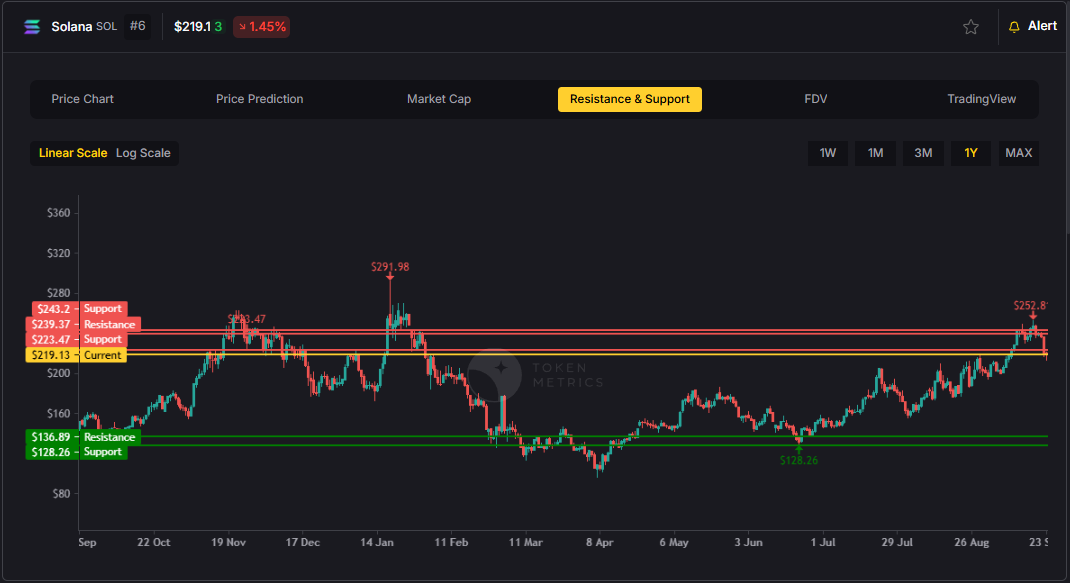
Precision beats guesswork. Hand-drawn lines are subjective and slow. The support and resistance API standardizes levels across assets and timeframes, enabling deterministic stops and take-profits your users (and bots) can trust.
Production-ready by design. A simple REST shape, predictable latency, and clear semantics let you add levels to token pages, automate SL/TP alerts, and build rule-based execution with minimal glue code.
Need the Support and Resistance data? The cURL request for it is in the top right of the API Reference for quick access.
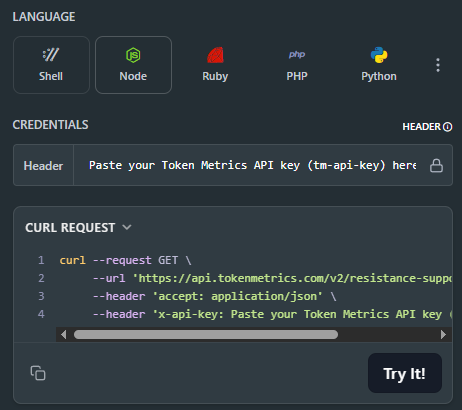
👉 Keep momentum: Get API Key • Run Hello-TM • Clone a Template
Kick off with our quickstarts—fork a bot or dashboard template, plug your key, and deploy. Confirm your environment by Running Hello-TM. When you’re scaling or need webhooks/limits, review API plans.
The Support/Resistance endpoint analyzes recent price structure to produce discrete levels above and below current price, along with strength indicators you can use for priority and styling. Query /v2/resistance-support?symbol=<ASSET>&timeframe=<HORIZON> to receive arrays of level objects and timestamps.
Polling vs webhooks. For dashboards, short-TTL caching and batched fetches keep pages snappy. For bots and alerts, use queued jobs or webhooks (where applicable) to avoid noisy, bursty polling—especially around market opens and major events.
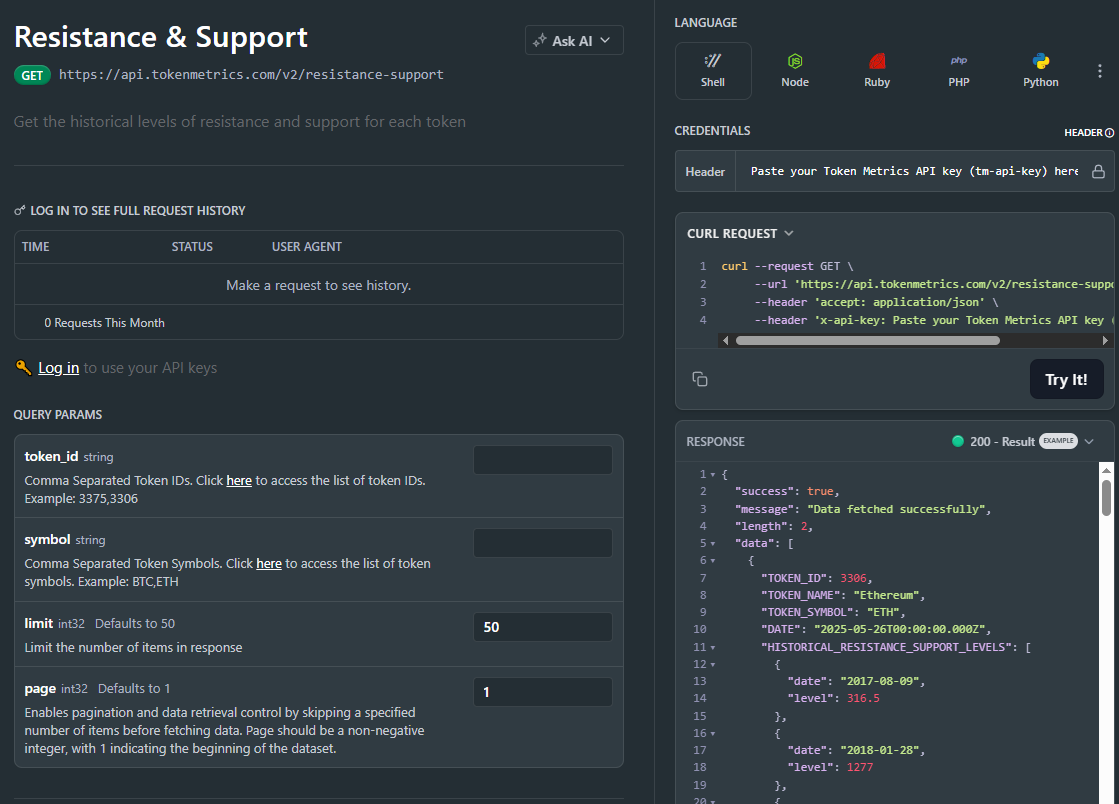
1) What does the Support & Resistance API return?
A JSON payload with arrays of support and resistance levels for a symbol (and optional timeframe), each with a price and strength indicator, plus an update timestamp.
2) How timely are the levels? What are the latency/SLOs?
The endpoint targets predictable latency suitable for dashboards and alerts. Use short-TTL caching for UIs, and queued jobs or webhooks for alerting to smooth traffic.
3) How do I trigger alerts or trades from levels?
Common patterns: alert when price is within X% of a level, touches a level, or breaks beyond with confirmation. Always make downstream actions idempotent and respect rate limits.
4) Can I combine levels with other endpoints?
Yes—pair with /v2/trading-signals for timing, /v2/tm-grade for quality context, and /v2/quantmetrics for risk sizing. This yields a complete decide-plan-execute loop.
5) Which timeframe should I use?
Intraday bots prefer shorter horizons; swing/position dashboards use daily or higher-timeframe levels. Offer a timeframe toggle and cache results per setting.
6) Do you provide SDKs or examples?
Use the REST snippets above (JS/Python). The docs include quickstarts, Postman collections, and templates—start with Run Hello-TM.
7) Pricing, limits, and enterprise SLAs?
Begin free and scale as you grow. See API plans for rate limits and enterprise SLA options.
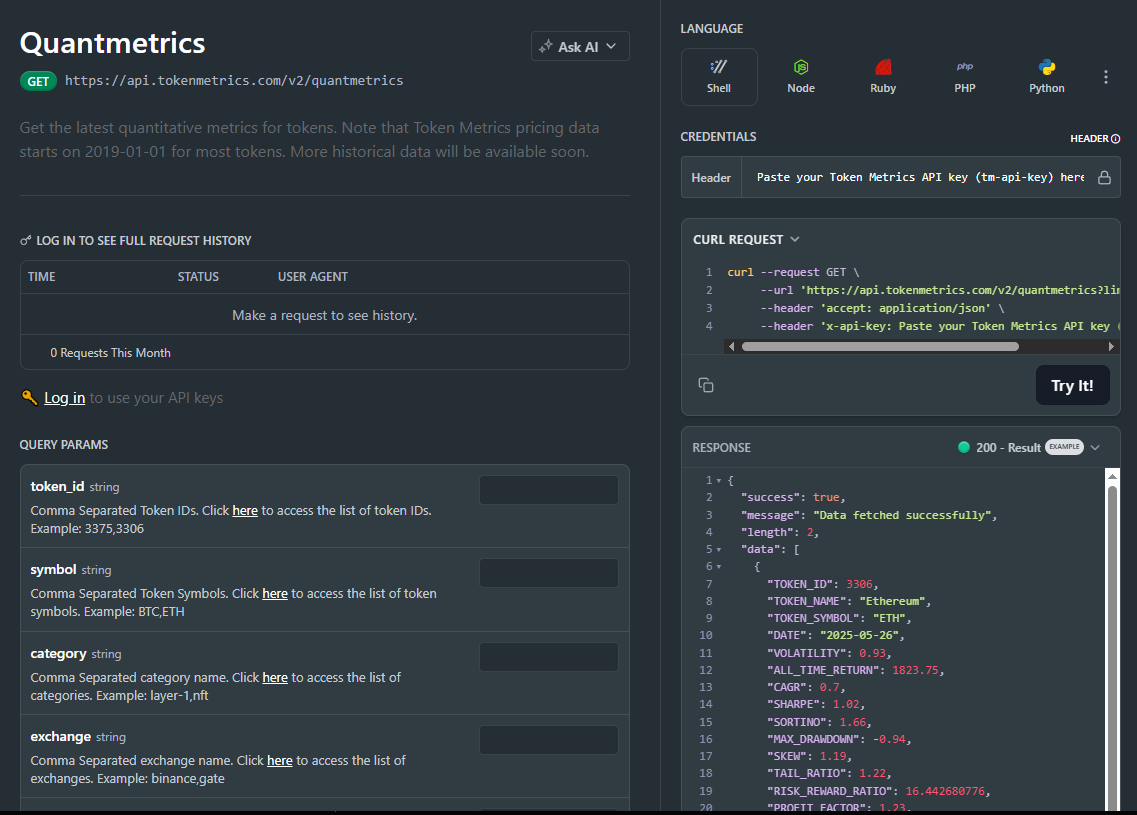
Most traders see price—quants see probabilities. The Quantmetrics API turns raw performance into risk-adjusted stats like Sharpe, Sortino, volatility, drawdown, and CAGR so you can compare tokens objectively and build smarter bots and dashboards. In minutes, you’ll query /v2/quantmetrics, render a clear performance snapshot, and ship a feature that customers trust. Start by grabbing your key at Get API Key, Run Hello-TM to verify your first call, then Clone a Template to go live fast.
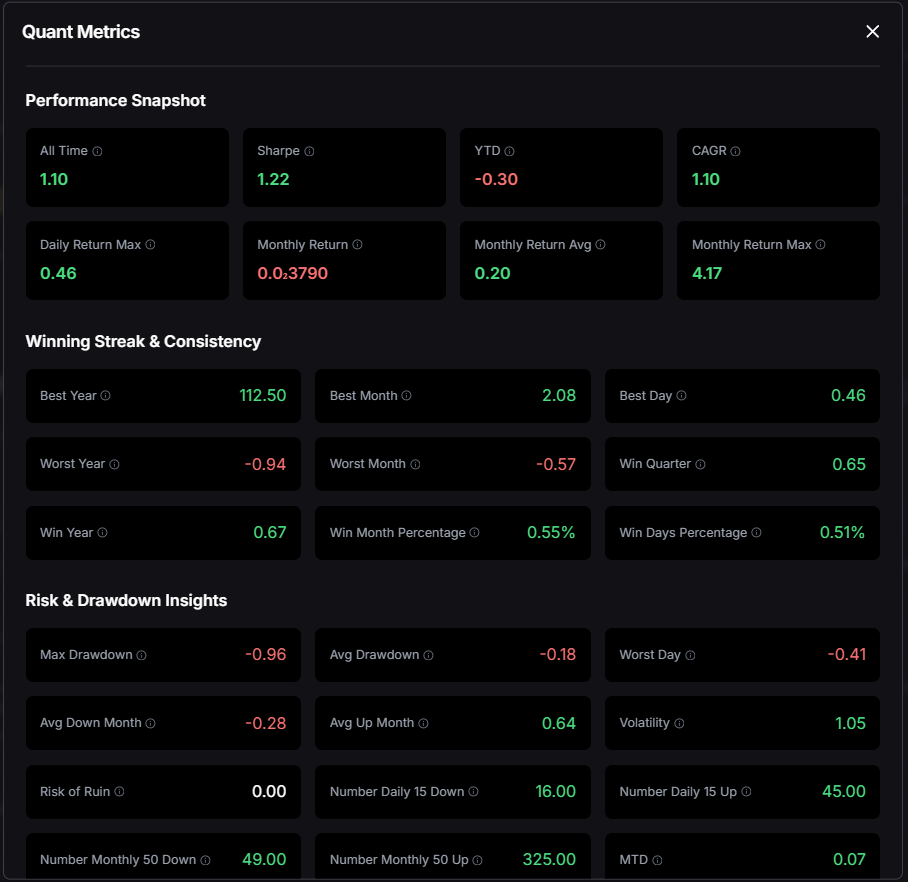
Risk-adjusted truth beats hype. Price alone hides tail risk and whipsaws. Quantmetrics compresses edge, risk, and consistency into metrics that travel across assets and timeframes—so you can rank universes, size positions, and communicate performance like a pro.
Built for dev speed. A clean REST schema, predictable latency, and easy auth mean you can plug Sharpe/Sortino into bots, dashboards, and screeners without maintaining your own analytics pipeline. Pair with caching and batching to serve fast pages at scale.
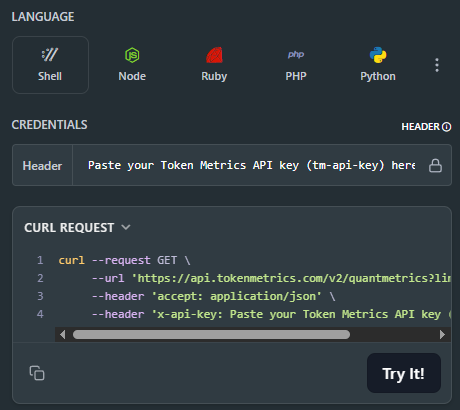
The Quant Metrics cURL request is located in the top right of the API Reference, allowing you to easily integrate it with your application.
👉 Keep momentum: Get API Key • Run Hello-TM • Clone a Template
Kick off from quickstarts in the docs—fork a dashboard or screener template, plug your key, and deploy in minutes. Validate your environment with Run Hello-TM; when you need more throughput or webhooks, compare API plans.
Quantmetrics computes risk-adjusted performance over a chosen lookback (e.g., 30d, 90d, 1y). You’ll receive a JSON snapshot with core statistics:
Call /v2/quantmetrics?symbol=<ASSET>&window=<LOOKBACK> to fetch the current snapshot. For dashboards spanning many tokens, batch symbols and apply short-TTL caching. If you generate alerts (e.g., “Sharpe crossed 1.5”), run a scheduled job and queue notifications to avoid bursty polling.
1) What does the Quantmetrics API return?
A JSON snapshot of risk-adjusted metrics (e.g., Sharpe, Sortino, volatility, max drawdown, CAGR) for a symbol and lookback window—ideal for ranking, sizing, and dashboards.
2) How fresh are the stats? What about latency/SLOs?
Responses are engineered for predictable latency. For heavy UI usage, add short-TTL caching and batch requests; for alerts, use scheduled jobs or webhooks where available.
3) Can I use Quantmetrics to size positions in a live bot?
Yes—many quants size inversely to volatility or require Sharpe ≥ X to trade. Always backtest and paper-trade before going live; past results are illustrative, not guarantees.
4) Which lookback window should I choose?
Short windows (30–90d) adapt faster but are noisier; longer windows (6–12m) are steadier but slower to react. Offer users a toggle and cache each window.
5) Do you provide SDKs or examples?
REST is straightforward (JS/Python above). Docs include quickstarts, Postman collections, and templates—start with Run Hello-TM.
6) Polling vs webhooks for quant alerts?
Dashboards usually use cached polling. For threshold alerts (e.g., Sharpe crosses 1.0), run scheduled jobs and queue notifications to keep usage smooth and idempotent.
7) Pricing, limits, and enterprise SLAs?
Begin free and scale up. See API plans for rate limits and enterprise SLA options.

Smart contracts are self-executing contracts with the terms directly written into code, widely used across blockchain platforms to automate decentralized applications (DApps) and financial protocols. However, despite their innovation and efficiency, vulnerabilities in smart contracts pose significant risks, potentially leading to loss of funds, exploits, or unauthorized actions.
With the increasing complexity and volume of smart contracts being deployed, traditional manual auditing methods struggle to keep pace. This has sparked interest in leveraging Artificial Intelligence (AI) to enhance the identification and mitigation of vulnerabilities in smart contracts.
Smart contract vulnerabilities typically arise from coding errors, logic flaws, or insufficient access controls. Common categories include reentrancy attacks, integer overflows, timestamp dependencies, and unchecked external calls. Identifying such vulnerabilities requires deep code analysis, often across millions of lines of code in decentralized ecosystems.
Manual audits by security experts are thorough but time-consuming and expensive. Moreover, the human factor can result in missed weaknesses, especially in complex contracts. As the blockchain ecosystem evolves, utilizing AI to assist in this process has become a promising approach.
AI techniques, particularly machine learning (ML) and natural language processing (NLP), can analyze smart contract code by learning from vast datasets of previously identified vulnerabilities and exploits. The primary roles of AI here include:
Several AI-based methodologies have been adopted to aid vulnerability detection:
Some emerging platforms integrate such AI techniques to provide developers and security teams with enhanced vulnerability scanning capabilities.
Compared to manual or rule-based approaches, AI provides several notable benefits:
Despite these advantages, AI is complementary to expert review rather than a replacement, as audits require contextual understanding and judgment that AI currently cannot fully replicate.
While promising, AI application in this domain faces several hurdles:
Developers and security practitioners can optimize the benefits of AI by:
AI has a growing and important role in identifying vulnerabilities within smart contracts by providing scalable, consistent, and efficient analysis. While challenges remain, the combined application of AI tools with expert audits paves the way for stronger blockchain security.
As AI models and training data improve, and as platforms integrate these capabilities more seamlessly, users can expect increasingly proactive and precise identification of risks in smart contracts.
This article is for educational and informational purposes only. It does not constitute financial, investment, or legal advice. Always conduct your own research and consider consulting professionals when dealing with blockchain security.

The emergence of Web3 has sparked diverse conversations in technology and blockchain communities. Some consider it the next revolutionary phase of the internet, while others dismiss it as mere hype. This blog explores whether Web3 is just a buzzword or if it represents a tangible and meaningful evolution in digital interactions.
Web3 broadly refers to a new paradigm of the internet built on decentralized technologies like blockchain, aiming to enable peer-to-peer interactions without centralized intermediaries. Unlike Web2, which is dominated by centralized platforms controlling data and services, Web3 proposes a more open, user-controlled internet.
Key Web3 features include:
Web3 relies heavily on blockchain technology, smart contracts, and decentralized applications (dApps). These components facilitate trustless transactions and programmable digital agreements.
Notable Web3 applications include decentralized finance (DeFi), non-fungible tokens (NFTs), and decentralized autonomous organizations (DAOs). These innovations demonstrate practical use cases extending beyond theoretical frameworks.
Moreover, artificial intelligence (AI) tools are increasingly applied to analyze and navigate the evolving Web3 landscape. Platforms such as Token Metrics leverage AI-driven insights to help users research blockchain projects and assess technology fundamentals without financial recommendations.
Critics argue that Web3 might be overhyped with limited real-world adoption so far. Challenges include scalability issues, user experience complexities, regulatory uncertainties, and potential misuse.
However, innovation cycles often follow initial hype phases. Historical tech developments illustrate how novel ideas initially labeled as buzzwords eventually matured into foundational technologies over time.
Scenario analysis suggests varying outcomes for Web3:
Due diligence is essential in understanding Web3 initiatives. Consider these points when researching:
Leveraging AI-powered platforms like Token Metrics can assist users in organizing and interpreting vast data points objectively, aiding a comprehensive understanding.
Regulation remains an evolving factor for Web3 projects. Decentralized governance models, such as DAOs, aim to allow stakeholder participation in decision-making processes. However, legal frameworks vary globally and can impact project development and adoption.
Understanding the nuanced regulatory landscape is critical for assessing the long-term feasibility and resilience of Web3 innovations.
Web3 encompasses transformative potentials in reimagining internet architecture. While it faces significant hurdles and exhibits hype characteristics, substantial technological progress and adoption signals suggest it is more than mere buzzword.
Objective analysis, supported by AI research tools like Token Metrics, can facilitate critical evaluation of emerging projects and technologies within this evolving domain.
This article is for educational and informational purposes only and does not constitute financial advice. Readers should conduct their own research and consult professional advisors before making any decisions related to blockchain technologies or digital assets.
The internet has become an integral part of modern life, continually evolving since its inception. In recent years, a new paradigm called Web3 has emerged, promising to reshape how users interact with digital platforms. This blog post explores the fundamental differences between Web3 and the current internet, often referred to as Web2, to clarify what Web3 entails and its potential impact.
Web3 represents the next phase of the internet, built on the principle of decentralization. Unlike the current centralized internet infrastructure, Web3 aims to distribute control away from traditional intermediaries like corporations and governments to users and communities. Key technologies underpinning Web3 include blockchain, decentralized finance (DeFi), non-fungible tokens (NFTs), and decentralized autonomous organizations (DAOs).
At its core, Web3 is designed to empower users to own and control their data, digital assets, and online identities through cryptographic proof rather than relying on centralized entities. This shift holds the promise of enhanced privacy, improved security, and greater transparency across digital services.
The current internet, or Web2, is characterized by centralized platforms such as social media networks, content-sharing sites, and cloud service providers. These platforms control user data and have significant influence over digital ecosystems. Web3 introduces several pivotal differences:
A few seminal technologies make the Web3 vision feasible:
These technologies collectively foster environments where decentralized applications can function effectively, distinguishing Web3 from legacy web systems.
Analyzing the Web3 space requires comprehensive research and understanding of complex, rapidly evolving technologies. AI-driven research platforms like Token Metrics use machine learning and data analytics to provide insights into blockchain networks, emerging protocols, and token metrics. By leveraging these tools, researchers and enthusiasts can assess technological fundamentals and ecosystem trends in a structured, data-informed manner, facilitating a clearer understanding of Web3 developments.
For those interested in exploring Web3, keeping the following factors in mind can enhance comprehension and engagement:
While Web3 promises a more decentralized and user-empowered internet, it is essential to consider practical implications. Adoption hurdles, scalability, user experience, and regulatory frameworks will shape its trajectory. Unlike Web2, which offers convenience and centralized control, Web3 emphasizes autonomy and distributed governance. The future internet may well integrate strengths from both models, providing a hybrid approach that balances user control with usability.
Web3 represents a transformative vision for the internet, aiming to decentralize control and enhance user ownership of data and digital assets. Its key distinctions from the current internet (Web2) include decentralization, trustless interactions, and new economic models. Technologies like blockchain and smart contracts drive these changes, supported by analytical tools such as Token Metrics that aid in navigating this complex environment. As Web3 continues to evolve, understanding its fundamentals remains crucial for anyone interested in the future of the internet.
This blog post is intended for educational and informational purposes only and does not constitute financial or investment advice. Readers should conduct their own research and consider their risk tolerance before engaging with Web3 technologies or cryptocurrencies.
The concept of irreversible transactions is a foundational aspect of blockchain technology and cryptocurrencies. Unlike traditional banking systems where transactions can be reversed or disputed, blockchain transactions are designed to be permanent and unalterable once confirmed. This unique feature raises an important question: why are blockchain transactions irreversible? This article delves into the fundamental principles, technological mechanisms, and security frameworks that underpin transaction irreversibility in blockchains. In addition, it highlights how analytical and AI-driven research platforms such as Token Metrics can help users better understand the underlying dynamics.
To answer why blockchain transactions are irreversible, it is essential to understand what constitutes a blockchain transaction. At its core, a blockchain is a decentralized and distributed digital ledger of transactions, grouped into blocks and linked through cryptographic hashes.
Once a transaction is included in a confirmed block, it becomes part of the immutable ledger, considered permanent and irreversible.
Immutability is the cornerstone of transaction irreversibility. Blockchain achieves immutability using cryptographic techniques and decentralized consensus.
This design ensures that once a transaction is confirmed and embedded in a block, it is computationally infeasible to modify or reverse it without consensus from the majority of the network.
Consensus algorithms play an essential role in determining when transactions are considered final and irreversible.
Network participants generally treat transactions as irreversible after a certain number of confirmations (additional blocks). This requirement reduces risks from temporary forks or reorganizations.
Reversing a blockchain transaction would entail rewriting the blockchain history, which is impeded by several technical realities:
Therefore, even accidental or malicious attempts to reverse a transaction face insurmountable obstacles.
The irreversible nature of blockchain transactions carries both benefits and risks.
Understanding these implications is critical for users engaging with blockchain-based systems, and tools like Token Metrics provide data-driven insights to enhance awareness and decision-making.
With the growing complexity of blockchain ecosystems, AI-driven platforms are increasingly valuable for dissecting transaction behaviors and network health.
Utilizing these resources supports a better grasp of the irreversible nature of transactions and the broader blockchain infrastructure.
Blockchain transaction irreversibility is rooted in the technology’s core principles of immutability, decentralization, and consensus-driven finality. These mechanisms collectively ensure that once a transaction is recorded on the blockchain and sufficiently confirmed, it cannot be altered or undone without prohibitive computational effort and majority network control. While irreversible transactions provide robust security and trustlessness, they also emphasize the importance of user diligence. Leveraging AI-powered analytical tools like Token Metrics can enhance comprehension and navigational confidence within blockchain ecosystems.
This article is intended for educational purposes only and does not constitute financial advice. Readers should conduct their own research using varied sources, including specialized platforms such as Token Metrics, before engaging with blockchain or cryptocurrency activities.

If you’re serious about trading cryptocurrency, technical analysis (TA) is an essential skill. It helps you understand price movements, predict trends, and identify high-probability entry and exit points.
But with hundreds of technical indicators available, one common question is: “Which indicators should I use for technical analysis?”
In this guide, we’ll break down the most effective indicators for crypto trading, explain how they work, and show you how Token Metrics combines them with AI-driven insights to help you trade smarter.
Unlike traditional stocks, cryptocurrency markets trade 24/7, are more volatile, and are largely driven by sentiment and speculation.
Technical indicators help you:
The key is not using one indicator in isolation but combining multiple tools for confirmation—which is exactly what Token Metrics does with its AI-driven trading signals.
Here are the must-know indicators for crypto traders:
What they do:
Moving averages smooth out price data to help you identify overall market direction.
How to use them:
Best for:
Spotting long-term trends and momentum.
What it does:
RSI measures price momentum and identifies overbought (70+) or oversold (30-) conditions.
How to use it:
Best for:
Finding reversal points and confirming trend strength.
What it does:
MACD measures the relationship between two EMAs (usually 12-day and 26-day) and generates buy/sell signals based on crossovers.
How to use it:
Best for:
Spotting trend changes early.
What they do:
Bollinger Bands create a price channel around an asset using a moving average plus/minus two standard deviations.
How to use them:
Best for:
Predicting volatility and identifying breakout opportunities.
What they do:
Volume indicators confirm price movements and help spot trend strength.
Best for:
Confirming whether a trend is supported by strong trading volume.
What it does:
Identifies key support and resistance levels based on Fibonacci ratios (23.6%, 38.2%, 50%, 61.8%, etc.).
How to use it:
Best for:
Setting targets and identifying price zones for entries/exits.
What it does:
Measures price momentum by comparing closing prices to recent price ranges.
How to use it:
Best for:
Short-term traders looking for momentum shifts.
What it does:
Provides a complete view of trend, momentum, and support/resistance levels in one indicator.
How to use it:
Best for:
Swing traders who need multi-factor confirmation in one tool.
Instead of manually tracking dozens of indicators, Token Metrics uses AI to analyze 80+ technical, fundamental, and sentiment-based data points for each asset—giving you actionable insights without the guesswork.
Here’s how:
Our system combines RSI, MACD, MAs, and more to generate real-time buy/sell signals.
Token Metrics tracks emerging narratives (AI tokens, DeFi, etc.) so you can spot trends before they explode.
Don’t want to analyze charts? Our AI-driven indices automatically rebalance portfolios using technical indicators and market conditions.
The most successful traders don’t rely on one indicator. Instead, they combine them for confirmation.
Example:
When multiple indicators align, your trade has a higher probability of success—and Token Metrics does this automatically.
So, what indicators should you use for technical analysis?
Start with moving averages, RSI, MACD, Bollinger Bands, and Fibonacci levels—then add volume indicators and advanced tools like the Ichimoku Cloud as you gain experience.
But here’s the truth: indicators are only as good as the trader using them. That’s why Token Metrics simplifies the process by combining dozens of technical indicators with AI-powered analysis, giving you clear, actionable insights for smarter trades.
Whether you’re a day trader or a long-term investor, Token Metrics helps you use technical indicators strategically—not emotionally.
Cryptocurrency is a form of digital or virtual currency that uses cryptography for security, making it difficult to counterfeit or double-spend. Unlike traditional currencies issued by governments and central banks, cryptocurrencies operate on decentralized networks based on blockchain technology. This decentralization allows for peer-to-peer transactions without intermediaries such as banks.
The concept emerged with the introduction of Bitcoin in 2009, which paved the way for numerous other cryptocurrencies designed to serve various purposes within digital ecosystems.
At the core of cryptocurrencies lies blockchain, a distributed ledger that records all transactions across a network of computers (nodes). Each transaction is grouped into a block, which is then cryptographically linked to the previous block, forming a chain.
This technology underpins various cryptocurrencies and offers applications beyond currency, including smart contracts and decentralized applications (dApps).
When a user initiates a cryptocurrency transaction, it is broadcast to the network of nodes. These nodes verify the transaction’s validity through consensus mechanisms such as Proof of Work (PoW) or Proof of Stake (PoS).
Users store cryptocurrencies in digital wallets protected by private keys, which are critical for accessing and authorizing transactions.
The cryptocurrency landscape is diverse, including:
Understanding these distinctions is essential for analyzing different crypto projects and their use cases.
Due to the complexity and rapid evolution of the crypto space, thorough research is essential. Key approaches include:
Benefits:
Challenges:
The introduction of AI-driven research tools has transformed how individuals dissect the vast and complex cryptocurrency markets. Platforms like Token Metrics employ machine learning and natural language processing techniques to analyze various data streams including market sentiment, on-chain metrics, and project fundamentals.
These tools provide:
Users can complement traditional research methods with AI insights to foster a balanced understanding.
Cryptocurrency represents a revolutionary shift in digital finance, enabled by blockchain technology and supported increasingly by AI analytics. Understanding its fundamentals, technology, and associated risks is essential for meaningful engagement.
This article is for educational purposes only and does not constitute financial advice. Readers should conduct independent research and consult professionals before making decisions related to cryptocurrencies.

Cryptocurrency trading can be exciting and profitable, but one thing many traders overlook is taxation. Whether you’re buying Bitcoin, trading altcoins, or earning staking rewards, your activities can create taxable events—and failure to report them properly can lead to hefty penalties.
If you’ve been wondering, “How do taxes work for crypto trading?”, this guide breaks it all down. We’ll explain how crypto taxes work, the most common taxable events, and how Token Metrics can help you make smarter, tax-conscious trading decisions.
Yes. In most countries, cryptocurrencies are treated as property, not currency, for tax purposes. This means:
While tax laws vary by country, the principle is the same: any gain or income from crypto is subject to taxation.
To manage your taxes effectively, you need to know what counts as a taxable event.
If you sell Bitcoin, Ethereum, or any other crypto for fiat currency, you must report capital gains or losses.
Example:
Swapping one crypto for another (e.g., BTC → ETH) is also a taxable event.
Why?
Using crypto to buy a car, laptop, or coffee? That’s a taxable event too.
Example:
DeFi activities like yield farming, lending, or NFT trading may also trigger complex taxable events depending on jurisdiction.
When you sell crypto, your profit is classified as a capital gain—either short-term or long-term.
Pro Tip: Holding crypto for at least a year can significantly lower your tax burden.
Record:
Your cost basis is how much you paid for the asset (including fees).
Subtract your cost basis from the selling price:
Report staking, mining, and airdrop rewards as ordinary income at their market value when received.
Staying compliant doesn’t just mean reporting correctly—it means trading smartly to reduce your tax burden. That’s where Token Metrics can help.
Track all your crypto holdings across exchanges and wallets, making tax reporting easier.
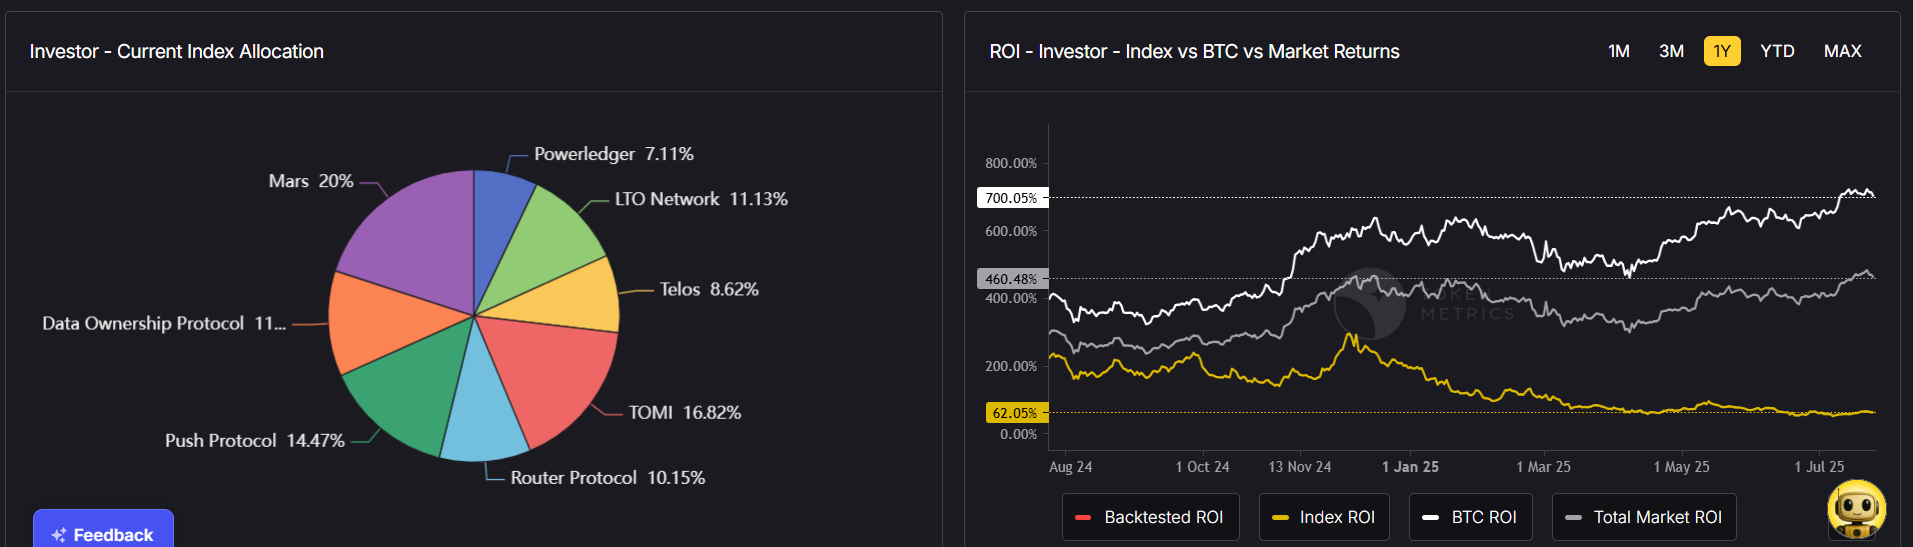
Use Investor Grades to identify cryptos worth holding long-term, reducing your tax liability on gains.
Get AI-powered trading signals to make smarter decisions on when to sell—balancing profits and taxes.
Spot emerging narratives (AI tokens, DeFi trends) early, allowing you to plan tax-friendly entries and exits.
Tax treatment varies by country:
Always consult a crypto tax professional for advice in your jurisdiction.
Let’s say you:
With Token Metrics, you could track purchase dates and AI signals to time your exit strategically—potentially saving on taxes.
So, how do taxes work for crypto trading?
The key to staying compliant and minimizing taxes is tracking transactions, planning trades strategically, and using the right tools.
That’s where Token Metrics helps. With AI-driven portfolio tracking, tax-efficient trading insights, and market analytics, Token Metrics empowers you to trade smarter, reduce taxable events, and keep more of your profits.
Don’t just trade crypto—trade tax-smart.
When you trade cryptocurrency, you’ll come across different types of orders—market orders and limit orders being the two most common. Understanding how they work is essential for controlling your entry and exit points, minimizing slippage, and making better trading decisions.
If you’ve ever wondered, “What’s the difference between limit orders and market orders?”, you’re in the right place. This guide will break it down in detail, explain when to use each, and show how Token Metrics helps you execute smarter trades with AI-powered insights.
A market order is the simplest type of trade. It tells an exchange:
“Buy or sell this cryptocurrency at the best available price right now.”
Example:
If Bitcoin is trading at $40,000 and you place a market order for 1 BTC, you may end up paying $40,050 if the price moves up in the milliseconds it takes to execute your trade.
A limit order gives you more control. It tells an exchange:
“Buy or sell this cryptocurrency at this specific price (or better).”
Example:
If Bitcoin is trading at $40,000, you could set a buy limit order at $39,500. If the price dips to that level, your order fills. If it doesn’t, you won’t buy.
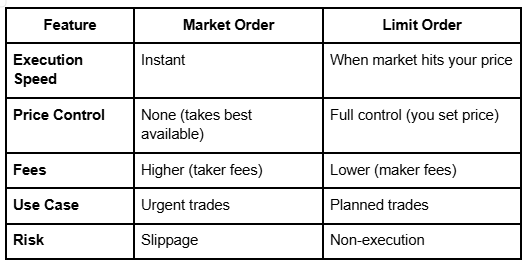
Market orders are best when:
Limit orders are best when:
Placing orders is one thing—placing them at the right time is what makes you profitable. That’s where Token Metrics helps.
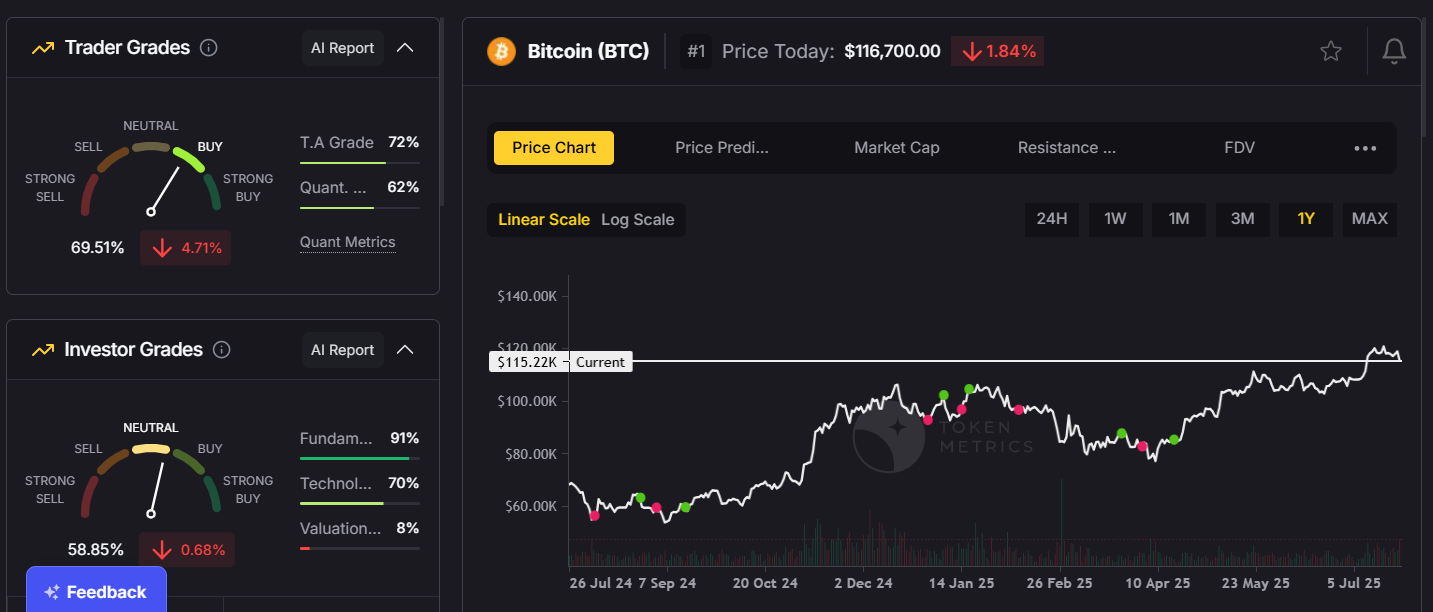
Get real-time bullish and bearish alerts based on 80+ technical indicators, helping you know when to execute market or limit orders for maximum efficiency.
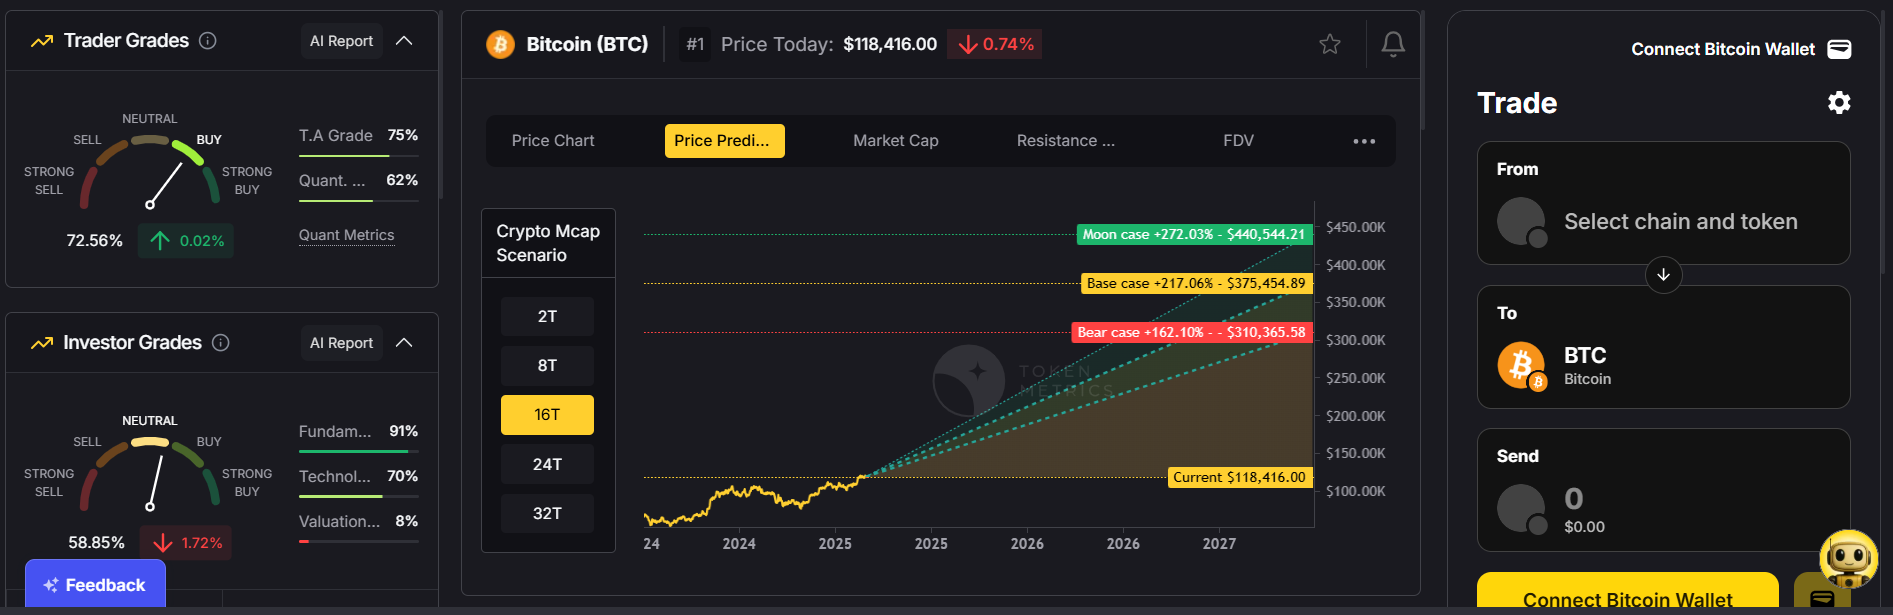
Use Trader Grades for short-term trading opportunities (perfect for market orders) and Investor Grades for long-term accumulation (ideal for limit orders).
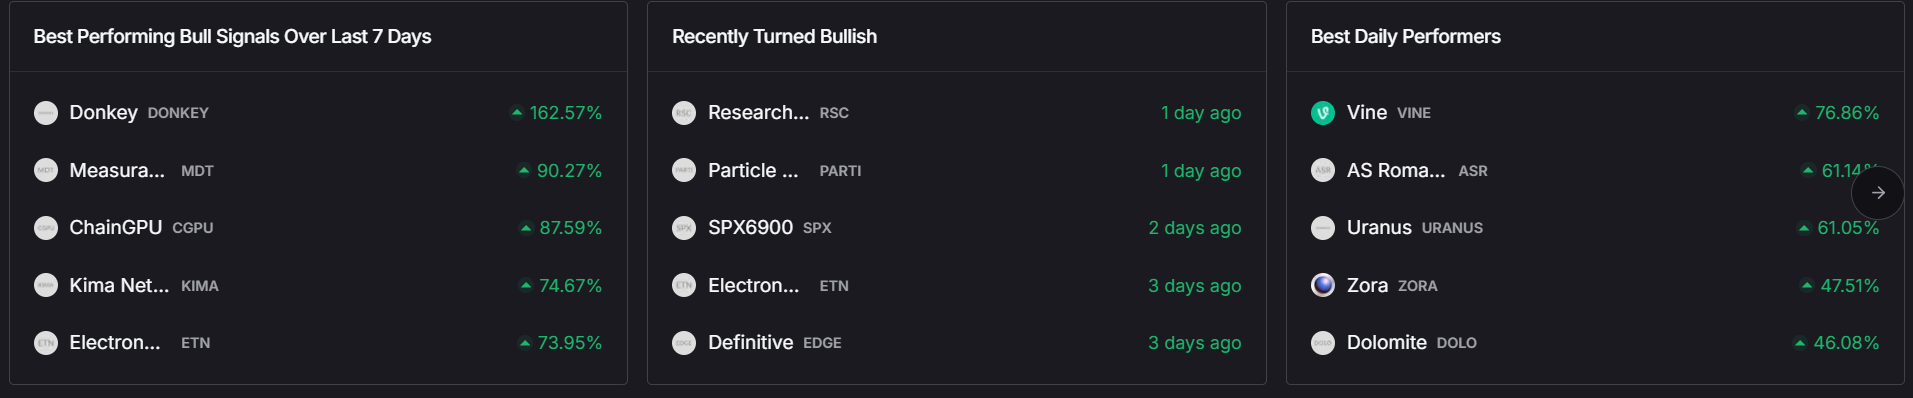
Our AI identifies emerging narratives—like AI tokens or DeFi plays—so you can strategically place limit orders before trends take off.
Don’t want to place manual orders? Token Metrics’ AI-managed portfolios automatically rebalance based on market conditions, helping you avoid constant order management.
Imagine you’re trading Ethereum (ETH):
This combination allows you to enter fast and exit smart—with less emotional stress.
So, what’s the difference between limit orders and market orders?
The key is knowing when to use each—and using data-driven insights to make those decisions.
That’s where Token Metrics gives you an edge. With AI-powered trading signals, narrative tracking, and automated portfolio tools, Token Metrics helps you decide when to use market vs. limit orders, so you can trade confidently and profitably.
In crypto trading, timing is everything—and Token Metrics makes timing smarter.
Cryptocurrency trading can be highly profitable—but it’s also one of the riskiest markets in the world. Prices can swing wildly in seconds, projects can collapse overnight, and emotional decisions often lead to costly mistakes.
If you want to survive (and thrive) in crypto trading, you must learn how to manage risk effectively. In this guide, we’ll break down why risk management is critical, the top strategies to protect your capital, and how Token Metrics can help you trade smarter, safer, and with more confidence using AI-driven insights.
In traditional markets, a 5% price movement is big news. In crypto? Daily moves of 10–20% are normal.
Without a solid risk management plan, even experienced traders can lose everything.
This is rule number one.
Don’t put all your funds into one token.
How Token Metrics Helps:
Use AI-driven indices to build a diversified, auto-rebalanced portfolio aligned with your risk tolerance.
Set stop-loss levels to automatically sell if prices fall below a certain threshold.
Pro Tip: Place stops at strategic support levels, not random round numbers.
Don’t go “all-in” on one trade.
Leverage amplifies gains—but also losses.
Fear, greed, and FOMO (fear of missing out) destroy portfolios.
How Token Metrics Helps:
Our AI-powered bullish and bearish signals take emotions out of trading by giving you data-backed entry and exit points.
Markets move on news—regulations, partnerships, or even tweets.
How Token Metrics Helps:
Our AI tracks emerging narratives (e.g., AI tokens, DeFi, RWAs), so you can adjust positions before the crowd reacts.
Before entering a trade, ask:
Risk management isn’t just about trades—it’s also about keeping your crypto safe.
Markets evolve—your plan should too.
Token Metrics isn’t just a research platform—it’s an AI-powered risk management assistant.
Get real-time bullish and bearish signals to time entries and exits more effectively—reducing impulsive trades.
Quickly assess tokens for short-term trading potential (Trader Grade) or long-term viability (Investor Grade)—helping you avoid high-risk projects.
Use auto-rebalanced AI indices to maintain diversification and reduce risk exposure.
Interested in high-risk, high-reward tokens? Our Moonshot Finder filters low-cap projects using AI, helping you avoid scams and rug pulls.
Our AI tracks emerging narratives so you can anticipate market movements early—reducing exposure to collapsing trends.
Imagine you want to invest $5,000 in crypto:
This is how data-driven trading transforms risk into opportunity.
So, how do you manage risk in crypto trading? It’s about balancing your portfolio, using smart tools, and staying disciplined.
While volatility is unavoidable, you can control how much you’re exposed to it. With Token Metrics, you gain AI-powered insights, trade signals, and portfolio tools that help you reduce risks while maximizing opportunities.
In crypto, it’s not just about making profits—it’s about keeping them.


 Create Your Free Account
9450 SW Gemini Dr
PMB 59348
Beaverton, Oregon 97008-7105 US
.svg)


.png)
Token Metrics Media LLC is a regular publication of information, analysis, and commentary focused especially on blockchain technology and business, cryptocurrency, blockchain-based tokens, market trends, and trading strategies.
Token Metrics Media LLC does not provide individually tailored investment advice and does not take a subscriber’s or anyone’s personal circumstances into consideration when discussing investments; nor is Token Metrics Advisers LLC registered as an investment adviser or broker-dealer in any jurisdiction.
Information contained herein is not an offer or solicitation to buy, hold, or sell any security. The Token Metrics team has advised and invested in many blockchain companies. A complete list of their advisory roles and current holdings can be viewed here: https://tokenmetrics.com/disclosures.html/
Token Metrics Media LLC relies on information from various sources believed to be reliable, including clients and third parties, but cannot guarantee the accuracy and completeness of that information. Additionally, Token Metrics Media LLC does not provide tax advice, and investors are encouraged to consult with their personal tax advisors.
All investing involves risk, including the possible loss of money you invest, and past performance does not guarantee future performance. Ratings and price predictions are provided for informational and illustrative purposes, and may not reflect actual future performance.


%20Price%20Prediction%20.webp)


