


%20Price%20Prediction%20.webp)


.png)


.png)
.png)


.png)


.png)
%201%20(1).png)

.png)


.png)


.png)
.png)


.png)


.png)

.png)
.png)
.png)
.png)
.png)
.png)
.png)
.png)
.png)


.png)


.png)

.png)
.png)


.png)


.png)
.png)
.png)
.png)

.png)
.png)


Research
Top Crypto Trading Platforms in 2025
When it comes to crypto trading platforms, Token Metrics is not an exchange, but a crypto analytics and crypto trading intelligence platform powered by AI.
Token Metrics Team
10 min


%201.svg)
%201.svg)
Big news: We’re cranking up the heat on AI-driven crypto analytics with the launch of the Token Metrics API and our official SDK (Software Development Kit). This isn’t just an upgrade – it's a quantum leap, giving traders, hedge funds, developers, and institutions direct access to cutting-edge market intelligence, trading signals, and predictive analytics.
Crypto markets move fast, and having real-time, AI-powered insights can be the difference between catching the next big trend or getting left behind. Until now, traders and quants have been wrestling with scattered data, delayed reporting, and a lack of truly predictive analytics. Not anymore.
The Token Metrics API delivers 32+ high-performance endpoints packed with powerful AI-driven insights right into your lap, including:
Getting started with the Token Metrics API is simple:
At Token Metrics, we believe data should be decentralized, predictive, and actionable.
The Token Metrics API & SDK bring next-gen AI-powered crypto intelligence to anyone looking to trade smarter, build better, and stay ahead of the curve. With our official SDK, developers can plug these insights into their own trading bots, dashboards, and research tools – no need to reinvent the wheel.
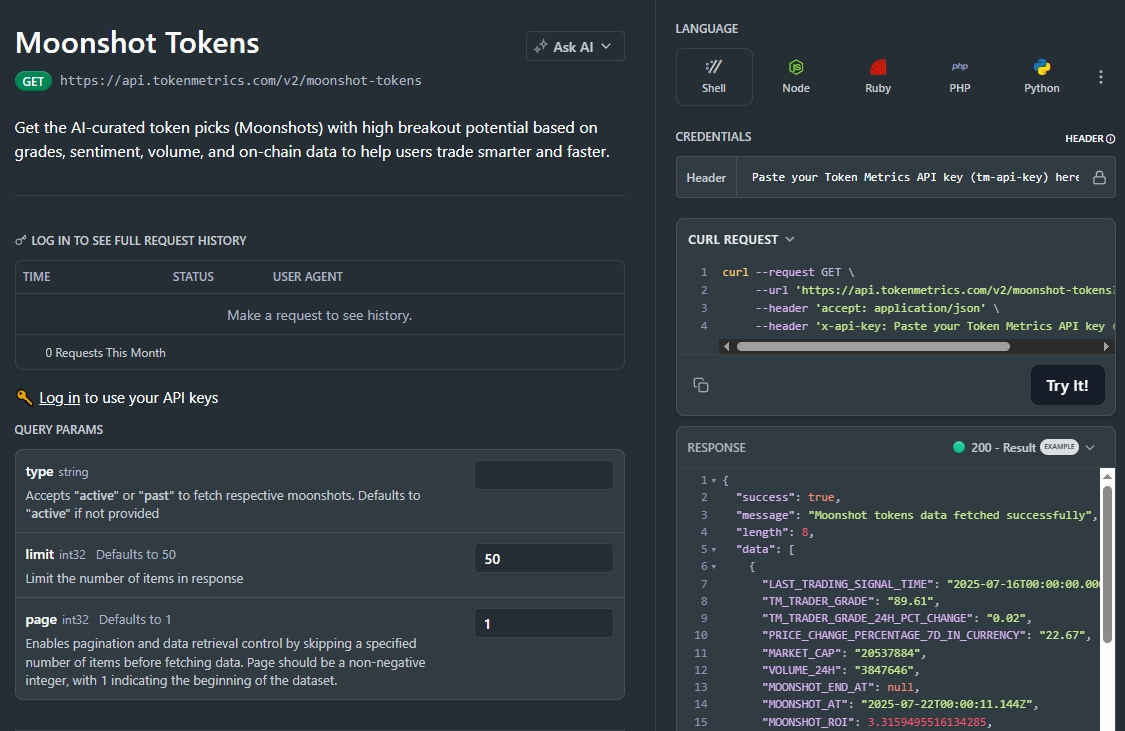
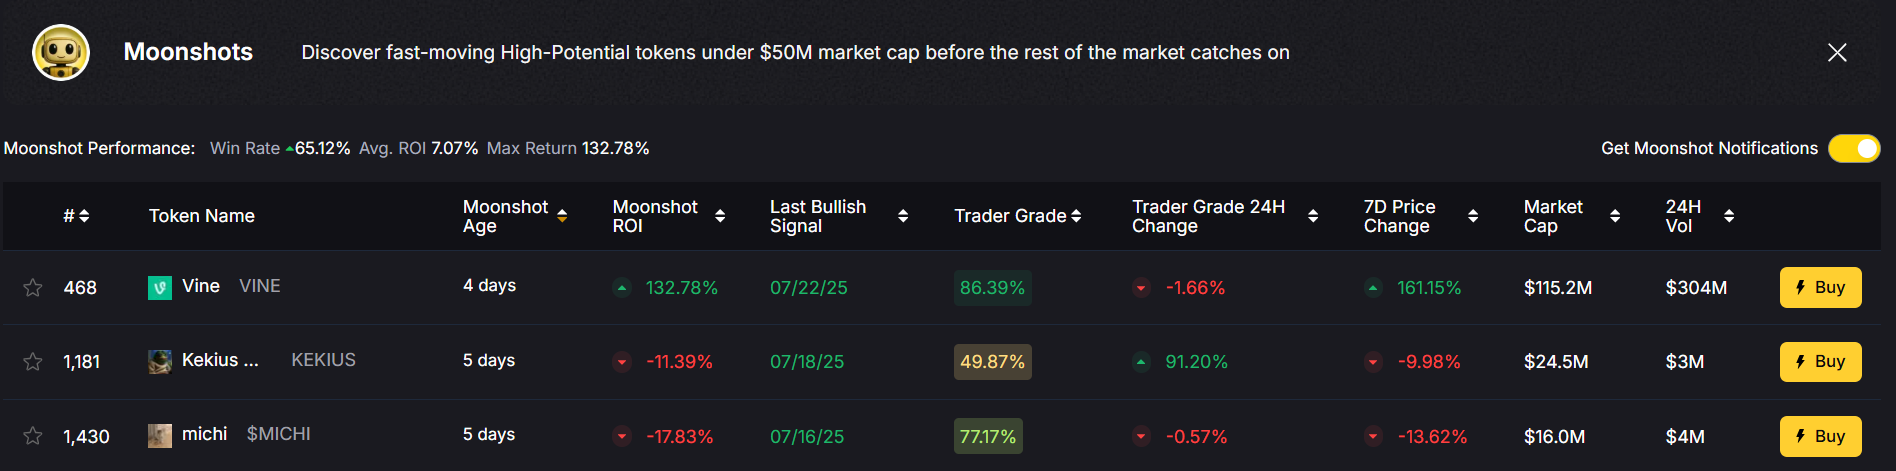
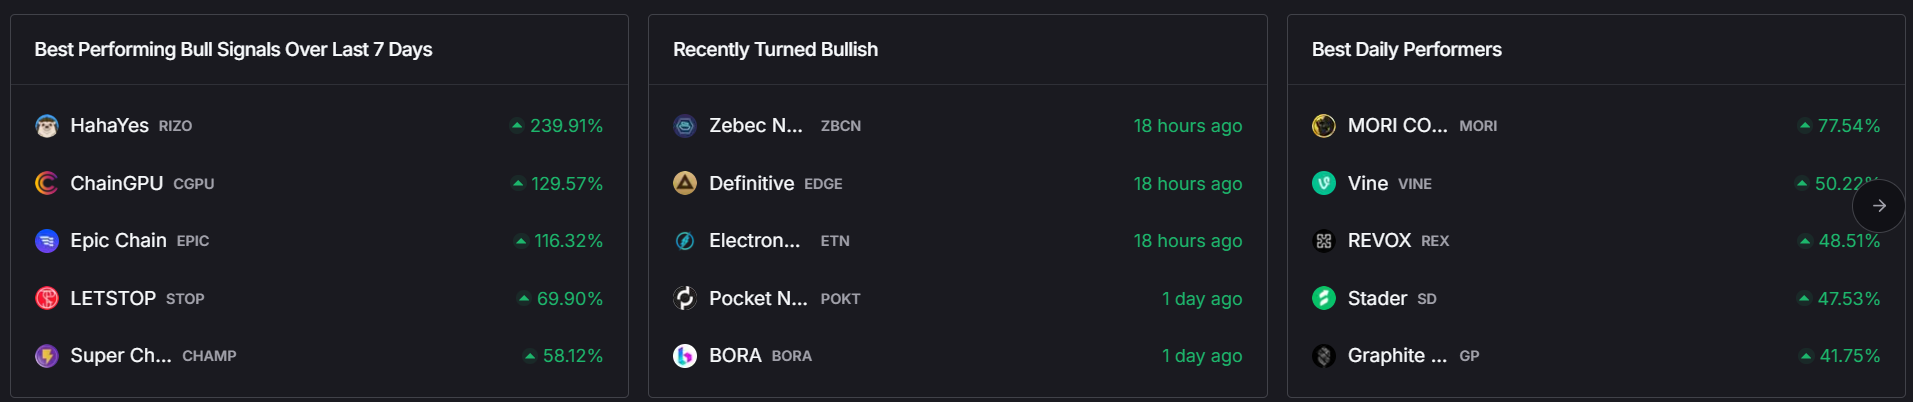
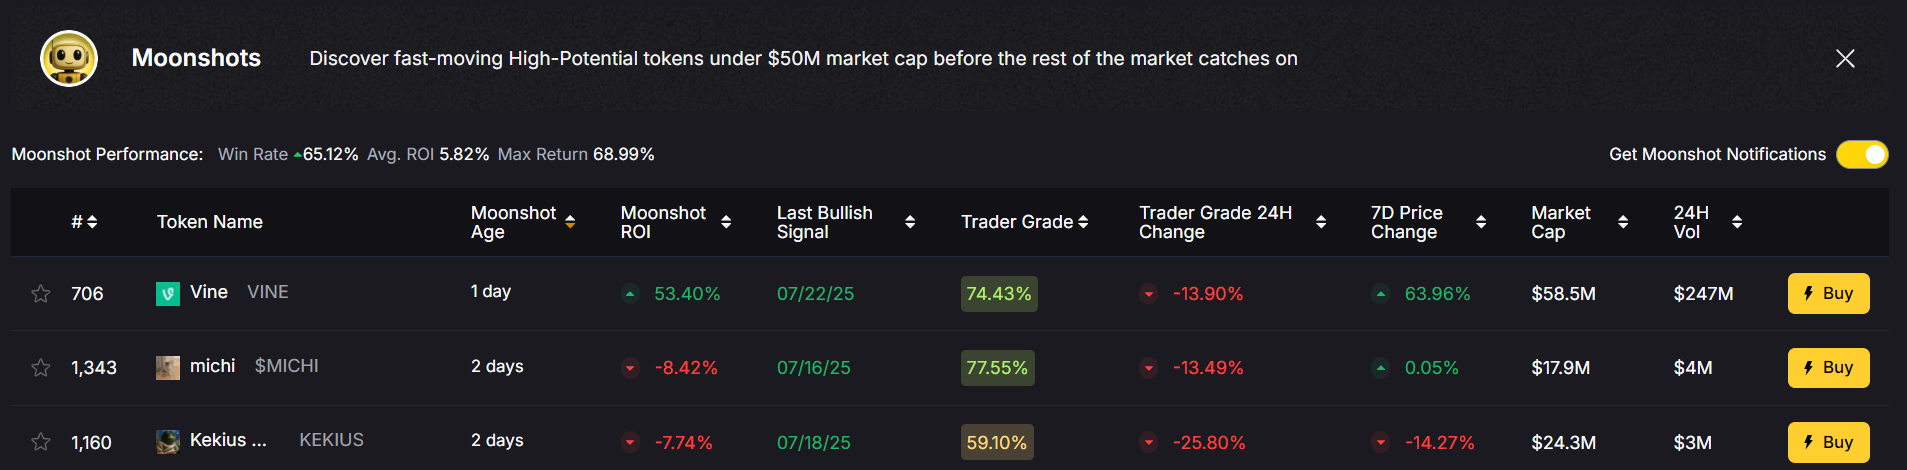
The biggest gains in crypto rarely come from the majors. They come from Moonshots—fast-moving tokens with breakout potential. The Moonshots API surfaces these candidates programmatically so you can rank, alert, and act inside your product. In this guide, you’ll call /v2/moonshots, display a high-signal list with TM Grade and Bullish tags, and wire it into bots, dashboards, or screeners in minutes. Start by grabbing your key at Get API Key, then Run Hello-TM and Clone a Template to ship fast.
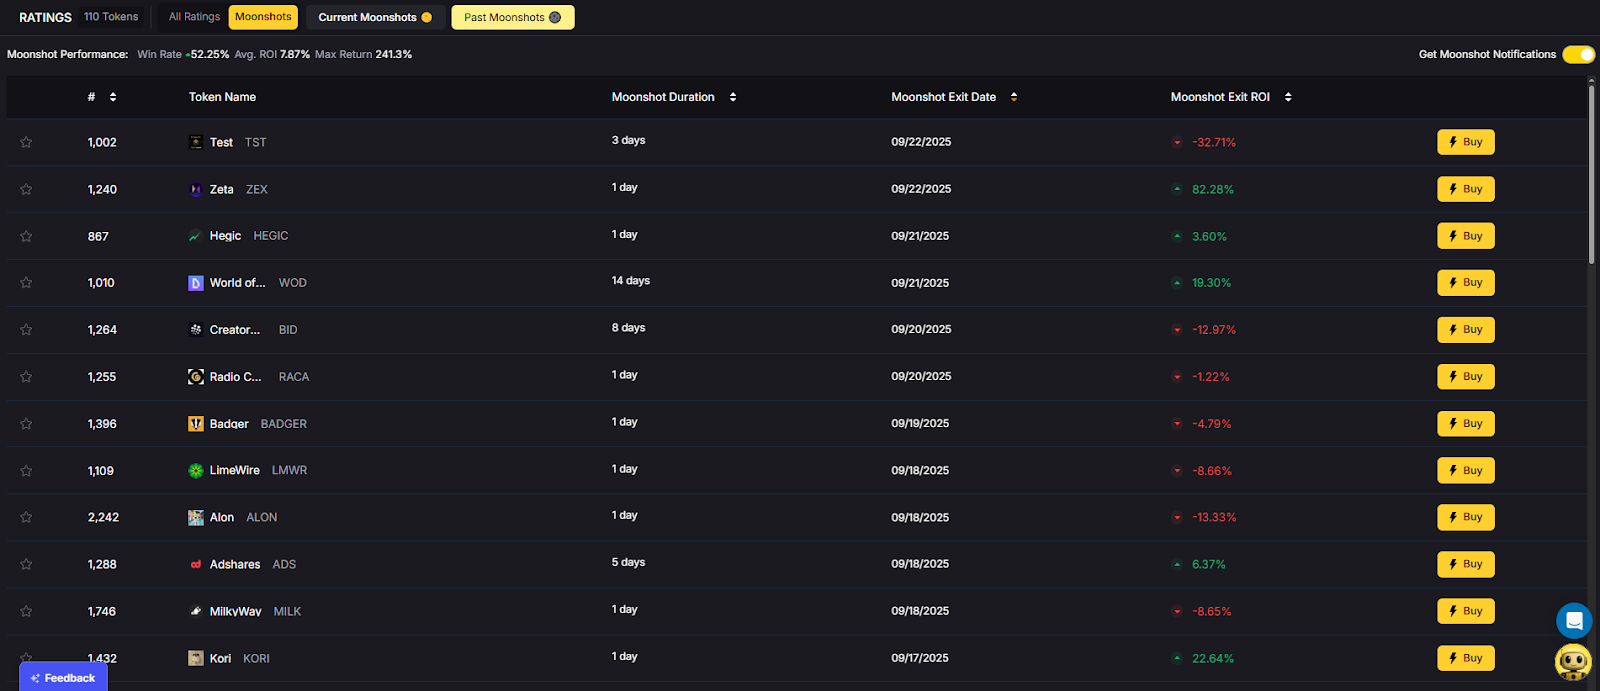
Discovery that converts. Users want more than price tickers—they want a curated, explainable list of high-potential tokens. The moonshots API encapsulates multiple signals into a short list designed for exploration, alerts, and watchlists you can monetize.
Built for builders. The endpoint returns a consistent schema with grade, signal, and context so you can immediately sort, badge, and trigger workflows. With predictable latency and clear filters, you can scale to dashboards, mobile apps, and headless bots without reinventing the discovery pipeline.
The Moonshots API cURL request is right there in the top right of the API Reference. Grab it and start tapping into the potential!
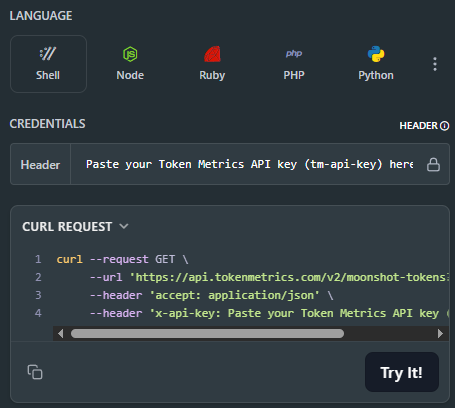
👉 Keep momentum: Get API Key • Run Hello-TM • Clone a Template
Fork a screener or alerting template, plug your key, and deploy. Validate your environment with Hello-TM. When you scale users or need higher limits, compare API plans.
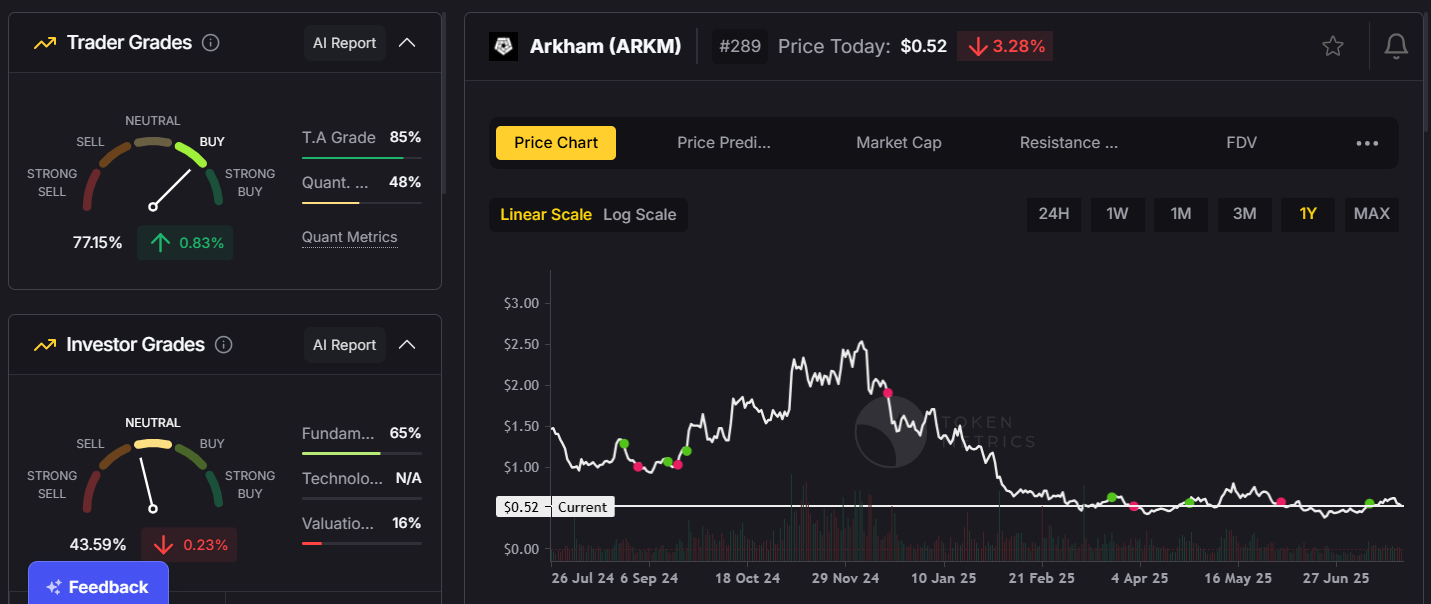
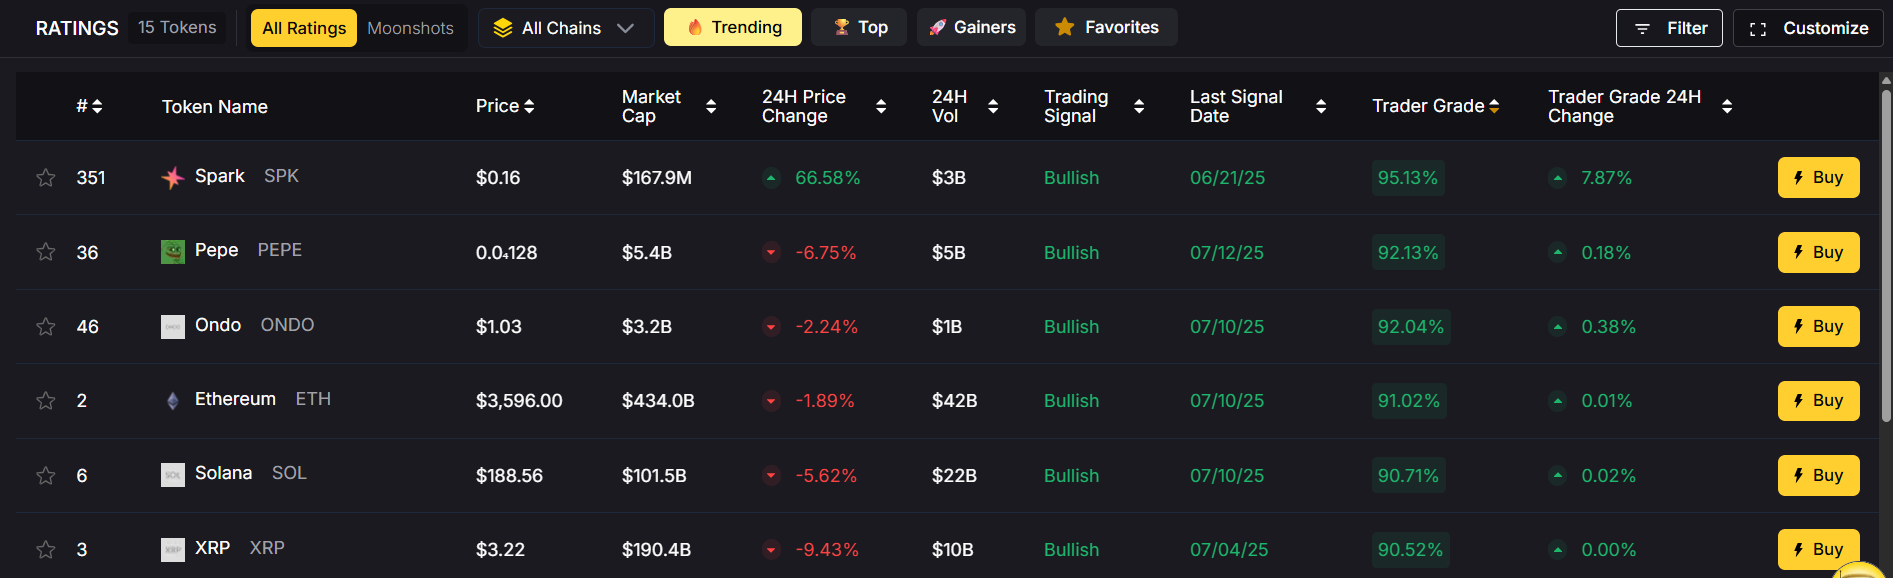
The Moonshots endpoint aggregates a set of evidence—often combining TM Grade, signal state, and momentum/volume context—into a shortlist of breakout candidates. Each row includes a symbol, grade, signal, and timestamp, plus optional reason tags for transparency.
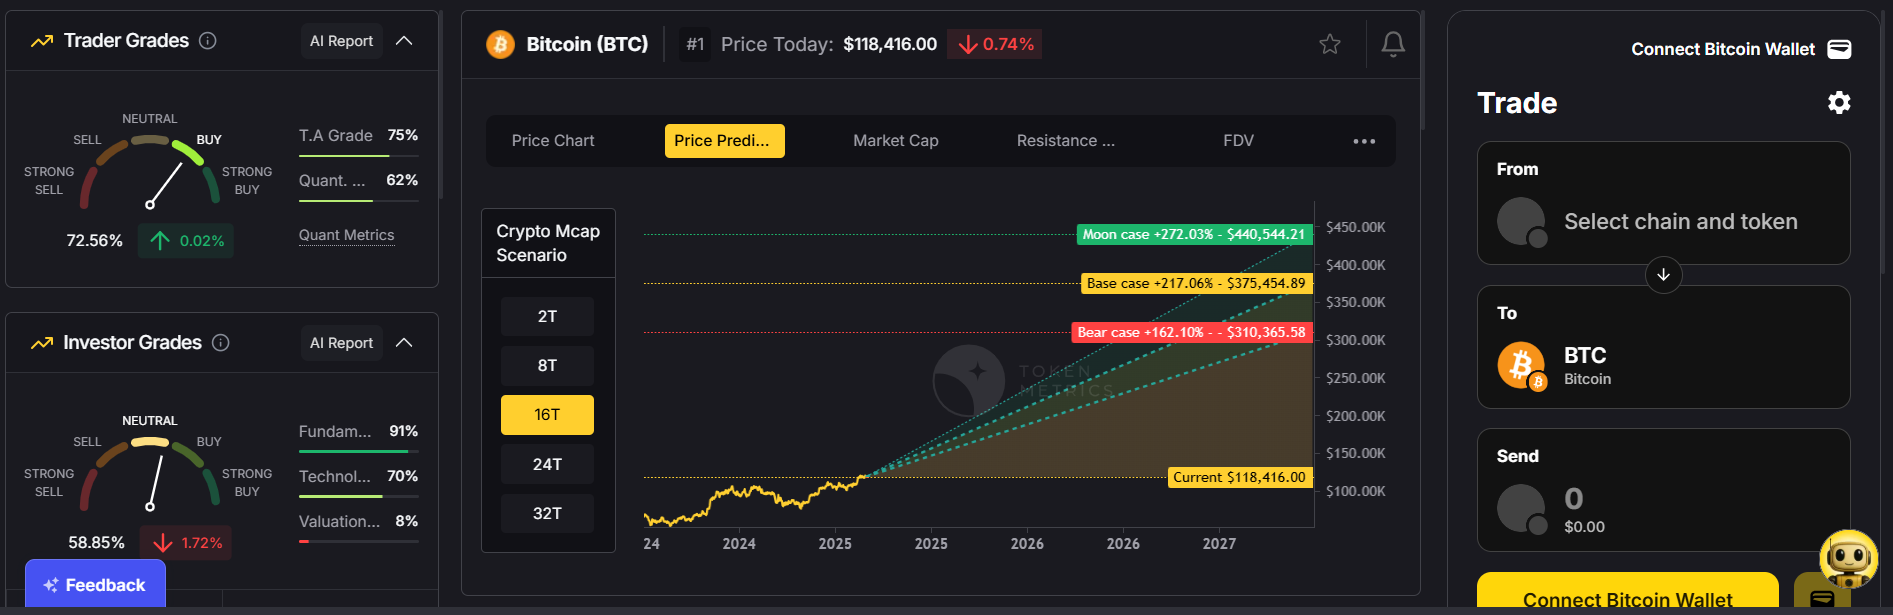
For UX, a common pattern is: headline list → token detail where you render TM Grade (quality), Trading Signals (timing), Support/Resistance (risk placement), Quantmetrics (risk-adjusted performance), and Price Prediction scenarios. This lets users understand why a token was flagged and how to act with risk controls.
Polling vs webhooks. Dashboards typically poll with short-TTL caching. Alerting flows use scheduled jobs or webhooks (where available) to smooth traffic and avoid duplicates. Always make notifications idempotent.
1) What does the Moonshots API return?
A list of breakout candidates with fields such as symbol, tm_grade, signal (often Bullish/Bearish), optional reason tags, and updated_at. Use it to drive discover tabs, alerts, and watchlists.
2) How fresh is the list? What about latency/SLOs?
The endpoint targets predictable latency and timely updates for dashboards and alerts. Use short-TTL caching and queued jobs/webhooks to avoid bursty polling.
3) How do I use Moonshots in a trading workflow?
Common stack: Moonshots for discovery, Trading Signals for timing, Support/Resistance for SL/TP, Quantmetrics for sizing, and Price Prediction for scenario context. Always backtest and paper-trade first.
4) I saw results like “+241%” and a “7.5% average return.” Are these guaranteed?
No. Any historical results are illustrative and not guarantees of future performance. Markets are risky; use risk management and testing.
5) Can I filter the Moonshots list?
Yes—pass parameters like min_grade, signal, and limit (as supported) to tailor to your audience and keep pages fast.
6) Do you provide SDKs or examples?
REST works with JavaScript and Python snippets above. Docs include quickstarts, Postman collections, and templates—start with Run Hello-TM.
7) Pricing, limits, and enterprise SLAs?
Begin free and scale up. See API plans for rate limits and enterprise options.
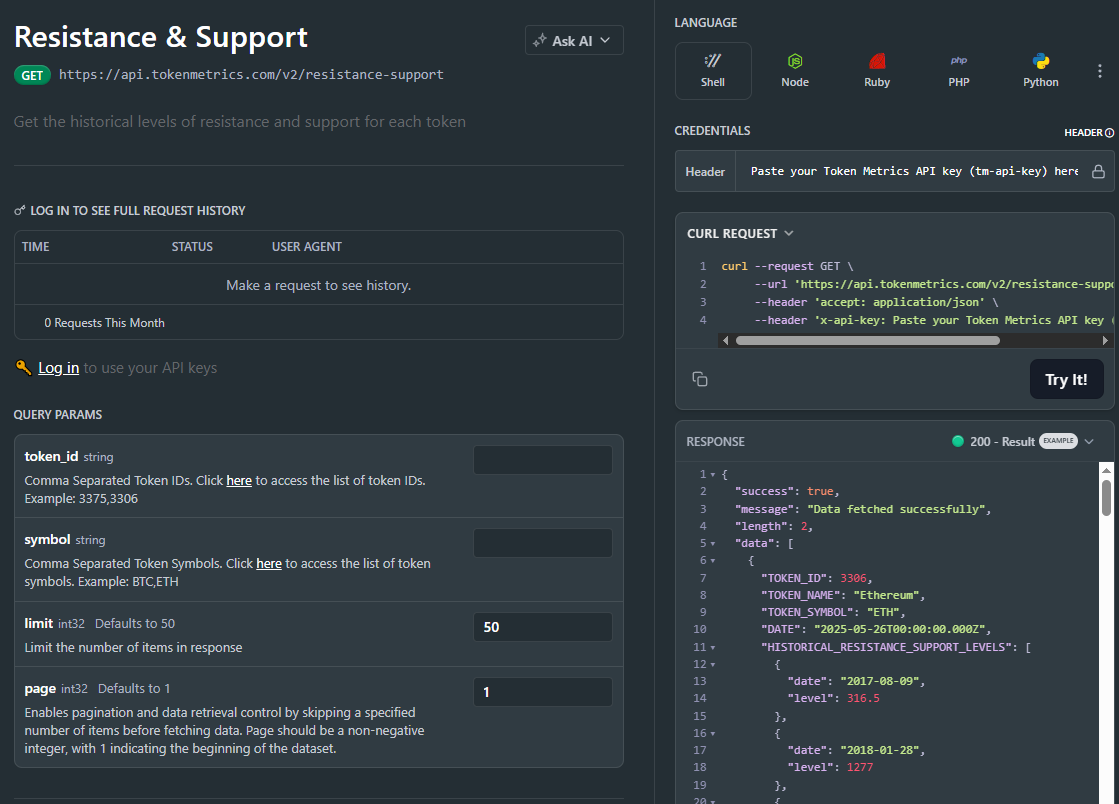
Most traders still draw lines by hand in TradingView. The support and resistance API from Token Metrics auto-calculates clean support and resistance levels from one request, so your dashboard, bot, or alerts can react instantly. In minutes, you’ll call /v2/resistance-support, render actionable levels for any token, and wire them into stops, targets, or notifications. Start by grabbing your key on Get API Key, then Run Hello-TM and Clone a Template to ship a production-ready feature fast.
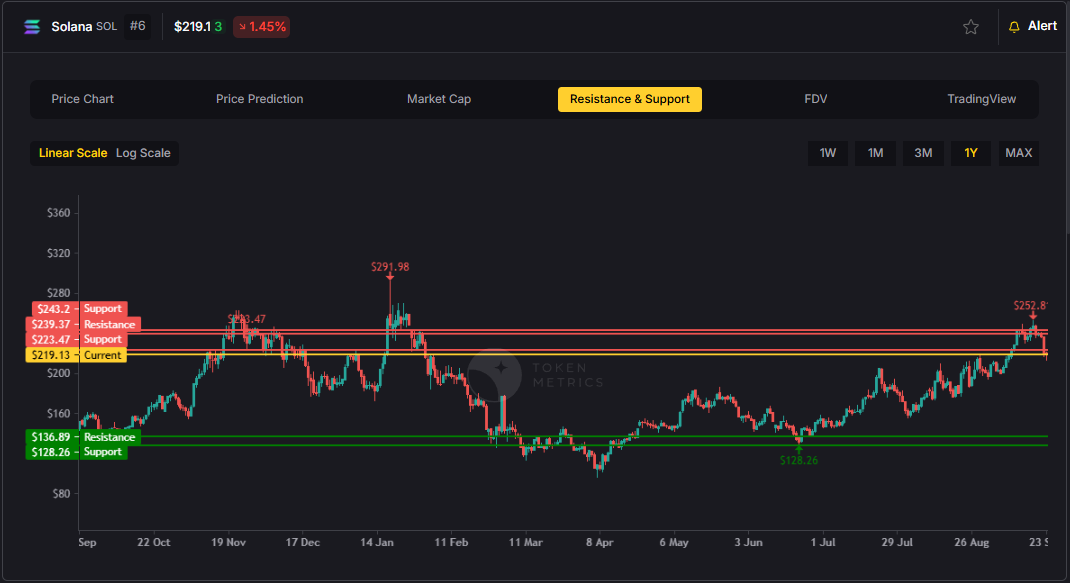
Precision beats guesswork. Hand-drawn lines are subjective and slow. The support and resistance API standardizes levels across assets and timeframes, enabling deterministic stops and take-profits your users (and bots) can trust.
Production-ready by design. A simple REST shape, predictable latency, and clear semantics let you add levels to token pages, automate SL/TP alerts, and build rule-based execution with minimal glue code.
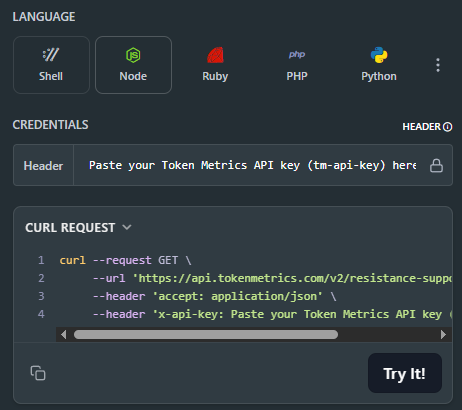
Need the Support and Resistance data? The cURL request for it is in the top right of the API Reference for quick access.
👉 Keep momentum: Get API Key • Run Hello-TM • Clone a Template
Kick off with our quickstarts—fork a bot or dashboard template, plug your key, and deploy. Confirm your environment by Running Hello-TM. When you’re scaling or need webhooks/limits, review API plans.
The Support/Resistance endpoint analyzes recent price structure to produce discrete levels above and below current price, along with strength indicators you can use for priority and styling. Query /v2/resistance-support?symbol=<ASSET>&timeframe=<HORIZON> to receive arrays of level objects and timestamps.
Polling vs webhooks. For dashboards, short-TTL caching and batched fetches keep pages snappy. For bots and alerts, use queued jobs or webhooks (where applicable) to avoid noisy, bursty polling—especially around market opens and major events.
1) What does the Support & Resistance API return?
A JSON payload with arrays of support and resistance levels for a symbol (and optional timeframe), each with a price and strength indicator, plus an update timestamp.
2) How timely are the levels? What are the latency/SLOs?
The endpoint targets predictable latency suitable for dashboards and alerts. Use short-TTL caching for UIs, and queued jobs or webhooks for alerting to smooth traffic.
3) How do I trigger alerts or trades from levels?
Common patterns: alert when price is within X% of a level, touches a level, or breaks beyond with confirmation. Always make downstream actions idempotent and respect rate limits.
4) Can I combine levels with other endpoints?
Yes—pair with /v2/trading-signals for timing, /v2/tm-grade for quality context, and /v2/quantmetrics for risk sizing. This yields a complete decide-plan-execute loop.
5) Which timeframe should I use?
Intraday bots prefer shorter horizons; swing/position dashboards use daily or higher-timeframe levels. Offer a timeframe toggle and cache results per setting.
6) Do you provide SDKs or examples?
Use the REST snippets above (JS/Python). The docs include quickstarts, Postman collections, and templates—start with Run Hello-TM.
7) Pricing, limits, and enterprise SLAs?
Begin free and scale as you grow. See API plans for rate limits and enterprise SLA options.
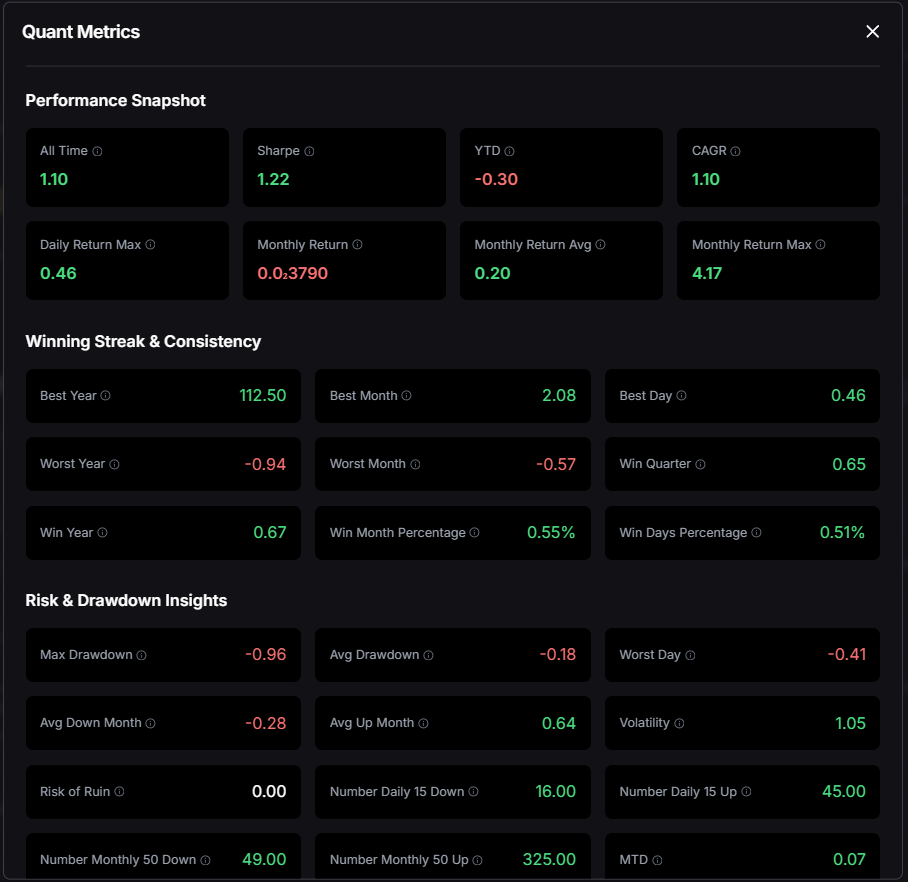
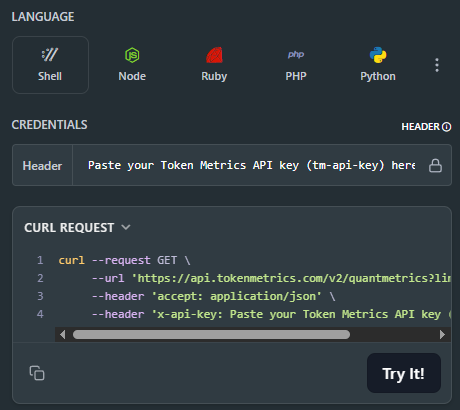
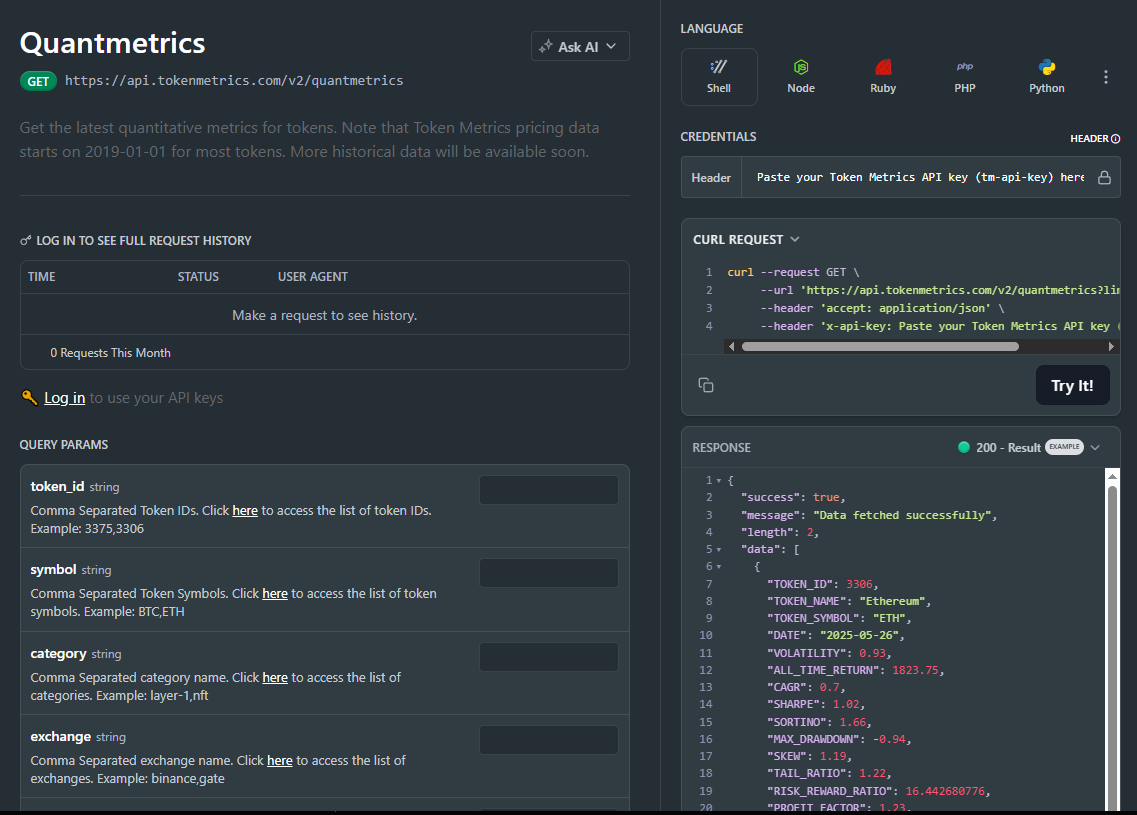
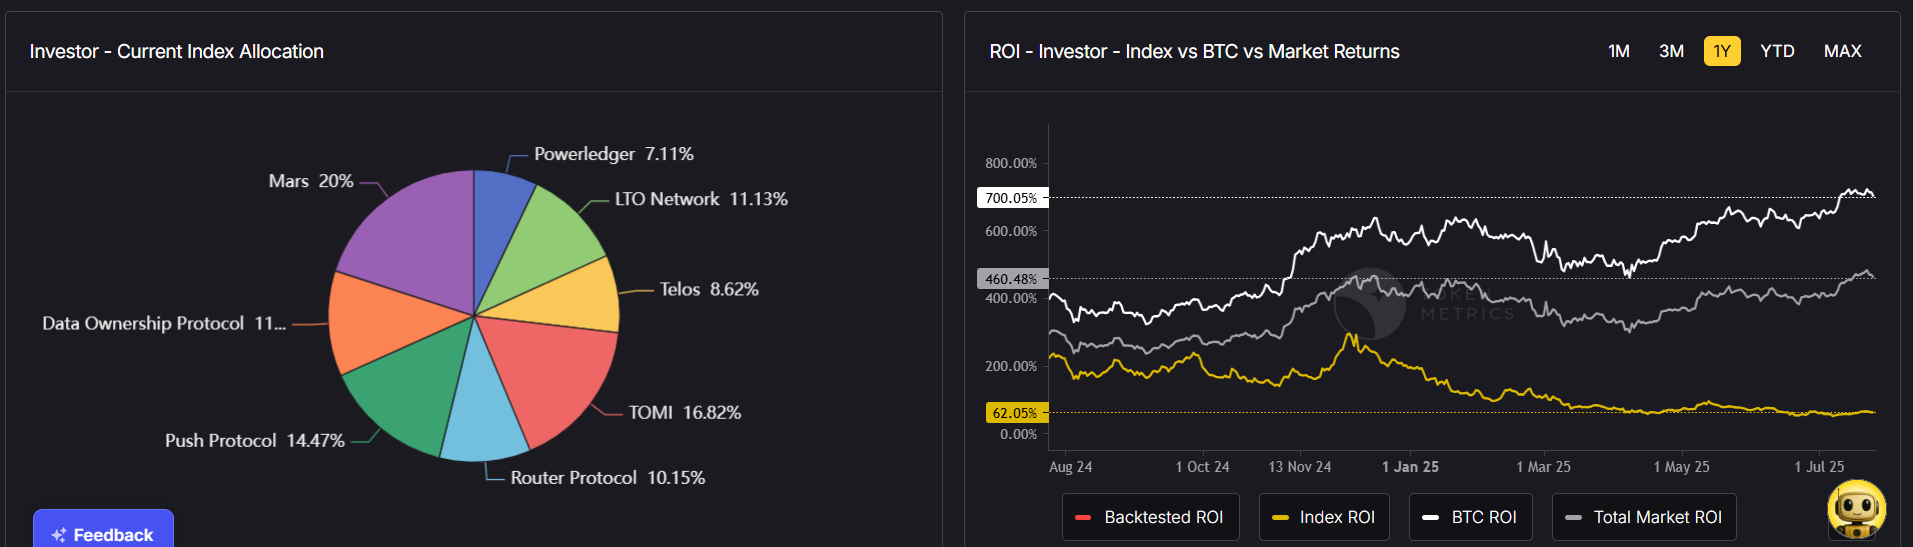
Most traders see price—quants see probabilities. The Quantmetrics API turns raw performance into risk-adjusted stats like Sharpe, Sortino, volatility, drawdown, and CAGR so you can compare tokens objectively and build smarter bots and dashboards. In minutes, you’ll query /v2/quantmetrics, render a clear performance snapshot, and ship a feature that customers trust. Start by grabbing your key at Get API Key, Run Hello-TM to verify your first call, then Clone a Template to go live fast.
Risk-adjusted truth beats hype. Price alone hides tail risk and whipsaws. Quantmetrics compresses edge, risk, and consistency into metrics that travel across assets and timeframes—so you can rank universes, size positions, and communicate performance like a pro.
Built for dev speed. A clean REST schema, predictable latency, and easy auth mean you can plug Sharpe/Sortino into bots, dashboards, and screeners without maintaining your own analytics pipeline. Pair with caching and batching to serve fast pages at scale.
The Quant Metrics cURL request is located in the top right of the API Reference, allowing you to easily integrate it with your application.
👉 Keep momentum: Get API Key • Run Hello-TM • Clone a Template
Kick off from quickstarts in the docs—fork a dashboard or screener template, plug your key, and deploy in minutes. Validate your environment with Run Hello-TM; when you need more throughput or webhooks, compare API plans.
Quantmetrics computes risk-adjusted performance over a chosen lookback (e.g., 30d, 90d, 1y). You’ll receive a JSON snapshot with core statistics:
Call /v2/quantmetrics?symbol=<ASSET>&window=<LOOKBACK> to fetch the current snapshot. For dashboards spanning many tokens, batch symbols and apply short-TTL caching. If you generate alerts (e.g., “Sharpe crossed 1.5”), run a scheduled job and queue notifications to avoid bursty polling.
1) What does the Quantmetrics API return?
A JSON snapshot of risk-adjusted metrics (e.g., Sharpe, Sortino, volatility, max drawdown, CAGR) for a symbol and lookback window—ideal for ranking, sizing, and dashboards.
2) How fresh are the stats? What about latency/SLOs?
Responses are engineered for predictable latency. For heavy UI usage, add short-TTL caching and batch requests; for alerts, use scheduled jobs or webhooks where available.
3) Can I use Quantmetrics to size positions in a live bot?
Yes—many quants size inversely to volatility or require Sharpe ≥ X to trade. Always backtest and paper-trade before going live; past results are illustrative, not guarantees.
4) Which lookback window should I choose?
Short windows (30–90d) adapt faster but are noisier; longer windows (6–12m) are steadier but slower to react. Offer users a toggle and cache each window.
5) Do you provide SDKs or examples?
REST is straightforward (JS/Python above). Docs include quickstarts, Postman collections, and templates—start with Run Hello-TM.
6) Polling vs webhooks for quant alerts?
Dashboards usually use cached polling. For threshold alerts (e.g., Sharpe crosses 1.0), run scheduled jobs and queue notifications to keep usage smooth and idempotent.
7) Pricing, limits, and enterprise SLAs?
Begin free and scale up. See API plans for rate limits and enterprise SLA options.
Cryptocurrency trading is a 24/7 market—unlike stocks, there’s no opening or closing bell. This leads many traders to wonder: “When is the best time to trade cryptocurrency?”
The truth is, timing your trades can make a huge difference in profitability. Trading during periods of high liquidity or increased volatility can provide better opportunities, while poorly timed trades can lead to slippage and losses.
In this guide, we’ll explore the best times to trade crypto, how different time zones affect price movements, and how Token Metrics can help you identify the right moments to enter or exit trades using AI-powered insights.
Even though the crypto market never sleeps, trading activity is not equal throughout the day.
Knowing when the market is most active can help you reduce trading fees, minimize slippage, and maximize your gains.
The busiest period for crypto trading is when U.S. and European sessions overlap.
This overlap often sees the biggest price movements of the day—perfect for day traders and scalpers.
The start of the U.S. session brings increased activity from institutional investors and retail traders waking up to market news.
Crypto is unique because weekend trading can be extremely volatile due to:
The “best time” isn’t always about the clock—it’s about market catalysts.
These events can cause instant surges or drops—great for traders who react quickly.
Yes. Research shows:
For swing traders, entering positions midweek may reduce erratic weekend exposure.
Timing trades isn’t just about watching charts—it’s about analyzing multiple data points in real time. That’s where Token Metrics gives you a powerful edge.
Get real-time bullish and bearish alerts based on 80+ data points, helping you know when to enter or exit trades confidently.
Our AI monitors emerging crypto narratives (AI tokens, DeFi, RWA, etc.) so you can act before the crowd—crucial for timing market moves.
Use Trader Grades for short-term opportunities and Investor Grades for long-term positions, aligning your trades with market momentum.
Don’t want to time trades manually? Token Metrics offers auto-managed crypto indices that rebalance based on AI-identified market conditions.
Imagine you’re planning to trade Ethereum. Instead of guessing when to enter:
This data-driven approach takes the guesswork out of timing.
So, what’s the best time to trade cryptocurrency?
But the truth is, there’s no universal “perfect time.” The real key is using data-driven insights to trade at your best time—when probabilities are in your favor.
That’s why Token Metrics is essential for traders. With AI-powered trading signals, narrative tracking, and portfolio management tools, Token Metrics helps you time the market intelligently, not emotionally.
Whether you’re a day trader chasing volatility or a long-term investor, Token Metrics puts the right data at your fingertips—so you can trade with confidence, anytime.
The cryptocurrency market has created life-changing wealth for millions, but it has also attracted hackers, scammers, and bad actors. From exchange hacks to phishing scams and rug pulls, billions of dollars in crypto have been lost due to poor security practices.
If you’re serious about trading or investing in crypto, one of your top priorities should be keeping your cryptocurrency safe. In this guide, we’ll walk through the biggest risks to your crypto security, best practices to protect your assets, and how Token Metrics can help you make informed, safe decisions when navigating the crypto market.
Unlike a traditional bank account, cryptocurrency transactions are irreversible. If your funds are stolen, there’s usually no way to recover them.
This means you are your own bank—and you’re responsible for protecting your funds.
Before learning how to protect your crypto, you need to know what you’re up against:
Crypto exchanges are frequent targets for hackers. Even top-tier exchanges like Mt. Gox and FTX have experienced devastating losses.
Scammers use fake websites, emails, or social media accounts to trick you into revealing your private keys or login credentials.
Cybercriminals install malicious software on your devices to steal passwords and seed phrases.
Fraudulent projects lure investors with promises of high returns, then disappear with the funds.
Lost passwords, mishandled private keys, or accidental transfers can lead to permanent loss of funds.
Here’s a step-by-step approach to safeguarding your crypto:
Pro Tip: Use a hardware wallet for long-term holdings and a software wallet for small, active trading balances.
Always enable 2FA on your exchange accounts, wallets, and email addresses.
Your wallet’s seed phrase is the master key to your funds.
Many scams and rug pulls target uninformed investors chasing hype.
How Token Metrics Helps:
Don’t keep all your crypto in one place.
The crypto landscape changes fast.
While Token Metrics isn’t a wallet or exchange, it’s a powerful AI-powered platform designed to help you make safer investment decisions.
Token Metrics uses AI-driven evaluations to score projects, helping you avoid high-risk tokens and scam projects.
Our proprietary grading system helps you quickly identify safe, high-quality assets for both short-term trading and long-term holding.
Interested in low-cap tokens? The Moonshot Finder helps you spot legitimate early-stage projects before they pump—without falling into scams.
Stay ahead of emerging narratives and security concerns with Token Metrics’ real-time AI-driven analysis, helping you dodge risky trends.
So, how do you keep your cryptocurrency safe? It comes down to strong storage practices, personal vigilance, and making informed investment decisions.
While hardware wallets and 2FA secure your assets, knowing where to invest is just as important. That’s where Token Metrics comes in—using AI-powered analysis to help you avoid scams, choose safe projects, and trade with confidence.
In crypto, you are your own bank—so take your security seriously. And with Token Metrics guiding your decisions, you can navigate this high-risk market safely and profitably.
If you’ve ever bought or sold cryptocurrency, you’ve likely noticed that exchanges charge trading fees. While these fees may seem small at first glance, they can add up significantly over time, especially for frequent traders.
Understanding how trading fees work is essential for maximizing your profits and choosing the right platform and strategy. In this guide, we’ll explain what trading fees are, how they’re calculated, the different types of fees, and how Token Metrics can help you minimize costs while optimizing your trades.
Trading fees are charges imposed by cryptocurrency exchanges whenever you execute a trade—whether you’re buying, selling, or swapping digital assets.
Example:
If you buy $1,000 worth of Bitcoin with a 0.1% trading fee, you’ll pay $1 in fees for that transaction.
Most crypto exchanges calculate fees based on:
Many exchanges use a maker-taker model to incentivize liquidity:
Example:
On Binance, makers might pay 0.08%, while takers pay 0.1%.
When trading crypto, you’ll encounter more than just trading fees:
Even small fees can significantly impact your profits, especially if you trade often.
Example:
This is why reducing fees is crucial for active traders.
Compare platforms—Binance, Bybit, and Kraken often offer competitive rates for high-volume traders.
Many exchanges lower fees as your monthly trading volume increases.
Save on fees by acting as a maker instead of a taker whenever possible.
Some exchanges offer discounts when fees are paid with their native token (e.g., BNB on Binance).
Instead of making dozens of small trades, use data-driven insights from Token Metrics to make high-probability trades—reducing overall fee impact.
Token Metrics isn’t an exchange—it’s an AI-powered crypto research and trading platform designed to maximize your profits.
Here’s how it helps with trading fees:
Token Metrics provides bullish/bearish trading signals based on 80+ technical indicators, helping you enter fewer but higher-quality trades—minimizing unnecessary fees.
Our proprietary grading system helps you identify top-performing cryptos, reducing guesswork and avoiding costly trial-and-error trading.
Instead of manually rebalancing portfolios (and paying multiple trading fees), use Token Metrics AI-driven crypto indices, which rebalance intelligently while keeping transaction costs low.
Our AI detects emerging crypto narratives early, helping you position yourself before the market gets crowded—reducing the need for excessive short-term trading.
Imagine you’re trading altcoins manually and make 20 trades/month.
This is how data-driven trading saves both money and stress.
So, what are trading fees and how do they work? They’re the charges exchanges take for facilitating trades, withdrawals, and transactions—and while they may seem small, they can eat into your profits quickly.
The good news? You can minimize trading fees with the right strategies—and Token Metrics can help.
By providing AI-powered trading signals, long-term Investor Grades, and automated crypto indices, Token Metrics helps you reduce unnecessary trades, make smarter decisions, and maximize your returns—all while minimizing the impact of trading fees.
Whether you’re a beginner or advanced trader, using Token Metrics means trading smarter, not harder.
Leverage trading has become a hot topic in the crypto world. Many traders are attracted by the promise of amplified profits—but fail to realize it also magnifies losses. If you’ve been wondering, “Should I use leverage when trading crypto?” the short answer is: only if you fully understand the risks and have a solid strategy.
In this guide, we’ll break down what leverage trading is, how it works, its pros and cons, and how AI-powered tools like Token Metrics can help you make smarter decisions when trading with leverage.
Leverage trading lets you borrow funds from an exchange to increase your position size, allowing you to control more capital than you actually own.
For example:
Popular platforms like Binance, Bybit, and OKX offer leverage levels from 2x to 125x for certain assets.
Leverage isn’t all bad. When used responsibly, it offers several benefits:
Even small price movements can generate significant returns when using leverage.
Traders can free up capital for other positions while maintaining large exposure in a leveraged trade.
Leverage allows for short selling, enabling you to profit when prices go down.
The same factors that make leverage attractive also make it high-risk:
Just as leverage magnifies profits, it magnifies losses. A minor price drop could liquidate your entire position.
When your collateral falls below a certain threshold, the exchange automatically closes your position, locking in your losses.
Leverage trading is fast-paced and stressful, often leading to panic selling or revenge trading after losses.
No.
If you’re new to trading, avoid leverage until you have:
For beginners, leveraged trading can be a fast track to losing your capital.
For experienced traders, leverage can make sense when:
Leverage trading requires precision, and that’s where Token Metrics gives you an edge.
Identify high-probability trades with real-time AI signals based on 80+ technical indicators. This helps you avoid entering positions blindly.
Use Trader Grades for short-term trading opportunities and Investor Grades for long-term positions—helping you decide when to scale up or reduce leverage.
Token Metrics evaluates crypto projects and market trends to reduce exposure to high-risk assets—a must for leveraged positions.
Don’t want to trade manually? Use our AI-managed crypto indices to gain diversified exposure without taking unnecessary leveraged risks.
Our AI identifies emerging narratives before they hit mainstream attention, giving you a strategic edge in timing trades—crucial when using leverage.
If you decide to use leverage, follow these rules:
Many traders lose money by overleveraging, which leads to:
Pro Tip: Only trade with leverage on funds you can afford to lose.
So, should you use leverage when trading crypto?
For beginners, the answer is no—focus on mastering spot trading first. For experienced traders, leverage can be a powerful tool when used with strict risk management and data-driven insights.
That’s where Token Metrics makes a difference. With AI-powered trading signals, real-time risk analysis, and narrative tracking, Token Metrics helps you trade smarter, reduce emotional mistakes, and optimize your leverage strategy.
Leverage can make you or break you—so don’t go in blind. Use Token Metrics to guide your trades and stay ahead of the market.
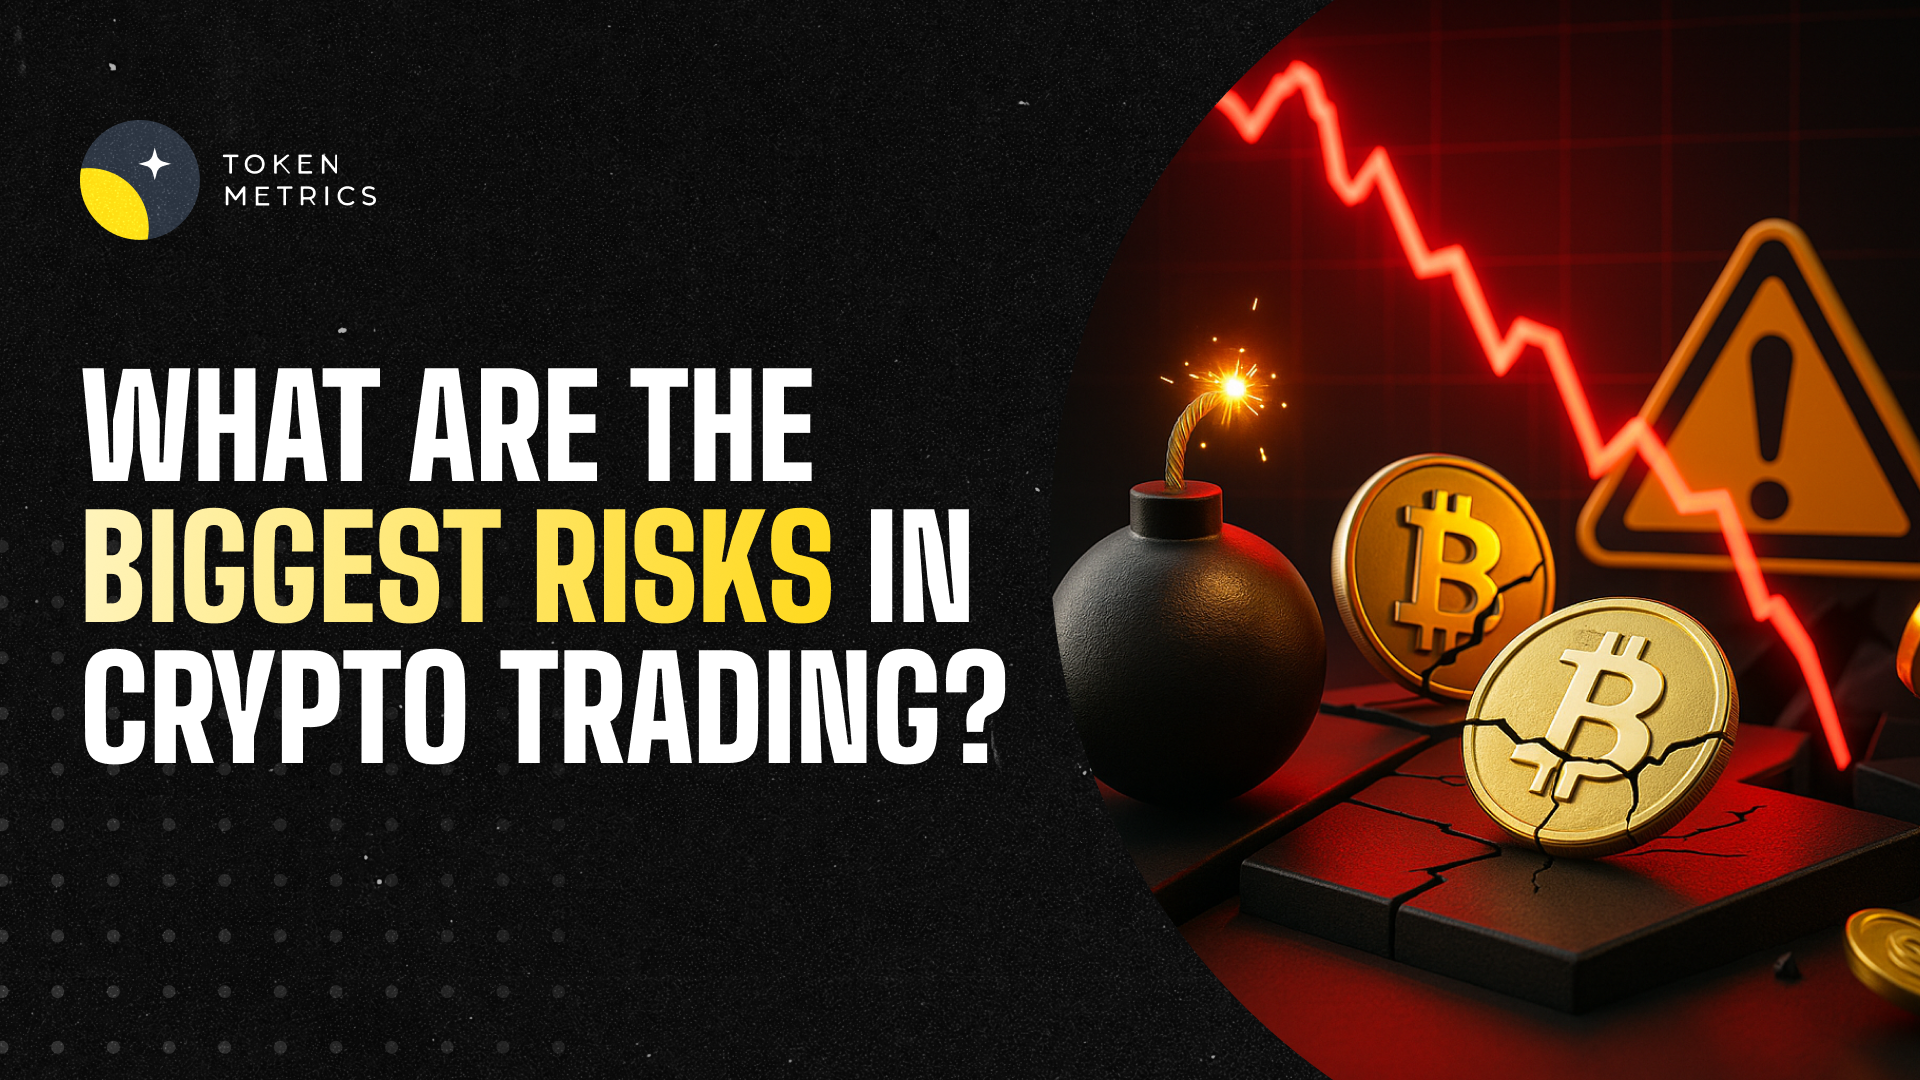
Cryptocurrency trading can be highly rewarding, but it’s also one of the riskiest financial activities you can engage in. Prices can swing wildly within minutes, markets are largely unregulated, and scams remain rampant. Whether you’re a beginner investor or a seasoned trader, understanding these risks is critical for protecting your capital and making informed decisions.
In this guide, we’ll break down the biggest risks in crypto trading, how to recognize them, and how Token Metrics can help you minimize those risks using AI-driven insights.
The crypto market is famous for its rapid price fluctuations. Unlike traditional stocks, which typically move in small percentages daily, cryptocurrencies can experience 10–50% swings in a single day.
How Token Metrics Helps:
Token Metrics provides AI-powered trading signals and market trend analysis to help you avoid trading blindly. Our Trader Grades let you know when an asset is trending bullish or bearish, giving you data-driven entry and exit points.
Unlike traditional finance, cryptocurrency operates in a largely unregulated space. This creates both opportunities and risks.
How Token Metrics Helps:
We track regulatory trends and narratives using AI-driven sentiment analysis, alerting you to shifts that could impact your holdings.
Crypto traders often store their assets on exchanges or hot wallets—prime targets for hackers.
How Token Metrics Helps:
Token Metrics evaluates crypto projects with AI-based risk scoring, helping you avoid tokens and platforms with poor security practices or suspicious activity.
From rug pulls to fake ICOs and Ponzi schemes, crypto has become a hotbed for scams targeting inexperienced traders.
How Token Metrics Helps:
Our Moonshot Finder doesn’t just find hidden gem tokens—it uses AI-driven vetting to filter out high-risk projects, helping you spot potential scams before you invest.
The fear of missing out (FOMO) and panic selling are two of the biggest psychological pitfalls in crypto trading.
How Token Metrics Helps:
By offering objective, AI-driven market insights, Token Metrics removes the emotional bias from trading. Our data-backed signals tell you when to hold, sell, or accumulate—reducing emotionally driven mistakes.
Some cryptocurrencies—especially low-cap altcoins—have low liquidity, making it difficult to buy or sell without significantly impacting the price.
How Token Metrics Helps:
Our platform tracks liquidity metrics for thousands of tokens, ensuring you know the trading conditions before entering or exiting a position.
While leverage trading can amplify profits, it can also wipe out your portfolio quickly.
How Token Metrics Helps:
Token Metrics identifies high-probability trades using AI-based technical analysis, reducing the guesswork in leveraged trading.
Crypto prices are often driven by hype, social media trends, and narratives, which can be unpredictable and short-lived.
How Token Metrics Helps:
Our AI detects emerging narratives early—whether it’s AI tokens, DeFi, or RWA projects—so you can position yourself before the hype cycle peaks.
Here are some best practices for reducing crypto trading risks:
Token Metrics is more than a research platform—it’s your AI-powered trading assistant. Here’s why traders trust it:
Whether you’re a beginner looking to avoid common pitfalls or an advanced trader seeking data-driven edge, Token Metrics helps you trade smarter and safer.
So, what are the biggest risks in crypto trading? From extreme volatility and scams to emotional decision-making and security threats, the dangers are real. But with the right strategies and tools, you can navigate the market with confidence.
By using Token Metrics’ AI-powered insights, you can reduce emotional bias, avoid high-risk tokens, and make smarter, data-driven trades—turning crypto’s volatility from a threat into an opportunity.

Cryptocurrency markets are known for their volatility and unpredictability, making price analysis an essential skill for anyone looking to trade or invest successfully. Whether you’re a beginner trying to understand Bitcoin’s price swings or an advanced trader looking for early opportunities in altcoins, knowing how to analyze crypto prices can make or break your portfolio.
In this guide, we’ll break down the main methods for analyzing cryptocurrency prices, explain the key tools you need, and show you why Token Metrics is the best AI-powered platform for making smarter, data-driven trading decisions.
Unlike traditional stocks, cryptocurrencies are influenced by a unique combination of factors:
With prices moving 10–20% in a single day, traders and investors need a clear strategy to separate noise from actionable insights. That’s where price analysis comes in.
To effectively analyze crypto prices, you need to combine three primary approaches:
Technical analysis focuses on historical price data, patterns, and indicators to forecast future price movements.
Key Tools & Indicators:
How Token Metrics Helps:
Token Metrics enhances traditional TA by incorporating AI-driven market signals. Our system analyzes 80+ technical indicators across thousands of assets to deliver real-time bullish or bearish signals, helping traders know when to enter or exit positions.
Fundamental analysis evaluates the intrinsic value of a cryptocurrency by examining factors beyond price.
Key Metrics:
How Token Metrics Helps:
Token Metrics uses Investor Grades to assess cryptocurrencies based on their long-term growth potential. This AI-powered scoring system combines project fundamentals, tokenomics, and on-chain data to help investors focus on projects with real staying power.
The crypto market is heavily influenced by emotions, hype, and narratives. Sentiment analysis involves monitoring social media trends, news coverage, and community discussions to gauge overall market mood.
Key Sentiment Indicators:
How Token Metrics Helps:
Our platform goes beyond surface-level sentiment analysis by using AI to detect narrative-driven opportunities before they hit the mainstream. This is especially useful for finding Moonshot tokens—low-cap projects with high potential for explosive growth.
The most successful traders don’t rely on just one method—they combine technical, fundamental, and sentiment analysis to form a complete market picture.
Here’s how you can use this in practice:
With thousands of cryptocurrencies in the market, manual analysis is nearly impossible. Token Metrics simplifies and supercharges your analysis using AI.
Here’s what makes it the best platform for crypto price analysis:
Get real-time bullish and bearish signals based on 80+ data points per asset—helping you make quick, informed decisions.
Our scoring system helps you find short-term trading opportunities (Trader Grade) and long-term investment picks (Investor Grade).
Discover low-cap hidden gems before they gain mainstream attention—ideal for high-risk, high-reward plays.
Don’t want to analyze every token? Token Metrics offers AI-managed portfolios that automatically rebalance based on market conditions.
So, how do you analyze cryptocurrency prices? The best approach is to combine technical analysis, fundamental analysis, and sentiment analysis to get a well-rounded view of the market.
But doing this manually is overwhelming—which is why Token Metrics is the best AI-powered solution for crypto analysis. By blending real-time data, AI-driven insights, and actionable trading signals, Token Metrics helps you trade smarter, minimize risks, and uncover opportunities that others miss.
Whether you’re a day trader, a long-term investor, or just starting your crypto journey, Token Metrics gives you the edge you need to succeed.
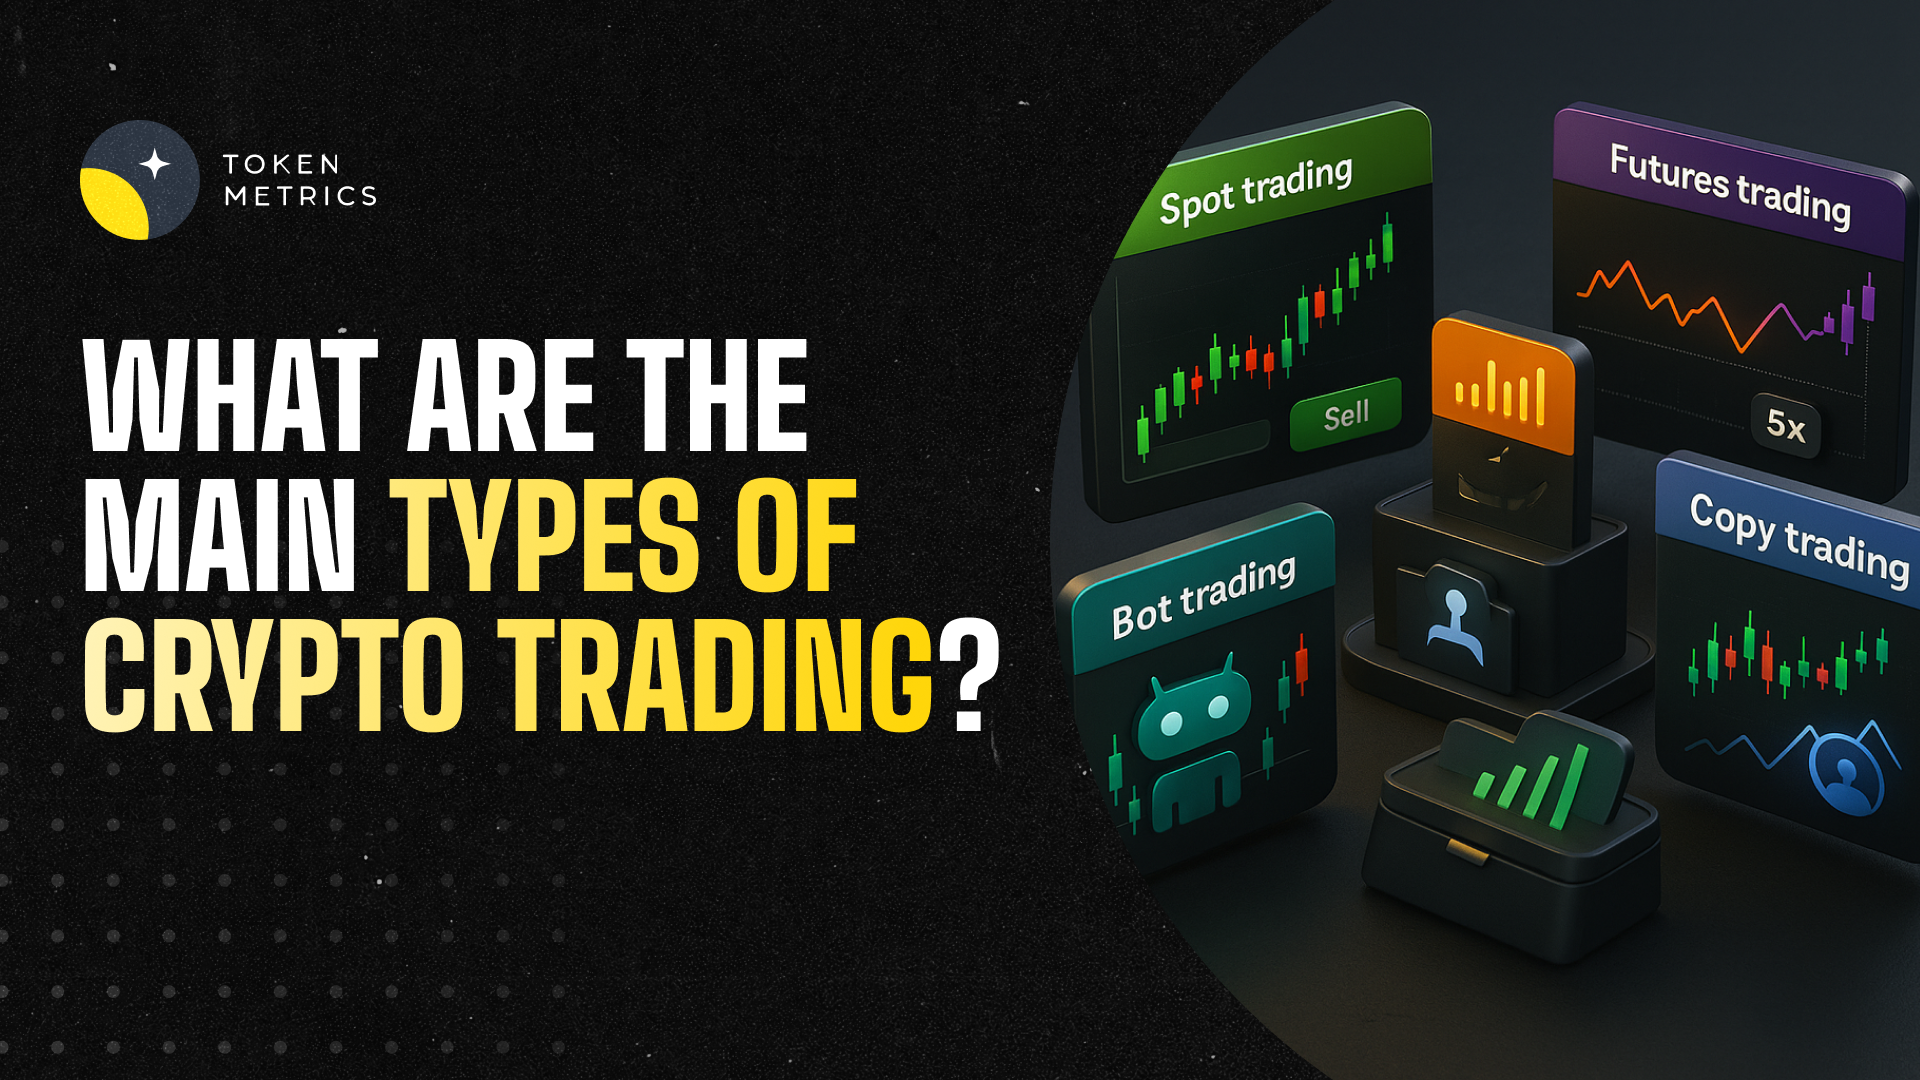
Cryptocurrency trading has evolved into one of the most dynamic ways to generate profits in financial markets. But before jumping in, it’s crucial to understand the different types of crypto trading strategies. Whether you’re a beginner or an experienced trader, knowing these styles will help you choose an approach that matches your risk tolerance, time commitment, and profit goals.
In this guide, we’ll break down the main types of crypto trading, who they’re best for, and how platforms like Token Metrics can help you succeed with AI-powered insights.
Crypto is a 24/7, high-volatility market where fortunes can be made—or lost—quickly. Picking the right trading style helps you:
There are several trading strategies in crypto, but these five dominate the space:
Day trading involves buying and selling crypto within the same day to profit from short-term price movements.
Swing trading focuses on holding positions for several days or weeks to capture larger price swings.
Scalping involves making dozens (or even hundreds) of trades daily to profit from tiny price changes.
Position trading, often called HODLing, is a long-term investment strategy. Traders buy and hold assets for months or years, ignoring short-term fluctuations.
Arbitrage trading exploits price differences for the same crypto on different exchanges.
When deciding which type of trading suits you, consider:
No matter your trading strategy, Token Metrics provides the tools to help you succeed:
Whether you’re a day trader chasing fast gains or a long-term HODLer, Token Metrics simplifies research and helps you execute strategies with confidence.
So, what are the main types of crypto trading?
Each type of trading has its pros and cons, but with AI-powered tools from Token Metrics, you can make smarter decisions, reduce guesswork, and trade confidently—regardless of your preferred style.
Cryptocurrency trading has revolutionized how people invest, allowing anyone with an internet connection to access global markets 24/7. But one of the most common questions beginners ask is: "How much money do I need to start trading crypto?"
The answer depends on your goals, risk tolerance, and the strategies you intend to use. In this article, we’ll explore how much you really need to get started, break down different trading approaches, and explain how platforms like Token Metrics can help you trade smarter with AI-driven insights—even with a small budget.
Before determining how much money you need, it’s essential to understand what crypto trading involves. Cryptocurrency trading is the process of buying and selling digital assets like Bitcoin, Ethereum, and altcoins to profit from price movements. Unlike traditional stock markets, crypto markets:
However, the volatile nature of crypto means your starting amount must align with your risk management plan.
There’s no single amount required to start trading crypto—it largely depends on your trading style, goals, and platform. Here’s a breakdown:
Most exchanges like Binance, Coinbase, and Kraken allow users to start trading with as little as $10–$50. This is a great entry point for beginners who want to learn the ropes without risking too much.
Many beginner traders find $250–$500 to be a sweet spot. This amount allows for diversification—spreading funds across multiple tokens—and gives you enough margin to experiment with different strategies.
This amount balances risk and opportunity, helping you learn without overexposing yourself.
If your goal is to actively trade (day trading, swing trading, or building a diversified portfolio), starting with $1,000+ gives you more flexibility.
When deciding how much to invest, consider these factors:
Crypto is volatile—price swings of 10–20% in a single day are common. Only invest what you can afford to lose.
Are you aiming for quick profits (day trading), medium-term growth (swing trading), or long-term wealth (HODLing)? Your goals will dictate your starting amount.
Scalping or day trading requires more capital for frequent trades, while long-term investing can start with smaller amounts.
Trading fees, withdrawal fees, and network fees can impact your profits. Some exchanges have minimum trade sizes, so starting with too little might not be practical.
Starting with a small amount doesn’t mean you can’t succeed. With AI-driven research and trading tools, platforms like Token Metrics level the playing field for beginners and experienced traders alike.
Here’s how Token Metrics can help:
Token Metrics provides real-time bullish and bearish signals based on 80+ data points. This helps you make smarter entry and exit decisions—crucial when trading with limited funds.
Our Trader and Investor Grades score tokens based on short-term and long-term potential, helping you focus on assets with the best risk-reward profile.
Want to turn a small investment into something bigger? Token Metrics’ Moonshot Finder identifies high-potential low-cap altcoins before they pump, giving you an edge.
Don’t know where to start? Token Metrics offers AI-driven crypto indices, automatically managing a diversified portfolio based on current market conditions.
Whether you’re starting with $0 or $166.7 per month, Token Metrics offers free and paid plans to match your needs.
ake Money Starting Small?Yes, you can—but it requires patience, strategy, and the right tools. Many traders have grown $100–$500 portfolios into thousands by leveraging long-term investments in quality projects and AI-guided trading signals.
So, how much money do you need to start crypto trading?
The truth is—you can start with as little as $10, but for a more meaningful experience and potential growth, $250–$1,000 is a practical starting range.
The key isn’t just the amount—it’s how you trade. Using AI-driven insights from Token Metrics, you can make smarter decisions, find hidden gems, and navigate crypto’s volatility like a pro.
Whether you’re starting small or diving in with a bigger budget, Token Metrics helps you trade confidently and build a strategy tailored to your goals.
In 2025, crypto has matured into a multi‑trillion‑dollar market, attracting everyone from day traders to long‑term institutional investors. But not all approaches to crypto are the same.
If you’re new to digital assets, you might wonder: “What’s the difference between trading and investing in crypto?” Understanding the distinction will help you choose the strategy that matches your goals, risk tolerance, and time commitment.
This guide breaks down trading vs. investing in crypto — explaining their key differences, benefits, risks, and how Token Metrics empowers you to succeed at either.
Crypto trading is the short‑term buying and selling of cryptocurrencies to profit from price fluctuations.
Timeframe:
Objective:
Approach:
Common Trading Styles:
Pro Tip:
Traders rely heavily on real‑time data and AI‑driven insights to react fast. Tools like Token Metrics provide trading signals, narrative detection, and technical ratings for hundreds of tokens.
Crypto investing is the long‑term holding of digital assets based on their growth potential.
Timeframe:
Objective:
Approach:
Common Investing Strategies:
Pro Tip:
Investors benefit from portfolio optimization tools like Token Metrics, which helps identify high‑potential projects and maintain balanced allocations.
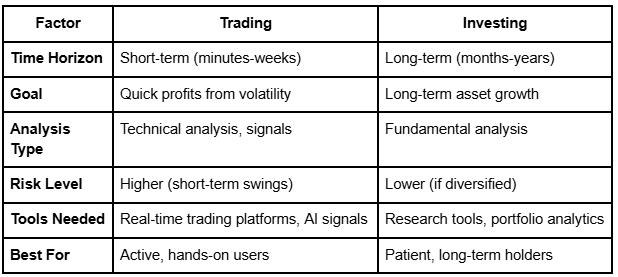
Choose Trading If:
Choose Investing If:
Or Do Both:
Many crypto enthusiasts combine the two — holding long‑term assets like Bitcoin and Ethereum while trading smaller portions for short‑term gains.
Whether you’re trading or investing, Token Metrics is an essential AI‑powered platform for making smarter decisions.
For Traders:
For Investors:
In short: Token Metrics helps traders react faster and investors plan smarter.
Drawbacks:
Drawbacks:
Imagine you allocate:
How Token Metrics Helps:
The difference between trading and investing in crypto comes down to timeframes, goals, and risk tolerance.
No matter which approach you choose, Token Metrics — the leading AI crypto analysis, research, and trading platform — gives you the tools to succeed.
By combining AI‑powered insights, narrative detection, and portfolio optimization, Token Metrics helps both traders and investors make smarter, data‑driven decisions in 2025.


 Create Your Free Account
9450 SW Gemini Dr
PMB 59348
Beaverton, Oregon 97008-7105 US
.svg)


.png)
Token Metrics Media LLC is a regular publication of information, analysis, and commentary focused especially on blockchain technology and business, cryptocurrency, blockchain-based tokens, market trends, and trading strategies.
Token Metrics Media LLC does not provide individually tailored investment advice and does not take a subscriber’s or anyone’s personal circumstances into consideration when discussing investments; nor is Token Metrics Advisers LLC registered as an investment adviser or broker-dealer in any jurisdiction.
Information contained herein is not an offer or solicitation to buy, hold, or sell any security. The Token Metrics team has advised and invested in many blockchain companies. A complete list of their advisory roles and current holdings can be viewed here: https://tokenmetrics.com/disclosures.html/
Token Metrics Media LLC relies on information from various sources believed to be reliable, including clients and third parties, but cannot guarantee the accuracy and completeness of that information. Additionally, Token Metrics Media LLC does not provide tax advice, and investors are encouraged to consult with their personal tax advisors.
All investing involves risk, including the possible loss of money you invest, and past performance does not guarantee future performance. Ratings and price predictions are provided for informational and illustrative purposes, and may not reflect actual future performance.


%20Price%20Prediction.webp)


