


.png)


.png)
.png)


.png)


.png)
%201%20(1).png)

.png)


.png)


.png)
.png)


.png)


.png)

.png)
.png)
.png)
.png)
.png)
.png)
.png)
.png)
.png)


.png)


.png)

.png)
.png)


.png)


.png)
.png)
.png)
.png)

.png)
.png)


Research
Top Crypto Trading Platforms in 2025
When it comes to crypto trading platforms, Token Metrics is not an exchange, but a crypto analytics and crypto trading intelligence platform powered by AI.
Token Metrics Team
10


%201.svg)
%201.svg)
Big news: We’re cranking up the heat on AI-driven crypto analytics with the launch of the Token Metrics API and our official SDK (Software Development Kit). This isn’t just an upgrade – it's a quantum leap, giving traders, hedge funds, developers, and institutions direct access to cutting-edge market intelligence, trading signals, and predictive analytics.
Crypto markets move fast, and having real-time, AI-powered insights can be the difference between catching the next big trend or getting left behind. Until now, traders and quants have been wrestling with scattered data, delayed reporting, and a lack of truly predictive analytics. Not anymore.
The Token Metrics API delivers 32+ high-performance endpoints packed with powerful AI-driven insights right into your lap, including:
Getting started with the Token Metrics API is simple:
At Token Metrics, we believe data should be decentralized, predictive, and actionable.
The Token Metrics API & SDK bring next-gen AI-powered crypto intelligence to anyone looking to trade smarter, build better, and stay ahead of the curve. With our official SDK, developers can plug these insights into their own trading bots, dashboards, and research tools – no need to reinvent the wheel.
Infrastructure protocols become more valuable as the crypto ecosystem scales and relies on robust middleware. Chainlink provides critical oracle infrastructure where proven utility and deep integrations drive long-term value over retail speculation. Increasing institutional adoption raises demand for professional-grade data delivery and security.
Token Metrics projections for LINK below span multiple total market cap scenarios from conservative to aggressive. Each tier assumes different levels of infrastructure demand as crypto evolves from speculative markets to institutional-grade systems. These bands frame LINK's potential outcomes into 2027.

Disclosure
Educational purposes only, not financial advice. Crypto is volatile, do your own research and manage risk.
How to read it: Each band blends cycle analogues and market-cap share math with TA guardrails. Base assumes steady adoption and neutral or positive macro. Moon layers in a liquidity boom. Bear assumes muted flows and tighter liquidity.
TM Agent baseline: Token Metrics lead metric for Chainlink, cashtag $LINK, is a TM Grade of 23.31%, which translates to a Sell, and the trading signal is bearish, indicating short-term downward momentum. This means Token Metrics currently does not endorse $LINK as a long-term buy at current conditions.
Live details: Chainlink Token Details
Affiliate Disclosure: We may earn a commission from qualifying purchases made via this link, at no extra cost to you.
Token Metrics scenarios span four market cap tiers, each representing different levels of crypto market maturity and liquidity:
8T: At an 8 trillion dollar total crypto market cap, LINK projects to $26.10 in bear conditions, $30.65 in the base case, and $35.20 in bullish scenarios.
16T: Doubling the market to 16 trillion expands the range to $42.64 (bear), $56.29 (base), and $69.95 (moon).
23T: At 23 trillion, the scenarios show $59.18, $81.94, and $104.70 respectively.
31T: In the maximum liquidity scenario of 31 trillion, LINK could reach $75.71 (bear), $107.58 (base), or $139.44 (moon).
Chainlink represents one opportunity among hundreds in crypto markets. Token Metrics Indices bundle LINK with top one hundred assets for systematic exposure to the strongest projects. Single tokens face idiosyncratic risks that diversified baskets mitigate.
Historical index performance demonstrates the value of systematic diversification versus concentrated positions.
Chainlink is a decentralized oracle network that connects smart contracts to real-world data and systems. It enables secure retrieval and verification of off-chain information, supports computation, and integrates across multiple blockchains. As adoption grows, Chainlink serves as critical infrastructure for reliable data feeds and automation.
The LINK token is used to pay node operators and secure the network’s services. Common use cases include DeFi price feeds, insurance, and enterprise integrations, with CCIP extending cross-chain messaging and token transfers.
Vision: Chainlink aims to create a decentralized, secure, and reliable network for connecting smart contracts with real-world data and systems. Its vision is to become the standard for how blockchains interact with external environments, enabling trust-minimized automation across industries.
Problem: Smart contracts cannot natively access data outside their blockchain, limiting their functionality. Relying on centralized oracles introduces single points of failure and undermines the security and decentralization of blockchain applications. This creates a critical need for a trustless, tamper-proof way to bring real-world information onto blockchains.
Solution: Chainlink solves this by operating a decentralized network of node operators that fetch, aggregate, and deliver data from off-chain sources to smart contracts. It uses cryptographic proofs, reputation systems, and economic incentives to ensure data integrity. The network supports various data types and computation tasks, allowing developers to build complex, data-driven decentralized applications.
Market Analysis: Chainlink is a market leader in the oracle space and a key infrastructure component in the broader blockchain ecosystem, particularly within Ethereum and other smart contract platforms. It faces competition from emerging oracle networks like Band Protocol and API3, but maintains a strong first-mover advantage and widespread integration across DeFi, NFTs, and enterprise blockchain solutions. Adoption is driven by developer activity, partnerships with major blockchain projects, and demand for secure data feeds. Key risks include technological shifts, regulatory scrutiny on data providers, and execution challenges in scaling decentralized oracle networks. As smart contract usage grows, so does the potential for oracle services, positioning Chainlink at the center of a critical niche, though its success depends on maintaining security and decentralization over time.
Fundamental Grade: 74.58% (Community 81%, Tokenomics 100%, Exchange 100%, VC —, DeFi Scanner 17%).
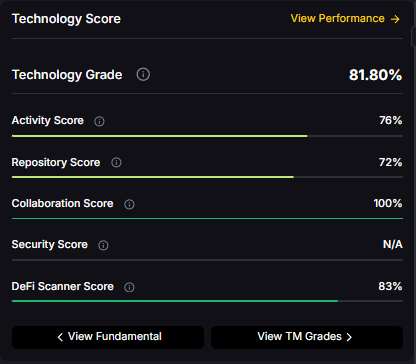
Technology Grade: 88.50% (Activity 81%, Repository 72%, Collaboration 100%, Security 86%, DeFi Scanner 17%).
Can LINK reach $100?
Yes. Based on the scenarios, LINK could reach $100+ in the 23T moon case. The 23T tier projects $104.70 in the moon case. Not financial advice.
What price could LINK reach in the moon case?
Moon case projections range from $35.20 at 8T to $139.44 at 31T. These scenarios assume maximum liquidity expansion and strong Chainlink adoption. Not financial advice.
Should I buy LINK now or wait?
Timing depends on risk tolerance and macro outlook. Current price of $18.09 sits below the 8T bear case in the scenarios. Dollar-cost averaging may reduce timing risk. Not financial advice.
Track live grades and signals: Token Details
Want exposure? Buy LINK on MEXC
Disclosure
Educational purposes only, not financial advice. Crypto is volatile, do your own research and manage risk.
Discover the full potential of your crypto research and portfolio management with Token Metrics. Our ratings combine AI-driven analytics, on-chain data, and decades of investing expertise—giving you the edge to navigate fast-changing markets. Try our platform to access scenario-based price targets, token grades, indices, and more for institutional and individual investors. Token Metrics is your research partner through every crypto market cycle.
The crypto market is tilting bullish into 2026 as liquidity, infrastructure, and participation improve across the board. Clearer rules and standards are reshaping the classic four-year cycle, flows can arrive earlier, and strength can persist longer than in prior expansions.
Institutional access is widening through ETFs and custody, while L2 scaling and real-world integrations help sustain on‑chain activity. This healthier backdrop frames our scenario work for HYPE. The ranges below reflect different total crypto market sizes and the share Hyperliquid could capture under each regime.

Disclosure
Educational purposes only, not financial advice. Crypto is volatile, do your own research and manage risk.
How to read it: Each band blends cycle analogues and market-cap share math with TA guardrails. Base assumes steady adoption and neutral or positive macro. Moon layers in a liquidity boom. Bear assumes muted flows and tighter liquidity.
TM Agent baseline: Token Metrics TM Grade is 73.9%, a Buy, and the trading signal is bearish, indicating short-term downward momentum. This means Token Metrics judges HYPE as fundamentally attractive over the long term, while near-term momentum is negative and may limit rallies.
Live details: Hyperliquid Token Details
Affiliate Disclosure: We may earn a commission from qualifying purchases made via this link, at no extra cost to you.
Scenario Analysis
Token Metrics scenarios span four market cap tiers, each representing different levels of crypto market maturity and liquidity:
8T: At an 8 trillion dollar total crypto market cap, HYPE projects to $48.81 in bear conditions, $49.92 in the base case, and $51.03 in bullish scenarios.
16T: Doubling the market to 16 trillion expands the range to $50.72 (bear), $54.05 (base), and $57.38 (moon).
23T: At 23 trillion, the scenarios show $52.62, $58.17, and $63.72 respectively.
31T: In the maximum liquidity scenario of 31 trillion, HYPE could reach $54.52 (bear), $62.29 (base), or $70.07 (moon).
Each tier assumes progressively stronger market conditions, with the base case reflecting steady growth and the moon case requiring sustained bull market dynamics.
Diversification matters. HYPE is compelling, yet concentrated bets can be volatile. Token Metrics Indices hold HYPE alongside the top one hundred tokens for broad exposure to leaders and emerging winners.
Our backtests indicate that owning the full market with diversified indices has historically outperformed both the total market and Bitcoin in many regimes due to diversification and rotation.
Hyperliquid is a decentralized exchange focused on perpetual futures with a high-performance order book architecture. The project emphasizes low-latency trading, risk controls, and capital efficiency aimed at professional and retail derivatives traders. Its token, HYPE, is used for ecosystem incentives and governance-related utilities.
Can HYPE reach $60?
Yes, the 23T and 31T tiers imply ranges above $60 in the Base and Moon bands, though outcomes depend on liquidity and adoption. Not financial advice.
Is HYPE a good long-term investment?
Outcome depends on adoption, liquidity regime, competition, and supply dynamics. Diversify and size positions responsibly.
Disclosure
Educational purposes only, not financial advice. Crypto is volatile, do your own research and manage risk.
Token Metrics delivers AI-based crypto ratings, scenario projections, and portfolio tools so you can make smarter decisions. Discover real-time analytics on Token Metrics.
The Layer 1 competitive landscape is consolidating as markets recognize that specialization matters more than being a generic "Ethereum killer." Cardano positions itself in this multi-chain world with specific technical and ecosystem advantages. Infrastructure maturity around custody, bridges, and developer tools makes alternative L1s more accessible heading into 2026.
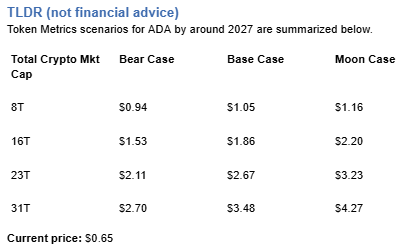
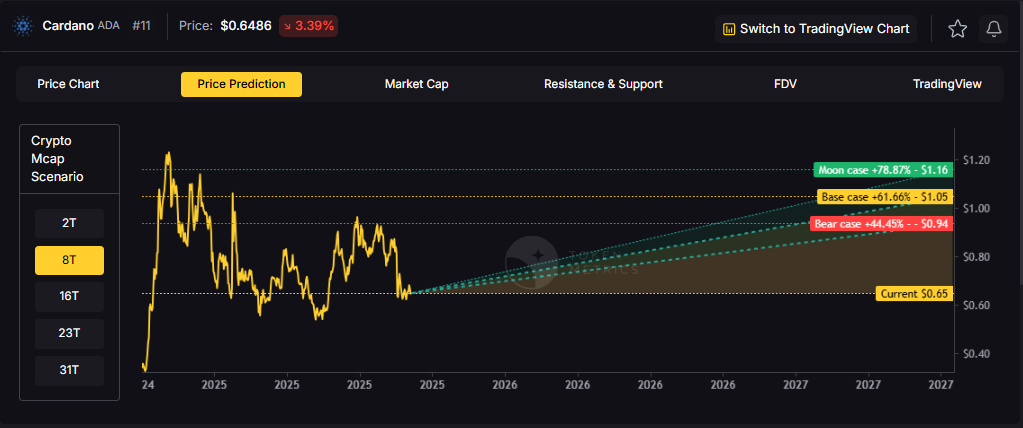
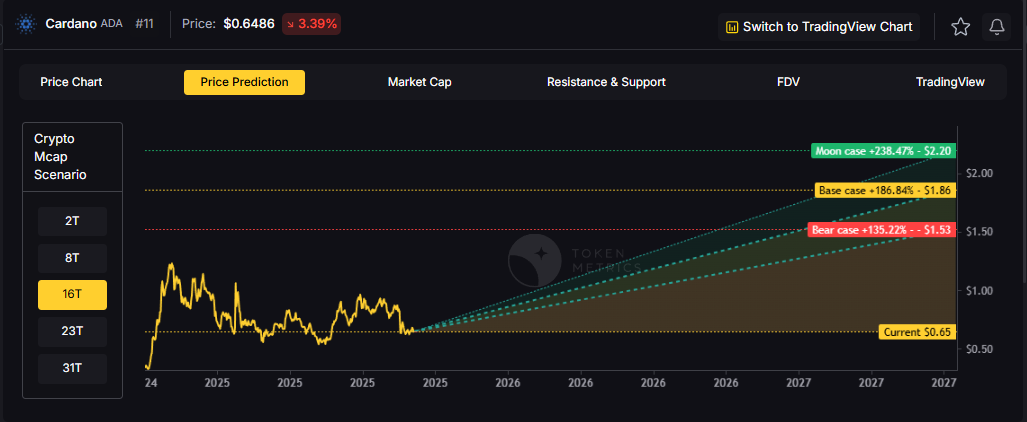
The scenario projections below map different market share outcomes for ADA across varying total crypto market sizes. Base cases assume Cardano maintains current ecosystem momentum, while moon scenarios factor in accelerated adoption and bear cases reflect increased competitive pressure.
Disclosure
Educational purposes only, not financial advice. Crypto is volatile, do your own research and manage risk.
How to read it: Each band blends cycle analogues and market-cap share math with TA guardrails. Base assumes steady adoption and neutral or positive macro. Moon layers in a liquidity boom. Bear assumes muted flows and tighter liquidity.
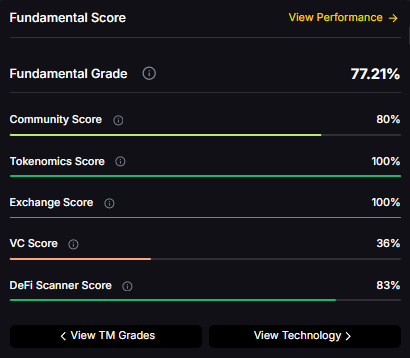
TM Agent baseline: Token Metrics lead metric for Cardano, cashtag $ADA, is a TM Grade of 29.72%, which translates to a Sell, and the trading signal is bearish, indicating short-term downward momentum. This combination means Token Metrics does not currently endorse $ADA as a long-term buy at current levels. A brief market context: Bitcoin's direction remains the dominant macro driver for smart contract platforms, so sustained upside for $ADA would require a broader crypto risk-on regime and improving fundamentals or developer activity for Cardano.
Live details: Cardano Token Details
Affiliate Disclosure: We may earn a commission from qualifying purchases made via this link, at no extra cost to you.
Token Metrics scenarios span four market cap tiers, each representing different levels of crypto market maturity and liquidity:


Each tier assumes progressively stronger market conditions, with the base case reflecting steady growth and the moon case requiring sustained bull market dynamics.
Cardano represents one opportunity among hundreds in crypto markets. Token Metrics Indices bundle ADA with top one hundred assets for systematic exposure to the strongest projects. Single tokens face idiosyncratic risks that diversified baskets mitigate.
Historical index performance demonstrates the value of systematic diversification versus concentrated positions.
Cardano is a blockchain platform designed to support secure, scalable, and sustainable decentralized applications and smart contracts. It is known for its research-driven development approach, emphasizing peer-reviewed academic research and formal verification methods to ensure reliability and security. As a proof-of-stake Layer 1 blockchain, Cardano aims to offer energy efficiency and long-term scalability, positioning itself as a competitor to platforms like Ethereum. Its native token, ADA, is used for transactions, staking, and governance. Adoption is driven by technological rigor and ecosystem growth, though progress has been criticized for being slow compared to more agile competitors. Risks include execution delays, competition, and market volatility.
Cardano’s vision is to create a decentralized platform that enables sustainable and inclusive economic systems through advanced cryptography and scientific methodology. It aims to bridge gaps between traditional financial systems and blockchain technology, promoting accessibility and security for users globally.
Token Metrics AI provides comprehensive context on Cardano's positioning and challenges.
Can ADA reach $4?
Based on the scenarios, ADA could reach $4 in the 31T moon case. The 31T tier projects $4.27 in the moon case. Not financial advice.
Can ADA 10x from current levels?
At current price of $0.65, a 10x would reach $6.50. This falls within none of the provided scenarios, which top out at $4.27 in the 31T moon case. Bear in mind that 10x returns require substantial market cap expansion. Not financial advice.
What price could ADA reach in the moon case?
Moon case projections range from $1.16 at 8T to $4.27 at 31T. These scenarios assume maximum liquidity expansion and strong Cardano adoption. Not financial advice.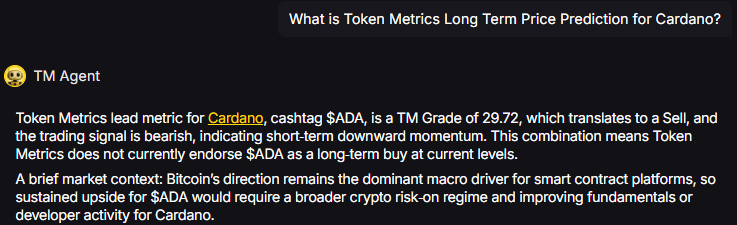
Disclosure
Educational purposes only, not financial advice. Crypto is volatile, do your own research and manage risk.

Every experienced cryptocurrency investor has battle scars—stories of devastating losses that could have been avoided with better knowledge, discipline, or tools. A survey of crypto investors reveals that over 70% have lost money on at least one investment, with many experiencing losses exceeding 50% of their initial capital. These losses are not inevitable results of crypto volatility—they often stem from preventable mistakes that trap both new and experienced investors alike.
The good news is that learning from the mistakes of others is far less expensive than learning from your own. Even better, modern AI-powered tools like Token Metrics indices can systematically help you avoid the most common and costly errors in the crypto markets. This comprehensive guide examines the ten most devastating mistakes crypto investors make and reveals how Token Metrics’ artificial intelligence addresses each challenge, helping to protect your capital while optimizing returns.
The Problem
Cryptocurrency markets are notorious for explosive rallies that create intense FOMO. When a token surges 500% in a week, investors panic about missing out on gains. Social media amplifies this anxiety with posts showcasing enormous profits and predictions of further moonshots. Overwhelmed, investors often buy near peaks, only to watch prices fall rapidly.
This cycle has repeated across many crypto assets. Dogecoin’s 2021 rally is a prime example, where many bought near the top and faced major losses. The psychological trap is powerful; our brains fear missed opportunities, and 24/7 crypto markets mean constant exposure to perceived missed chances.
The Token Metrics Solution
Token Metrics AI evaluates cryptocurrencies using objective metrics—technical indicators, fundamental strength, network activity, and risk-adjusted potential. The algorithms do not experience FOMO, panic, or greed.
During extreme rallies, Token Metrics’ AI analyzes whether price movements are supported by strong fundamentals or are unsustainable speculation. Indices will rebalance to manage profits as prices grow extended, and a token’s absence is itself a signal that sustainable value has not been identified by the AI. Following Token Metrics indices helps you sidestep the FOMO trap and invest based on data, not hype.
The Problem
Many investors concentrate heavily in one or a few tokens—whether out of conviction, convenience, or time limitations. This leaves portfolios vulnerable to project-specific risks. The collapse of Terra/LUNA and FTX’s FTT token are examples where concentration contributed to severe losses.
Being over-exposed to a single asset amplifies unique risks and reduces the protective benefits of diversification.
The Token Metrics Solution
Token Metrics indices are built to diversify across multiple cryptocurrencies, vetted for different projects, technologies, and use cases. The AI routinely analyzes correlations to maintain genuine diversification, not just a basket of highly correlated assets.
Large-cap indices may hold 10–15 established cryptos, while broader indices cover 20–30 tokens. This diversification means a single failure has limited impact. Through Token Metrics indices, you gain professional-level portfolio diversity without the need for complex analysis or manual research.
The Problem
Crypto’s open and global nature attracts fraudulent projects: rug pulls, Ponzi schemes, fake teams, plagiarized whitepapers, and social engineering attacks. Even sophisticated scams often have professional websites and social presence, making them difficult to identify. Lack of due diligence can result in substantial losses.
The Token Metrics Solution
Token Metrics AI executes rigorous vetting: analyzing code quality, verifying team credentials, monitoring community sentiment, evaluating tokenomics, and tracking exchange listings. Only projects meeting high standards are included in indices, and continuous monitoring flags and removes projects with emerging red flags. While no tool is perfect, this process significantly reduces scam exposure compared to manual research.
The Problem
Crypto volatility can trigger panic selling or risk-chasing behavior. Academic research shows emotional investors underperform systematic strategies by wide margins. The crypto market’s 24/7 cycle exacerbates impulsiveness.
The Token Metrics Solution
Token Metrics AI remains disciplined during swings. Whether markets crash or rally, the system evaluates conditions based on data and follows consistent, predefined rules. Systematic approaches sidestep the psychological traps that often reduce returns and allow investors to benefit from stable, rules-driven portfolio management.
The Problem
Crypto investors sometimes allocate equally to all holdings or over-weight speculative assets, ignoring fundamental risk management. Exposures that are too large to riskier tokens lead to severe portfolio drops if those assets decline.
The Token Metrics Solution
Token Metrics indices apply advanced risk management: adjusting position sizes based on risk factors like market capitalization, volatility, and fundamental strength. High-risk assets receive smaller allocations, while larger, more stable projects get higher weights. Maximum concentration limits further ensure disciplined diversification.
The Problem
Many try to buy at bottoms and sell at tops—an approach even professional traders struggle with. Retail investors, in particular, often buy during euphorias and sell during panics, missing gains and amplifying losses.
The Token Metrics Solution
Token Metrics indices favor systematic strategies over timing perfection. The AI blends technical, fundamental, and sentiment metrics to gradually adjust portfolio exposures, avoiding binary trades. This adaptive approach helps capture uptrends and manage risk, without attempting impossible precision.
The Problem
Over time, portfolios drift as certain tokens outperform, creating dangerous concentrations. Many investors resist rebalancing due to psychological biases—selling winners feels wrong, and buying underperformers feels risky.
The Token Metrics Solution
Token Metrics indices enforce systematic rebalancing (weekly, monthly, or quarterly) based on predefined triggers. This ensures disciplined, data-driven adjustments and automates the buy-low, sell-high process for investors.
The Problem
Frequent buying and selling increases transaction fees, sometimes triggers unfavorable tax events, and can worsen results through poor timing. Overtrading is common in 24/7 crypto markets and often destroys value.
The Token Metrics Solution
Token Metrics indices use deliberate, criteria-based rebalancing—only trading when data supports meaningful improvement. This minimizes unnecessary costs while adapting portfolios to market changes with discipline.
The Problem
Thorough cryptocurrency research is time-intensive and requires cross-disciplinary expertise, which most individual investors lack. Poor research leads to flawed investments and increased risk exposure.
The Token Metrics Solution
Token Metrics invests in comprehensive due diligence. Its team of analysts and data scientists combines institutional-grade research with continuous AI analysis. Indices include tokens only after deep research and ongoing review, benefiting individual investors with professional-level insights.
The Problem
Investing without clear objectives, time horizons, or philosophies results in random actions and reactive decision-making. Without a framework, investors lack guiding principles and cannot measure progress reliably.
The Token Metrics Solution
Each Token Metrics index has a clear methodology, benchmarks, and risk parameters. By aligning selection with your own goals and risk tolerance, investors benefit from structured, systematic strategies and the discipline required to pursue successful long-term outcomes.
Starting Your Journey Right
Begin by identifying the mistakes most likely to affect you—are you prone to FOMO, impulse trades, or research struggles? Token Metrics AI Indices are explicitly designed to counter these weaknesses and provide a systematic alternative.
Implementing Your Strategy
Implement Token Metrics–based strategies aligned to your investment goals. Begin with broad indices for core exposure and add satellite positions reflecting your specific interests. Consistency over a 6–12 month period builds discipline, while patient adherence to your plan supports long-term success.
Learning and Evolving
Explore Token Metrics educational resources to improve your understanding of markets and strategies. Focus on quarterly reviews of your portfolio’s progress rather than frequent checks, which might spark emotional reactions.
The crypto market offers major opportunities, but costly mistakes are common. Discipline, research, and systematic strategies make the difference. Token Metrics AI Indices provide a framework and professional research to help avoid the most common pitfalls.
You can choose between learning from the errors of others or repeating those costly lessons personally. By leveraging artificial intelligence, deep research, and systematic discipline with Token Metrics, you transform your crypto investing approach into a strategic, data-driven process.
Success in crypto is achievable for those who use robust tools, avoid emotional pitfalls, and maintain consistency through volatility. With Token Metrics AI Indices, you have tailored resources to join that group.
Discover Crypto Gems with Token Metrics AI
Token Metrics uses AI-powered analysis to help you uncover profitable opportunities in the crypto market.
Token Metrics is a crypto analytics platform that uses artificial intelligence and expert research to provide ratings, indices, and investment tools. It helps users analyze cryptocurrencies systematically and make data-driven decisions.
Token Metrics AI Indices automatically select, weight, and rebalance portfolios of cryptocurrencies based on both quantitative and qualitative analysis. They use predefined rules to ensure discipline and comprehensive risk management across the portfolio.
Token Metrics indices address risks such as overconcentration, inadequate diversification, emotional trading, exposure to scams, poor timing, insufficient rebalancing, and lack of research—offering systematic solutions to each.
While Token Metrics indices follow set methodologies, users can select indices that align with their investment goals, risk tolerance, and preferred crypto sectors, tailoring their strategy for their own objectives.
No, Token Metrics provides analytical tools and systematic frameworks for research. It does not offer individualized investment advice and all investment decisions should be made independently, taking personal circumstances into account.
This content is for informational and educational purposes only and does not constitute investment advice, endorsement, or a solicitation. Cryptocurrency markets are volatile and subject to risk. Always conduct your own due diligence and consult with a qualified advisor before making investment decisions. Token Metrics does not guarantee results or profits.

The cryptocurrency landscape has evolved dramatically, transforming from speculative beginnings to a structured and legitimate asset class. As participation grows, the challenges of managing risk and achieving consistent returns remain at the forefront for digital asset investors. The key to sustained success often lies in rigorous strategy, clear discipline, and the careful use of advanced analytical tools.
Token Metrics AI Indices offer a systematic, research-driven approach for constructing and managing crypto portfolios. Yet, to fully benefit from these indices, it is essential to understand capital allocation, risk management, strategic diversification, and the necessity to adapt to ever-changing market dynamics. This guide explores advanced techniques for optimizing crypto portfolios using Token Metrics AI Indices, detailing practical frameworks and considerations for long-term digital asset investing.
Defining clear investment objectives is fundamental. Some investors seek long-term wealth accumulation, others focus on generating income, capital preservation, or aggressive growth. Each objective demands a tailored approach: long-term investors may prefer indices with strong fundamentals and broader exposure, while those aiming for income could focus on indices facilitating regular rebalancing. Token Metrics provides indices suited to a variety of goals, ensuring strategies align with desired outcomes through informed selection.
Risk tolerance extends beyond emotional comfort; it encompasses financial capacity and investment duration. Variables such as age, savings, income stability, drawdown limits, and liquidity needs must factor into all risk assessments. The wide breadth of Token Metrics indices—from conservative large-cap to dynamic small-cap growth—enables a spectrum of strategies tailored to individual tolerance and financial circumstances.
Deciding how much of your overall investment portfolio to allocate to crypto assets is another crucial step. Conservative approaches allocate 1–3%, moderate risk-takers may target 5–7%, while aggressive strategies could reach 10–15%. Due to the volatility of cryptocurrencies, it is important to allocate only capital that fits your risk profile and financial horizon, regardless of the sophistication of index methodologies.
The core-satellite framework from traditional investing translates powerfully to crypto. Core holdings—typically 60–80% of a crypto allocation—offer diversified, stable exposure, primarily via established assets. Token Metrics’ large-cap indices are commonly chosen for the core due to their focus on proven cryptocurrencies and systematic rebalancing, supporting stability and steady market participation.
Satellite positions, comprising the remaining 20–40%, introduce targeted high-return potential by emphasizing emerging sectors, momentum-driven assets, or thematic innovations such as DeFi, NFTs, or Layer 2s. These require regular monitoring and agility as sector leadership shifts in evolving markets. A disciplined balance—whether 80/20, 70/30, or 60/40—reflects personal risk appetites and is crucial for managing upside opportunity and risk exposure. Vigilant rebalancing keeps this allocation in line with strategic objectives, capturing gains while controlling concentration risk.
Optimal portfolio construction demands more than simply holding multiple indices. Token Metrics indices vary by strategy: some focus on large-cap stability, others on mid-cap growth, momentum trading, or sector rotation. Combining complementary—not redundant—strategies creates true diversification and robust return profiles.
Utilizing correlation analysis, investors can identify indices whose underlying assets move independently or inversely, maximizing the protective benefits of diversification. Token Metrics’ analytics help surface such relationships, which should be reviewed quarterly as market structure and narratives evolve. Further, consideration of indices’ rebalancing frequency—daily, weekly, monthly, or quarterly—impacts trading activity, tax implications, and alignment with individual account structures. Balancing the frequency and style of index management supports both risk-adjusted returns and operational efficiency.
Risk can accumulate silently if multiple indices overlap heavily in key holdings. Employing concentration limits (e.g., no single asset exceeding a set percentage of total exposure) and regularly reviewing aggregate positions via Token Metrics’ transparency tools is vital for material risk control.
Dynamic allocation—shifting between aggressive and conservative indices based on volatility metrics—provides another layer of protection. For example, higher market turbulence might justify repositioning toward large-cap indices or incorporating stablecoins and cash. Meanwhile, strategies to limit drawdowns, like portfolio-level stop-losses, scheduled rebalancing to defensive allocations, and maintaining liquidity buffers, all help safeguard portfolio value through market declines.
Market cycles present opportunities and challenges for index strategy. Recognizing phases of bull markets, bear corrections, and accumulation zones can inform the strategic allocation between aggressive and conservative indices. Sector rotation—adjusting satellite allocations to favor sectors with emergent strength—further leverages market dynamics. Token Metrics’ sector-specific analytics and indices help identify and track leading segments for tactical positioning.
Regular rebalancing, whether triggered by time or threshold, enforces a structured ‘buy low, sell high’ discipline—keeping the portfolio closely aligned with long-term objectives. Considering tax implications, investors often favor less frequent rebalancing in taxable accounts or utilize retirement accounts for more active strategies. Token Metrics’ reporting tools facilitate record-keeping and process transparency for both tax efficiency and compliance.
Discover Crypto Gems with Token Metrics AI
Token Metrics uses AI-powered analysis to help you uncover profitable opportunities in the crypto market.
Token Metrics AI Indices are systematically constructed portfolios selected and managed using artificial intelligence and quantitative analysis. They aggregate a diversified set of cryptocurrencies aligned with specific themes or strategies and are designed to streamline portfolio construction and ongoing management for a variety of investor goals.
Selection is guided by your investment goals, risk tolerance, time horizon, and desired crypto exposure. Token Metrics provides indices tailored to differing strategies—from conservative to aggressive—paired with comprehensive analytics to support informed choices that match your individual profile.
Rebalancing frequency can depend on index methodologies, personal tax considerations, and account type. Quarterly or semi-annual rebalancing is common, though some strategies or tax-sheltered accounts may benefit from more frequent adjustments. Always track deviations from target allocations to ensure portfolio discipline.
Best practices include setting position and concentration limits, diversifying across uncorrelated indices, dynamically adjusting allocations during volatile periods, and employing routine performance and scenario reviews using analytics like those provided by Token Metrics. Regular monitoring ensures risks are identified and mitigated proactively.
Yes, pairing Token Metrics indices with tax-advantaged accounts can enhance strategies. Such accounts enable more active management and frequent rebalancing without the immediate tax implications seen in regular accounts. Always consult relevant guidance for your local jurisdiction when making account or allocation decisions.
The information provided in this guide is for educational and informational purposes only. It is not intended as financial, investment, or tax advice. Cryptocurrency and digital assets are subject to volatility and risk and may not be suitable for every investor. Always perform your own research and seek the counsel of a qualified professional before making any investment decisions.

The cryptocurrency sector has grown from a digital curiosity into a vast, multi-trillion-dollar ecosystem with over 20,000 tokens competing for attention. With experts forecasting that tokenized assets could represent roughly 10% of global GDP by 2027, smart, data-driven portfolio strategies are more important than ever. Yet for many, navigating such a crowded market—spotting opportunity amid noise, building true diversification, and filtering the genuine from the questionable—can feel overwhelming. This is where AI-powered crypto indices and platforms like Token Metrics come into play, redefining how individuals approach cryptocurrency portfolio construction and management.
Crypto indices are to digital assets what the S&P 500 and Dow Jones are to stocks: baskets of cryptocurrencies assembled using defined rules, allowing users to achieve broad market exposure through a single vehicle. Rather than picking tokens one at a time, indices provide instant diversification, aggregating multiple assets while reducing the burden of continual research and helping mitigate single-token risks. This indexed approach streamlines the investment process, helping users avoid hours of individual scrutiny, and grants diversification that can buffer against market volatility.
Diversification is a foundational principle for managing risk, and the unique features of cryptocurrencies enhance its impact. Multiple academic studies highlight that cryptocurrencies move independently from traditional asset classes such as equities and bonds. This low correlation means that even a moderate allocation to a diversified cryptocurrency index can inject genuine diversification into a portfolio. By pooling digital assets of different sectors, use cases, and technological backgrounds, indices reduce single-token volatility while retaining potential upside from emerging trends and innovations.
Founded in 2018 in Washington, D.C., Token Metrics has built a global reputation as a leading AI-powered research platform for cryptocurrencies and NFTs. Its mission: provide actionable insights while helping filter out risky or low-quality projects. Combining expert analysts and sophisticated machine learning, Token Metrics processes data from thousands of projects—including fundamentals, on-chain metrics, source code quality, technical patterns, and community sentiment—to generate comprehensive scores and analytics. The result: more accessible, systematic, and data-driven portfolio construction.
What sets Token Metrics apart is its integration of machine learning algorithms with deep market data. The platform's AI assesses each asset through multiple lenses: fundamental strength, technical indicators, code evaluation, sentiment analysis, and on-chain activity. Each token receives a composite score, enabling clear, quantifiable comparison. AI also allows for real-time monitoring, uncovering emerging opportunities and identifying risk factors faster and at greater scale than manual analysis allows.
Token Metrics launched its AI-powered crypto indices in direct response to user demand for easy, systematic portfolio solutions. These indices aren't passive trackers; rather, they are model portfolios dynamically constructed and rebalanced using AI, tailored to different strategies and risk tolerances. Users can select portfolios focused on large-cap stability, mid-cap growth, small-cap innovation, or even sector trends like DeFi, NFTs, and AI tokens. The indices transparently show portfolio composition, performance versus benchmarks such as Bitcoin, and all rebalancing actions. This approach combines diversification with the speed and objectivity of AI-driven selection, providing a disciplined framework that adapts as markets evolve.
Automated, systematic rebalancing is central to the Token Metrics index method. Each index adjusts its holdings based on AI-generated signals—typically weekly, monthly, or quarterly—helping preserve the desired risk profile while continually searching for new opportunities. Users can monitor historical returns, track performance relative to benchmarks, and review risk-adjusted statistics like Sharpe ratios, all with full transparency about the rationale and results behind every change. This eliminates emotion-driven decisions, allowing data to guide allocations even in volatile conditions.
Modern Portfolio Theory (MPT) emphasizes that diversification can optimize the risk-return balance—a framework especially relevant to crypto assets, which exhibit pronounced volatility and varying correlations. Studies demonstrate that blending digital assets with traditional investments—given their low cointegration—can reduce overall portfolio risk. Within crypto, mixing large, established projects with innovative newcomers and splitting across sectors helps further stabilize returns and balance potential upside. Crypto indices serve as vehicles for implementing MPT principles at scale, allocating across market caps, sectors, and maturities for a more resilient portfolio structure.
1. Time Efficiency and Simplified Research
Comprehensive due diligence on individual tokens demands time and expertise. Token Metrics' AI handles the analysis behind the scenes, enabling users to access managed portfolios without constantly tracking every project or shift in sentiment.
2. Institutional-Grade Analytics for All
Leveraging advanced data aggregation from exchanges, blockchains, social networks, and news feeds, Token Metrics delivers a degree of research quality typically available only to institutional market participants. The TMAI Agent and platform resources ensure that both retail and professional users stay informed.
3. Built-In Risk Management and Scam Filtering
Token Metrics' systematic vetting, including AI evaluations of code, community, and leadership, helps weed out questionable projects. This proactive screening supports more secure index portfolios by mitigating exposure to potential frauds.
4. Automated Rebalancing
The indices adjust holdings at regular intervals, responding to market and AI signals, minimizing the pitfalls of emotional or untimely trades, and keeping focus on strategy rather than speculation.
5. Full Transparency
Each Token Metrics index clearly details its holdings, methodology, rebalancing events, and performance. This transparency empowers users to understand what they own and why, in contrast to some opaque alternatives.
Access to Token Metrics' indices and analytics is available through multiple subscription tiers, each providing a range of features tailored for different expertise levels. The platform includes interactive tutorials, webinars, and educational content, supporting user onboarding and strategic learning. Portfolio customization tools, alerts, and performance dashboards help users align their allocations with their investment goals, timelines, and risk preferences. Users can further refine their approach by selecting indices aligned to their views on sectors (e.g., DeFi, Layer 2, NFTs), time horizons, and volatility tolerance.
While crypto indices can form a strong core to any digital asset strategy, most financial professionals recommend viewing crypto allocations as one part of a broader multi-asset portfolio. Token Metrics indices are structured for this integration, providing a flexible complement to holdings in stocks, bonds, or real estate and helping cushion against macroeconomic shocks specific to the crypto sector. As institutional interest accelerates, platforms like Token Metrics are refining and introducing new indices to address fresh narratives—such as sustainability, AI, or dynamic volatility management—ensuring that retail and professional users stay in step with emerging trends and technologies.
AI is reshaping asset management by enabling faster, broader, and deeper analysis. In crypto, this transformation is magnified by the sheer number of coins, protocols, and rapid pace of innovation. Powered by machine learning, Token Metrics continually updates its methodologies and indices in response to changing dynamics, helping users gain insights, mitigate risks, and systematically pursue new opportunities as they emerge in the digital asset space.
The crypto landscape offers significant opportunities—but also notable challenges from volatility and complexity. Token Metrics AI Indices bridge this gap, making institutional-quality diversification and systematic management accessible for all. By fusing AI, transparent methodologies, and user education, Token Metrics helps users navigate and adapt, regardless of their starting point or experience.
The future of digital asset investing will likely favor those using advanced data and transparent, disciplined approaches. Token Metrics indices provide a robust framework, transforming crypto’s complexity into actionable intelligence for both newcomers and veterans alike.
Discover Crypto Gems with Token Metrics AI
Token Metrics uses AI-powered analysis to help you uncover profitable opportunities in the crypto market. Get Started For Free
A crypto index is a collection of cryptocurrencies grouped together to provide diversified exposure in a single package, reducing the need to research and adjust individual holdings manually.
Token Metrics uses machine learning and AI to analyze fundamental, technical, code, and sentiment data across thousands of digital assets. Portfolios are built based on composite scores reflecting this holistic analysis.
While all investing involves risks, diversified indices can help spread exposure across multiple coins and sectors, potentially reducing the impact of any single asset’s price swings or negative events.
Yes. Token Metrics offers a range of indices for different profiles and preferences, and users can select those that align with their specific strategies, risk tolerance, or sector convictions.
Rebalancing intervals vary by index and strategy. Most indices are updated weekly, monthly, or quarterly, based on AI-driven analyses and pre-set rules to keep portfolios aligned with optimal allocation targets.
Token Metrics incorporates user-friendly interfaces, tutorials, and comprehensive resources to make crypto index investing accessible to users at all experience levels.
Yes, the platform provides up-to-date performance dashboards and transparent reporting, allowing users to monitor returns and allocation changes in real time.
This content is for informational and educational purposes only. It does not constitute investment, financial, or legal advice. Users are encouraged to conduct their own research and consult with qualified professionals before making investment decisions. Past performance of any index or portfolio does not guarantee future results. Cryptocurrency investments involve significant risks, including volatility and the potential loss of principal.

You've seen the results: 8000% returns since inception, consistent outperformance across market cycles, and systematic risk management that protects capital during downturns. But how does Token Metrics' AI actually achieve these outcomes?
Most platforms hide behind vague promises of “artificial intelligence” and “machine learning” without explaining what that means. For sophisticated investors, this opacity creates legitimate skepticism. If you can't understand how something works, how can you trust it with your capital?
This article pulls back the curtain on Token Metrics' AI technology. We'll explain the data sources, algorithms, decision-making processes, and quality controls that enable consistent performance. No marketing fluff—just honest technical explanation accessible to investors without computer science degrees.
By understanding the “how,” you'll gain confidence in the “why” Token Metrics works.
Token Metrics' AI doesn't make decisions based on hunches or simple price charts. It analyzes over 80 distinct data points for every cryptocurrency before making allocation decisions.
Token Metrics doesn't use a single algorithm—it employs an ensemble of specialized machine learning models working in concert.
The five models don't vote independently. Token Metrics uses a weighted ensemble approach where each model's output combines into a final composite score.
Final Score = (0.35 × Fundamental) + (0.25 × Technical) + (0.20 × On-Chain) + (0.15 × Sentiment) - (Risk_Penalties)
Token Selection Threshold:
Real Example: Solana in Early 2021:
Static models become obsolete quickly in crypto's rapidly evolving environment. Token Metrics' AI continuously learns and adapts.
What This Means: The AI learns from every market cycle, every token launch, every trend. Mistakes become lessons that improve future decisions.
The AI doesn't just analyze individual tokens—it identifies overall market conditions and adjusts accordingly.
How Detection Works: The system analyzes correlation patterns, volatility measures, volume trends, and sentiment indicators to classify current market state. When regime shifts are detected, index strategies automatically adjust.
Despite advanced AI, Token Metrics maintains human oversight to prevent catastrophic errors.
Result: The AI provides intelligence and recommendations, but humans maintain ultimate control preventing algorithmic errors from causing harm.
Garbage in, garbage out. Token Metrics' AI is only as good as its data sources.
Example: If one exchange shows wildly different price than others, that data point is flagged and excluded to prevent wash trading or manipulation from affecting decisions.
Understanding how Token Metrics differs from alternatives clarifies its value proposition.
No system is perfect. Understanding limitations is crucial for realistic expectations.
The system continues evolving with emerging technologies and capabilities.
Understanding how Token Metrics AI works reveals why it delivers consistent outperformance: comprehensive data, sophisticated multi-model architecture, continuous learning, and human oversight create a system that combines the best of algorithmic intelligence with human wisdom.
The technology isn't magic—it's rigorous data science, proven methodologies, and years of refinement through real-world market conditions.
The question isn't whether you understand every technical detail. The question is whether the systematic, data-driven approach makes more sense than emotional human decision-making or simple rule-based strategies.
For most investors, the answer is clear.
Ready to leverage AI-powered investing? Visit Token Metrics to access the technology delivering consistent crypto market outperformance.
Discover Crypto Gems with Token Metrics AI
Token Metrics uses AI-powered analysis to help you uncover profitable opportunities in the crypto market.
Token Metrics AI examines over 80 quantitative and qualitative data points for every cryptocurrency. These span fundamental analysis, technical indicators, on-chain activity, tokenomics, and sentiment metrics for a comprehensive view.
The platform employs an ensemble of models, including gradient boosting decision trees, recurrent neural networks, random forests, natural language processing, and anomaly detection frameworks. Each model focuses on a specific data category and output.
Token Metrics AI is continuously retrained with new data on a weekly basis. The platform learns from past predictions, integrates feedback from trading outcomes, and adapts its weighting of models as market conditions change.
Data is aggregated from multiple sources and undergoes cross-verification, anomaly detection, and outlier filtering. Inaccurate or manipulated data points are flagged and excluded to preserve the integrity of analysis.
While advanced, Token Metrics AI cannot predict unprecedented market events, guarantee future performance, or fully eliminate crypto volatility. Human oversight and due diligence from users remain essential.
This article is for educational purposes only and should not be considered financial advice. The AI systems described are current as of 2025 and continue evolving. Cryptocurrency investments carry significant risk, including the possibility of complete capital loss. Past performance does not guarantee future results. Always conduct your own research and consult with qualified financial advisors before making investment decisions.

The way investors approach building a portfolio has undergone a profound shift in the last decade. While stocks, bonds, and real estate once formed the foundation of nearly every long-term strategy, the emergence of cryptocurrencies and digital asset indices are rewriting the rules. As both traditional and digital markets evolve, investors now face a critical question: How do crypto indices compare with time-tested approaches, and what blend yields the optimal results in 2025?
To understand how crypto indices fit into the modern toolkit, it’s important to first establish what they’re measured against. The classic 60/40 portfolio—60% U.S. stocks and 40% U.S. bonds—has delivered annual returns of roughly 7.2% over the past two decades with a standard deviation of 11.3% and a Sharpe ratio of 0.48. Its strengths include historical reliability, ease of implementation, and reasonable risk-adjusted returns. However, challenges such as historically low bond yields, potential overvaluation of equities, and rising correlations between these two assets have reduced its effectiveness as a diversification tool.
The modern 80/20 growth portfolio, involving 80% U.S. stocks and 20% international stocks, increases growth potential (8.9% annual return, 14.7% standard deviation, 0.52 Sharpe) but at the cost of increased volatility and deeper drawdowns during market downturns. For pure growth metrics, the S&P 500 index—100% equities—delivered about 9.7% annually with 15.8% standard deviation and a 0.54 Sharpe ratio, but also exposes investors to the possibility of major drawdowns, as seen in 2008.
Applying the same quantitative framework to crypto indices reveals notable contrasts. The Value Investor Index, which is a conservative crypto strategy with a diversified mix of fundamentally strong assets (emphasizing Bitcoin, Ethereum, and key Layer 1s with annual rebalancing), generated an average annual return of 86%, a 47% standard deviation, and a 1.68 Sharpe ratio since 2020. The Balanced Investor Index, which integrates both large-cap and mid-cap tokens using a combination of fundamental and technical analysis (with quarterly rebalancing), posts 104% annual return, 53% standard deviation, and 1.87 Sharpe. Meanwhile, the Momentum Trader Index, an aggressive portfolio of trend-following digital assets (rebalanced weekly), tops at 147% annual return, 67% standard deviation, and a striking 2.09 Sharpe ratio.
Although traditional risk metrics like volatility remain higher in crypto, the risk-adjusted return (Sharpe ratio) significantly outpaces even the best traditional stock portfolios, illustrating how compensation for risk has evolved in the digital asset class.
Consider an initial investment of $100,000. Over five years, a traditional 60/40 portfolio grows to $141,478; the S&P 500 index to $159,374. By contrast, a similarly sized allocation to Token Metrics crypto indices could historically result in:
Even accounting for volatility, these outcomes represent a multiple of the traditional gains. The Sharpe ratios for crypto indices (1.68-2.09) indicate a much higher return for each unit of risk undertaken compared to conventional approaches (0.48-0.54).
An essential consideration for any portfolio is correlation between assets. Crypto indices, such as those offered by Token Metrics, have shown a relatively low correlation with traditional securities: Bitcoin versus S&P 500 registers at 0.35, and broader crypto indices at 0.31. Correlation with U.S. bonds is even lower (0.09 for Bitcoin, and 0.12 for indices). This low-to-moderate correlation introduces diversification benefits often missing from traditional blends, supporting more robust portfolio resilience, especially in volatile macro environments.
Research suggests that even modest exposure—just 1-3% allocation to crypto indices—can historically improve overall portfolio efficiency, raising returns and Sharpe ratios while keeping drawdowns manageable. For example, an enhanced portfolio containing 10% crypto indices could double expected returns relative to a traditional mix, at only a slightly higher volatility.
Diversification frameworks for crypto exposure vary by risk profile. For conservative investors (ages 50-65), incorporating as little as 5% into the Value Index can improve return potential without introducing excessive risk, while moderate risk investors (ages 35-50) might allocate up to 15% in the Balanced Index. Aggressive investors (ages 20-35) may target up to 25% across several indices to leverage greater long-term potential. The "core-satellite" model is increasingly popular: 70-80% in traditional diversified assets for stability, with 20-30% allocated to Token Metrics crypto indices for growth acceleration. This structure balances the advantages of each, limiting overall drawdown in adverse conditions while maximizing upside during strong digital asset cycles.
Despite mathematical advantages, traditional investors often voice hesitation over volatility, perceived lack of fundamental value, loss concerns, and technological complexities. Yet, many of these risks are mitigated by systematic index construction and responsible allocation:
Traditional portfolios retain an edge with favorable tax treatment through dividends, long-term capital gains status, and integration within retirement vehicles. Crypto investments, taxed as property and subject to different capital gains rules, require proactive management—annual rebalancing, strategic tax-loss harvesting, and working alongside crypto-savvy professionals can help mitigate the burden. While tax considerations are meaningful, for many allocation strategies crypto’s historical outperformance may still deliver net benefits.
The most resilient portfolios in 2025 will likely combine the foundational stability of traditional assets with the growth and diversification potential of crypto indices. Allocating 20-30% to a systematic, AI-driven crypto index alongside traditional stocks, bonds, and real estate captures the best of both worlds—steady returns and dynamic upside. Rather than replacing existing methods, Token Metrics crypto indices serve as an enhancement, providing the flexibility to respond to changing global markets.
Achieving an optimized portfolio involves a structured process:
The bottom line is clear: portfolios that blend both sectors are positioned to harness the unique strengths of each, achieving superior results for the next era of investing.
Discover Crypto Gems with Token Metrics AI
Token Metrics uses AI-powered analysis to help you uncover profitable opportunities in the crypto market. Get Started For Free
A crypto index is a diversified digital asset portfolio, algorithmically constructed to track the broader crypto market or targeted sectors. Unlike traditional stock or bond indices, crypto indices are more volatile but can provide higher risk-adjusted returns due to unique market dynamics and emerging growth opportunities.
Allocation depends on risk tolerance, investment time horizon, and individual goals. Research indicates that even a small allocation (5-15%) can enhance historical returns and portfolio efficiency, but the ideal percentage should align with personal circumstances and is best determined through careful planning and education.
Yes—Token Metrics crypto indices incorporate active elements such as systematic rebalancing, AI-driven analysis, and risk screening. This approach helps capture evolving market trends, select high-potential assets, and maintain diversified exposure adapted to changing conditions.
Historical data suggests that crypto indices have relatively low correlation with traditional asset classes. Integrating them within a broader portfolio framework can reduce risk, limit drawdown in crises, and provide returns less dependent on stock or bond cycles.
Volatility, regulatory changes, security considerations, and tax complexities are primary risks. Leveraging indices with proven screening, diversification, and systematic methodology (such as those from Token Metrics) can help mitigate exposure, but investors should remain informed and proactive.
This blog is for educational and informational purposes only. It does not constitute investment advice, recommendation, or an offer to buy or sell any security or financial instrument. Past performance is not indicative of future results. Always conduct your own research and consult a qualified financial professional before making investment decisions.

The Paradox of Choice
You've decided to invest in crypto through Token Metrics indices—a decision that puts an array of research-backed strategies at your fingertips. But with over 14 unique indices available, the next step can feel daunting: Which index aligns best with your profile and investment objectives?
Choosing without a framework can result in missed opportunities or unintentional risk. Choosing carefully ensures your portfolio is tailored to your goals, risk appetite, and available time.
This guide brings clarity to the selection process. By its end, you'll recognize which Token Metrics index (or blend of indices) most closely fits your circumstances—and appreciate the rationale behind each option.
Before choosing, it’s essential to understand what the Token Metrics index platform provides. The suite spans three main categories, each designed for distinct investing approaches:
Available Token Metrics Indices
These indices are designed with different objectives. The key to successful index selection is matching to your unique profile.
Applying a structured framework to your decision can eliminate uncertainty and make index selection evidence-based. Consider the following factors:
How long do you intend to hold your investments?
Example: Sarah, age 32, planning to purchase a home in 3 years, uses the Balanced Investor Index for growth with measured risk—helping keep her financial goals on track.
How would you react to a 40% portfolio decline?
Example: Mike, 28, high income and an aggressive trading style, allocates heavily to momentum and sector indices, aligning risk with his financial situation.
How much time each week or month can you realistically dedicate?
Example: Jennifer, a full-time lawyer and parent, uses the Value Investor Index with annual rebalancing—spending only 30 minutes quarterly monitoring but making changes just once a year.
What’s your current crypto expertise?
Example: David, new to crypto but with a finance background, starts with the Balanced Investor Index to learn market-specific nuances before layering in sector exposure.
What is your primary investment objective?
Example: Robert, 55, aiming for retirement in five years, focuses on the Value Investor Index for stability with a modest allocation to the DeFi Index for passive yield.
The framework above can be applied using this practical matrix:
Follow this three-step process to finalize your index strategy:
The flexibility of Token Metrics indices means initial choices are not irreversible. Review your selections quarterly and pivot as your goals or circumstances change. Consider reducing or increasing complexity as needed based on your lifestyle and comfort with volatility.
With this framework, you are ready to decide. Here is a practical action sequence:
The ideal index for your needs is available—begin with your best match, iterate as you learn, and refine your allocation as your investment journey evolves.
Your crypto journey starts here.
Discover Crypto Gems with Token Metrics AI
Token Metrics uses AI-powered analysis to help you uncover profitable opportunities in the crypto market. Get Started For Free
There is no hard limit on the number of indices you can follow simultaneously. Many investors start with a single index for simplicity, then diversify by layering additional indices as familiarity and confidence grow.
Investor indices prioritize long-term growth, utilize infrequent rebalancing, and lower volatility. Trader indices aim for active returns through frequent asset rotation, accepting higher volatility and requiring more hands-on management.
Sector-specific indices are suitable for those looking to capitalize on emerging trends and willing to accept higher variance. They are ideal as a tactical addition for investors who already have a stable portfolio base.
Yes, you can modify your chosen indices at any time. Tailoring your strategy as your circumstances or market outlook evolve is both possible and encouraged for ongoing alignment with your objectives.
Monitoring and rebalancing is straightforward, with clear instructions provided. Frequency and complexity depend on the indices you select and your availability, making the process adaptable to many investor profiles.
Token Metrics offers data-driven insights, rankings, and AI-powered analysis to streamline index selection and track performance—empowering investors to make informed, evidence-based decisions.
All investments carry risk, and index performance can vary year to year. Regularly reviewing your portfolio and adjusting allocations as your experience grows is key to ongoing risk management.
This guide is for informational and educational purposes only and should not be interpreted as investment, financial, or other advice. All investments, including crypto indices, involve risk. Past performance does not guarantee future results. Please do your own research and consult a qualified advisor before making investment decisions.

If you've been waiting for the "right time" to invest in cryptocurrency, 2025 represents a convergence of factors that may never align this perfectly again. Regulatory frameworks are solidifying. Institutional adoption is accelerating. AI technology has matured. Market infrastructure has professionalized. And most importantly, proven systems like Token Metrics AI indices have track records demonstrating consistent success through multiple market cycles.
The question isn't whether to invest in crypto—that ship has sailed as institutional giants commit billions. The question is how to invest smartly, efficiently, and with the best chance of success. Here's why 2025 is your optimal entry point, and why Token Metrics indices offer the ideal vehicle for capturing this opportunity.
For years, cryptocurrency existed in regulatory limbo. Investors faced uncertainty about legal status, tax treatment, and government attitudes. That era is ending.
The European MiCA Framework
Europe's Markets in Crypto-Assets (MiCA) regulation, fully implemented in 2025, provides the first comprehensive regulatory framework for crypto markets. This standardization removes legal uncertainty and opens doors for institutional capital that previously stayed on the sidelines.
U.S. Regulatory Evolution
The approval of Bitcoin spot ETFs in 2024 marked a watershed moment. Professional investors now hold $27.4 billion in U.S. Bitcoin ETFs, signaling mainstream acceptance. Further regulatory clarity continues emerging as the SEC and other agencies develop consistent frameworks.
What This Means for You
Regulatory clarity reduces risk. When governments establish clear rules, legitimate projects thrive while scams get eliminated. Token Metrics benefits directly—its AI-powered selection process now operates in a more transparent market where quality projects are easier to identify and verify.
The Token Metrics Advantage: With regulations favoring legitimate projects, Token Metrics' fundamental analysis of team quality, code audits, and regulatory compliance becomes even more valuable. The platform automatically filters for projects meeting evolving regulatory standards.
Individual retail investors no longer dominate crypto markets. Institutions are entering aggressively, bringing professionalism, liquidity, and validation.
The Numbers Don't Lie
According to a Coinbase institutional survey, 67% of professional investors plan to increase their crypto holdings in 2025, with 24% expecting to "significantly increase" exposure—up from just 16% in 2024.
Family offices and hedge funds are leading this shift, reflecting growing conviction in crypto's performance advantage and structural role in diversified portfolios.
Token Metrics Institutional-Grade Approach
Token Metrics was built with institutional-quality standards from day one. The platform's AI analyzes over 80 data points per token—the same rigorous approach used by professional fund managers.
As institutions flood into crypto, having institutional-grade tools becomes essential for retail investors to compete. Token Metrics democratizes access to professional strategies that previously required million-dollar minimums and expert teams.
Artificial intelligence in crypto investing isn't experimental anymore—it's proven, refined, and delivering consistent results.
From Experiment to Established System
Token Metrics has been developing and refining its AI models since 2017. The platform now has:
Why AI Matters More in 2025
Markets are more complex than ever. With 6,000+ cryptocurrencies, countless narratives, and 24/7 global trading, human analysis can't keep pace. AI processes information at scale, identifies patterns humans miss, and executes decisions without emotional interference.
Real-World Impact: During 2024's market volatility, Token Metrics AI indices automatically adjusted allocations, reducing exposure before major corrections and increasing positions during recoveries. Human investors watching news and making emotional decisions significantly underperformed.
The Learning Advantage
Token Metrics' AI doesn't just analyze—it learns. Every market cycle, token launch, and trend adds to the system's knowledge base. By 2025, the AI has experienced scenarios that new investors have never seen, providing a cumulative learning advantage.
Click here to signup for free trial account!
Remember when buying crypto meant sketchy exchanges, confusing wallets, and constant security concerns? That era is over.
Modern Crypto Infrastructure
Lower Barriers to Entry
Five years ago, investing in crypto required technical knowledge and tolerance for poor user experiences. Today, the experience matches traditional investing in ease and professionalism.
Token Metrics Simplification: The platform abstracts away remaining complexity. You don't need to understand blockchain technology or navigate confusing interfaces. Token Metrics provides clear guidance—what to buy, when to rebalance, and how to manage risk.
Cryptocurrency markets historically follow four-year cycles tied to Bitcoin halving events. Understanding where we are in this cycle provides strategic advantage.
The Halving Impact
Bitcoin halvings occur every four years, reducing new supply and historically triggering major bull markets. The most recent halving occurred in April 2024.
Historical Pattern:
Where We Are Now
We're in the early-to-mid phase of the post-halving bull cycle. Historically, the strongest gains occur 12-18 months after halving events. This positions 2025 as potentially the optimal year within the current cycle.
The Token Metrics Edge: Rather than trying to time individual token purchases, Token Metrics indices automatically adjust allocations based on market phase. During bull markets, the AI increases exposure to high-momentum opportunities. During corrections, it defensively reallocates to preserve capital.
One of the most significant developments in 2025 is the tokenization of traditional assets onto blockchain infrastructure.
The Tokenization Revolution
Tokenized real-world assets (RWAs) have surged past $22.5 billion on-chain, up nearly 6% in recent months alone. This represents stocks, bonds, real estate, commodities, and other traditional assets moving onto blockchain rails.
Why This Matters: As traditional finance merges with crypto infrastructure, the total addressable market expands. Token Metrics RWA indices provide exposure to this significant emerging sector that bridges conventional and digital finance.
Institutional Bridge
RWAs provide familiar territory institutions need to increase crypto allocations. Rather than purely speculative tokens, these represent ownership in tangible assets with established valuations. This legitimacy accelerates institutional adoption and feeds broader crypto market growth.
Token Metrics RWA Index: Specifically designed to capture the tokenization trend, this index provides diversified exposure to projects building the infrastructure for traditional asset tokenization.
2025's macroeconomic environment makes diversification across asset classes essential.
Economic Uncertainty Drivers
Crypto's Diversification Benefits
Research demonstrates that modest crypto allocations of 1-3% have historically improved portfolio efficiency, delivering improved returns, higher Sharpe ratios, and limited drawdown impact when structured appropriately.
Token Metrics Solution: Rather than taking chances on individual crypto picks, indices provide systematic exposure that enhances overall portfolio diversification while actively managing crypto-specific risks through rebalancing and quality screening.
Understanding why 2025 is optimal means nothing without action. Here is a practical roadmap for potential investors:
The 2025 Advantage Window
While crypto will exist for decades, specific windows offer optimal entry points. The current convergence of regulatory clarity, institutional adoption, AI maturity, and cycle timing creates a rare alignment.
Historical Precedent: Investors who entered during similar optimal windows in 2016 or early 2020 significantly outperformed those who waited for "more certainty." By the time most people feel comfortable, the biggest gains have already occurred.
No investment comes without risk. Understanding and managing these risks positions you for informed decision-making.
Every historic investment opportunity shares common characteristics: identifiable catalysts, improving fundamentals, and mainstream skepticism that keeps many participants on the sidelines.
In 2025, crypto checks every box. The infrastructure, regulations, and institutional participation that skeptics demanded are now in place. The technology is mature. The track records are established. Yet many investors still wait, searching for more "certainty," which often results in missed opportunities.
Token Metrics removes common barriers:
The question is whether you'll utilize this convergence of favorable factors or watch from the sidelines as another cycle passes.
Optimal investment windows are rarely obvious in the moment. By the time everyone agrees crypto is "safe," the most significant opportunities may have passed.
Starting with even a modest allocation to Token Metrics indices can offer exposure to 2025's alignment of regulatory clarity, institutional adoption, AI insight, and market cycle timing. Exploring the indices gives you the chance to leverage a historically rare convergence of positive conditions.
Visit Token Metrics today, explore the indices, and take the first step toward capitalizing on this opportunity. The perfect time to invest rarely announces itself—it arrives quietly for those who are prepared.
Click here to signup for free trial account!
Discover Crypto Gems with Token Metrics AI
Token Metrics uses AI-powered analysis to help you uncover profitable opportunities in the crypto market. Get Started For Free
2025 brings together regulatory clarity, institutional adoption, AI advancements, and a post-halving market cycle, creating an environment with enhanced infrastructure and data-driven tools.
Token Metrics utilizes AI models analyzing over 80 data points per token, providing index products, research, and automated strategies to help users navigate complex markets without extensive manual research.
No, platforms like Token Metrics simplify the process, allowing users to access diversified indices and research insights with minimal technical expertise or blockchain knowledge.
Risks include market volatility, evolving regulation, technology vulnerabilities, and unpredictable cycles. Systematic, data-informed approaches and risk management strategies can help address these factors.
Yes, Token Metrics indices are designed to provide diversified exposure to various segments of the crypto market, aiding overall portfolio risk management and balancing individual token exposure.
This content is for informational and educational purposes only and does not constitute investment advice or an offer to buy or sell any cryptocurrency or financial product. Always conduct your own research and consult a qualified financial professional before making investment decisions. Past performance is not indicative of future results. Token Metrics does not guarantee any specific outcomes.

Billions of dollars vanish from the crypto markets annually, not due to scams or hacks—but simply through common, avoidable mistakes. Recent data reveals that 95% of cryptocurrency traders lose money, and the root causes are rarely market volatility or bad luck. Instead, it’s everyday errors in judgment, strategy, and execution. If you have ever bought a token near its top, held a losing position in hopes of a turnaround, or felt overwhelmed by countless investment choices, you’re far from alone. These patterns impact millions, draining away both capital and peace of mind.
The good news? Token Metrics AI indices are designed to address these exact issues. In this article, we’ll examine the five most costly crypto investing mistakes—and show how Token Metrics’ systematic approach helps mitigate them all.
The Problem
You notice a token trending on social media, backed by massive price gains and hype. FOMO prompts you to invest, even though you don’t fully understand the project. For example, in 2021, the Squid Game Token rocketed 86,000% in just a week due to hype linked to the Netflix series. Investors poured in millions—only for a "rug pull" to destroy its value, leaving those who bought at the top with 99.99% losses.
Why This Happens
How Token Metrics Solves It
Token Metrics uses AI and machine learning to analyze over 80 data points per token, including fundamentals, code quality, sentiment, and market indicators
The result? Only projects passing strict fundamental analysis are included in Token Metrics indices. Hype-driven projects are filtered out, helping protect investors from unreliable assets.
The Problem
Emotion-driven timing—buying during surges and selling during dips—is one of the biggest sources of loss for crypto investors. Research indicates the average investor underperforms basic buy-and-hold by 30–50% per year due to such decisions.
Why This Happens
How Token Metrics Solves It
Token Metrics indices rebalance weekly, monthly, or quarterly using algorithmic rules. The platform’s AI features:
Example: If Solana’s strength increases, Token Metrics may raise its allocation; as momentum fades, the index reduces exposure—helping avoid entire declines that manual investors often experience. This systematic, emotion-free timing can produce more consistent results than self-directed trading.
The Problem
Concentrating heavily in a single token exposes investors to severe downside. In 2022, many held over 50% of their portfolio in Luna/UST and suffered disproportionate losses when the protocol collapsed.
Why This Happens
How Token Metrics Solves It
Token Metrics indices deliver automatic diversification:
Sample Portfolio: 30% Bitcoin, 25% Ethereum, 15% Solana, 10% Chainlink, 8% Avalanche, 7% Polygon, 5% other high-quality assets. If one token sees trouble, most of the portfolio remains protected—a proven benefit highlighted by Token Metrics’ multi-year track record of outperformance with diversified baskets.
The Problem
Without regular review, portfolio allocation drifts: winners may become overexposed, losers get neglected, and emotional attachments override discipline. Studies show that investors who fail to rebalance underperform by 15–20% annually due to uncontrolled risk and missed opportunities.
Why This Happens
How Token Metrics Solves It
All Token Metrics indices are systematically rebalanced on a set schedule. For trading indices, rebalancing happens weekly—well-performing tokens are trimmed, underperformers removed, and new opportunities integrated. For investor indices, monthly or quarterly rebalances keep long-term allocations aligned while minimizing transaction costs.
Example: Instead of riding a token from $10 to $100 and back to $30, Token Metrics trims positions in stages, locking in gains before major declines. This systematic process produces more stable outcomes than manual, emotion-driven management.
The Problem
With thousands of crypto assets, dozens of exchanges, and endless advice, many investors get stuck researching without ever taking action—or constantly shift strategies without conviction. During recent bull markets, analysis paralysis alone led to missed opportunities for significant growth.
Why This Happens
How Token Metrics Solves It
Token Metrics offers a simple, three-step process:
From there, AI research handles token analysis, portfolio selection, rebalancing, and ongoing risk management—reducing complexity and saving hours each week.
This all-in-one approach makes it possible to manage your crypto allocation in an hour per month—while leveraging systematic, AI-driven best practices.
What sets Token Metrics apart for investors seeking robust, repeatable results?
Recognizing these mistakes is important, but building sound habits is what drives meaningful outcomes. Most investors have made at least one of these errors. The difference comes from implementing systematic solutions.
Every day of delay or indecision can contribute to preventable loss or missed growth, while proven systems work to manage changing markets with discipline.
Subscription costs, typically $50–200 monthly, are modest compared to the savings from avoiding just a single significant error. Many users note that Token Metrics’ AI prevents multiple costly mistakes each year.
The five mistakes covered—buying hype, poor timing, concentration, inconsistent management, and information overload—are among the most common causes of investor losses in crypto. Token Metrics’ indices offer systematic processes that remove emotion, foster diversification, drive consistent rebalancing, and simplify complex decisions. With tools built on institutional-grade AI, you can transform passive mistakes into active mastery. You don’t need to become a full-time trader or blockchain expert; you need proven systems designed to avoid the most frequent pitfalls.
Move beyond trial and error, and leverage AI-powered intelligence for smarter investing decisions with Token Metrics. Make your next move one of clarity and confidence.
Discover Crypto Gems with Token Metrics AI
Token Metrics uses AI-powered analysis to help you uncover profitable opportunities in the crypto market. Get Started For Free
Token Metrics indices are algorithmically created baskets of cryptocurrencies selected using AI-driven research. They are rebalanced systematically based on market signals, offering diversified exposure and removing emotional bias.
Token Metrics rigorously evaluates project fundamentals, code quality, market viability, and liquidity, filtering out projects driven by short-term hype or weak fundamentals. Only tokens passing strict criteria are considered for inclusion in indices.
Users can choose indices aligned with different investor profiles, timeframes, and styles. While each index follows an algorithmic process, you can select the one that best matches your strategy and goals.
Indices are built for risk management, including diversification limits, liquidity filters, systematic rebalancing, and AI-powered detection of changing market conditions to mitigate portfolio risk.
Token Metrics is accessible for all experience levels. Beginners benefit from simplified AI-driven selection, while advanced users can access data, detailed reports, and deeper tools for more hands-on analysis.
This content is for informational and educational purposes only and does not constitute investment advice or a recommendation to buy or sell any digital assets. Cryptocurrencies are volatile and carry risk; always conduct your own research and consider professional advice before making financial decisions.

If you’re new to cryptocurrency investing, feeling overwhelmed is common. With more than 6,000 cryptocurrencies, a multitude of trading platforms, and round-the-clock markets, knowing where to begin can seem daunting.
Fortunately, you don’t need to master blockchain or spend countless hours analyzing charts. Token Metrics AI indices offer a straightforward, research-driven entry point for beginners, removing complexity and minimizing guesswork.
Just as the S&P 500 index simplifies stock investing, crypto indices provide diversified exposure to quality assets through a single portfolio. This guide unpacks everything you need to know to start with Token Metrics AI indices—confidently and securely.
A crypto index is a curated basket of cryptocurrencies, each selected and managed according to specific criteria. Rather than individually picking tokens, investors gain access to pre-built portfolios that automatically adapt to market changes.
Token Metrics integrates artificial intelligence and machine learning to evaluate over 80 data points for every crypto asset, including
The AI synthesizes this data to select top-performing cryptocurrencies for each index and automatically rebalances portfolios on a schedule (weekly, monthly, or quarterly), aligned with your chosen investment strategy.
Token Metrics provides 14+ indices tailored to various goals and risk profile
Tokens within each index are selected and weighted by Token Metrics algorithms to maintain the desired risk-reward balance.
Beginners are often best served by starting with the Balanced Investor Index, which offers quarterly or annual rebalancing. This approach provides diversified exposure to proven projects, infrequent maintenance, and space to learn progressively.
As your familiarity grows, consider exploring active trading or sector-driven strategies according to your comfort with market cycles and research.
Ready to make the leap? Here’s a step-by-step road map:
Dollar-cost averaging (DCA) is a strategy where investors commit a fixed amount at regular intervals—regardless of market conditions.
A simple DCA approach: Invest the same sum on the same day each month into your Token Metrics index allocations, building wealth methodically over time.
Adopt strict security practices from the start:
Crypto is known for outsized moves, but results vary with market cycles:
Establish expectations over a five-year window, prioritizing steady growth and disciplined allocation rather than chasing quick profits. Historical performance is informative but not predictive.
A methodical approach helps you evolve:
The most impactful step is starting. Use the following checklist to guide your first month:
Using Token Metrics AI indices places beginners at a distinct advantage—minimizing rookie errors and capitalizing on institutional-grade analysis. Follow core tenets: start modestly, prioritize learning, stay disciplined, diversify, and rebalance periodically.
The crypto economy offers meaningful opportunities for calculated, patient investors. With a focused, research-driven approach like that offered by Token Metrics, you gain access to sophisticated strategies and insights from your very first day.
Your path to building a resilient crypto portfolio begins with a single, informed choice.
Discover Crypto Gems with Token Metrics AI
Token Metrics uses AI-powered analysis to help you uncover profitable opportunities in the crypto market. Get Started For Free
A crypto index is a diversified portfolio of cryptocurrencies chosen based on specific themes, fundamental criteria, or market conditions. Token Metrics’ indices use AI and data-driven analytics to select and rebalance holdings with the goal of simplifying exposure to the crypto market.
Token Metrics leverages AI to analyze thousands of data points, automating research and portfolio selection that would be time-consuming to perform manually. This reduces bias, streamlines asset rotation, and enhances risk management compared to individual selection.
While portfolio allocation depends on individual circumstances, many educational resources suggest a starting range of 3–10% of investable assets for beginners. Always assess personal risk tolerance before choosing an allocation.
DCA can help beginners avoid market timing pitfalls by investing a fixed amount consistently over time. This method encourages discipline and can smooth out volatility when followed long-term.
Prioritize security by enabling two-factor authentication, using strong passwords, keeping major holdings in a hardware wallet, and never sharing private keys. Avoid posting sensitive data or investment details online.
This article is for informational and educational purposes only. It does not constitute financial, investment, or tax advice. Cryptocurrency investing involves risk, and past performance is not indicative of future results. Always conduct your own research and seek independent professional advice before making investment decisions.


9450 SW Gemini Dr
PMB 59348
Beaverton, Oregon 97008-7105 US
.svg)


.png)
Token Metrics Media LLC is a regular publication of information, analysis, and commentary focused especially on blockchain technology and business, cryptocurrency, blockchain-based tokens, market trends, and trading strategies.
Token Metrics Media LLC does not provide individually tailored investment advice and does not take a subscriber’s or anyone’s personal circumstances into consideration when discussing investments; nor is Token Metrics Advisers LLC registered as an investment adviser or broker-dealer in any jurisdiction.
Information contained herein is not an offer or solicitation to buy, hold, or sell any security. The Token Metrics team has advised and invested in many blockchain companies. A complete list of their advisory roles and current holdings can be viewed here: https://tokenmetrics.com/disclosures.html/
Token Metrics Media LLC relies on information from various sources believed to be reliable, including clients and third parties, but cannot guarantee the accuracy and completeness of that information. Additionally, Token Metrics Media LLC does not provide tax advice, and investors are encouraged to consult with their personal tax advisors.
All investing involves risk, including the possible loss of money you invest, and past performance does not guarantee future performance. Ratings and price predictions are provided for informational and illustrative purposes, and may not reflect actual future performance.


%20Price%20Prediction%202025%2C%202030%20-%20Forecast%20Analysis.png)


.png)

%20Price%20Prediction%20.webp)


%20Price%20Prediction.webp)


%20Price%20Prediction%20Analysis%20-%20Can%20it%20Reach%20%24500%20in%20Future_.png)


