


.png)
.png)

.png)
.png)


.png)


.png)
.png)


.png)


.png)
%201%20(1).png)

.png)


.png)


.png)
.png)


.png)


.png)

.png)
.png)
.png)
.png)
.png)
.png)
.png)
.png)
.png)


.png)


.png)

.png)


.png)


.png)
.png)


Research
Top Crypto Trading Platforms in 2025
When it comes to crypto trading platforms, Token Metrics is not an exchange, but a crypto analytics and crypto trading intelligence platform powered by AI.
Token Metrics Team
10 min


%201.svg)
%201.svg)
Big news: We’re cranking up the heat on AI-driven crypto analytics with the launch of the Token Metrics API and our official SDK (Software Development Kit). This isn’t just an upgrade – it's a quantum leap, giving traders, hedge funds, developers, and institutions direct access to cutting-edge market intelligence, trading signals, and predictive analytics.
Crypto markets move fast, and having real-time, AI-powered insights can be the difference between catching the next big trend or getting left behind. Until now, traders and quants have been wrestling with scattered data, delayed reporting, and a lack of truly predictive analytics. Not anymore.
The Token Metrics API delivers 32+ high-performance endpoints packed with powerful AI-driven insights right into your lap, including:
Getting started with the Token Metrics API is simple:
At Token Metrics, we believe data should be decentralized, predictive, and actionable.
The Token Metrics API & SDK bring next-gen AI-powered crypto intelligence to anyone looking to trade smarter, build better, and stay ahead of the curve. With our official SDK, developers can plug these insights into their own trading bots, dashboards, and research tools – no need to reinvent the wheel.
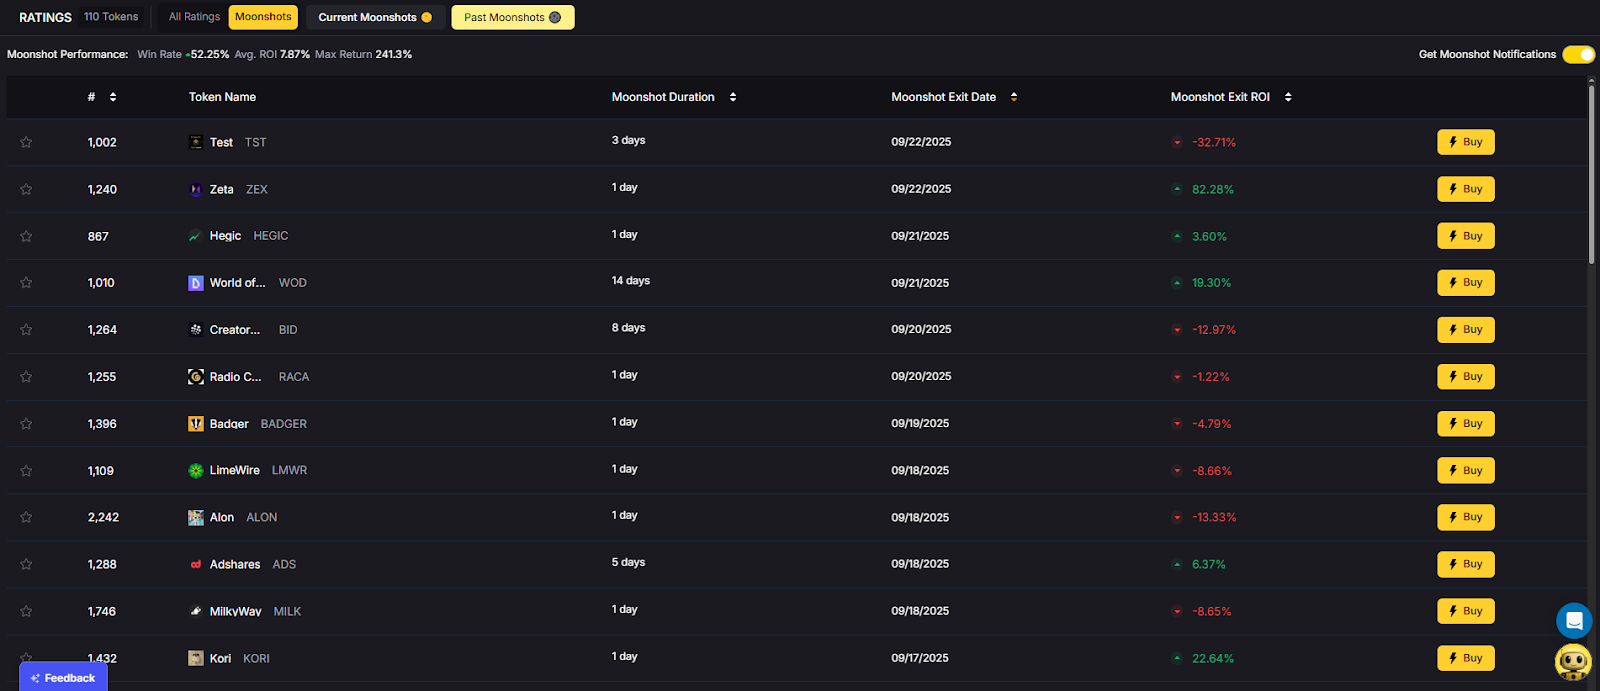
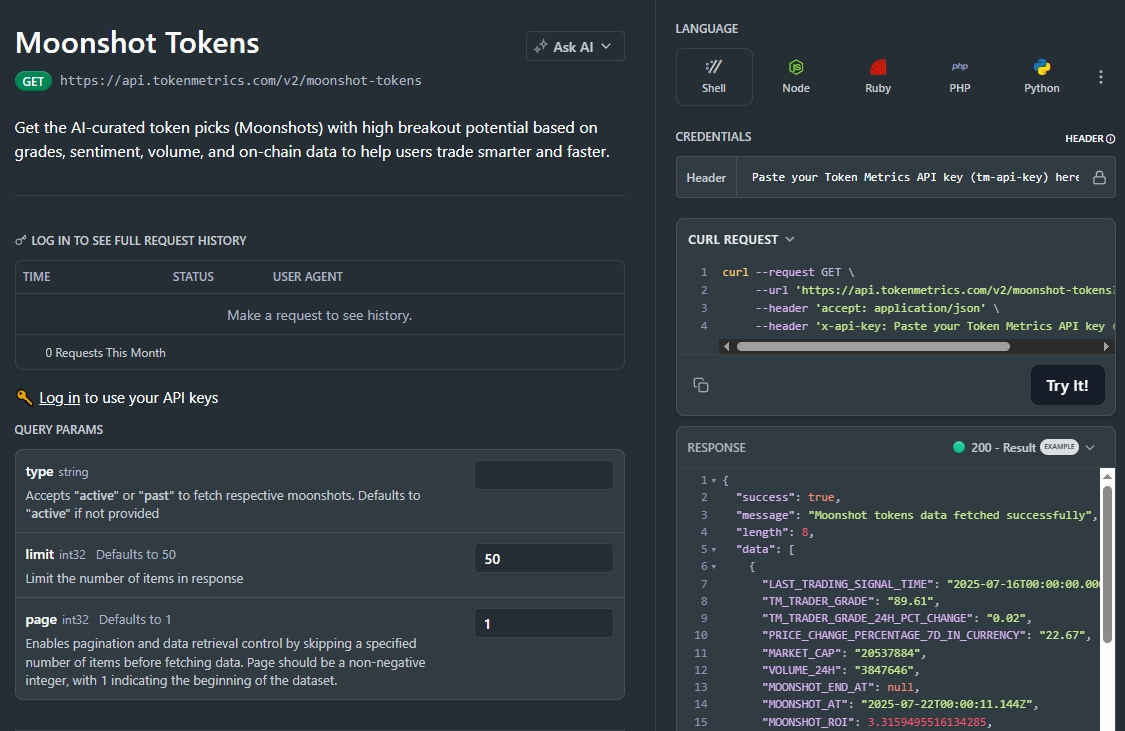
The biggest gains in crypto rarely come from the majors. They come from Moonshots—fast-moving tokens with breakout potential. The Moonshots API surfaces these candidates programmatically so you can rank, alert, and act inside your product. In this guide, you’ll call /v2/moonshots, display a high-signal list with TM Grade and Bullish tags, and wire it into bots, dashboards, or screeners in minutes. Start by grabbing your key at Get API Key, then Run Hello-TM and Clone a Template to ship fast.
Discovery that converts. Users want more than price tickers—they want a curated, explainable list of high-potential tokens. The moonshots API encapsulates multiple signals into a short list designed for exploration, alerts, and watchlists you can monetize.
Built for builders. The endpoint returns a consistent schema with grade, signal, and context so you can immediately sort, badge, and trigger workflows. With predictable latency and clear filters, you can scale to dashboards, mobile apps, and headless bots without reinventing the discovery pipeline.
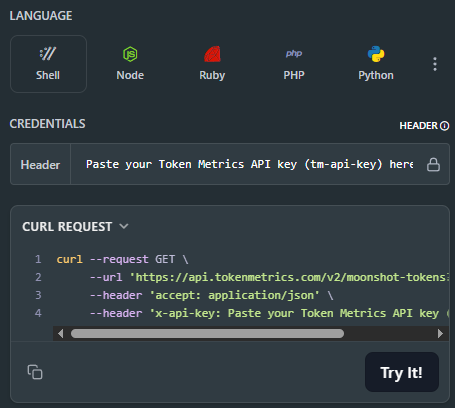
The Moonshots API cURL request is right there in the top right of the API Reference. Grab it and start tapping into the potential!
👉 Keep momentum: Get API Key • Run Hello-TM • Clone a Template
Fork a screener or alerting template, plug your key, and deploy. Validate your environment with Hello-TM. When you scale users or need higher limits, compare API plans.
The Moonshots endpoint aggregates a set of evidence—often combining TM Grade, signal state, and momentum/volume context—into a shortlist of breakout candidates. Each row includes a symbol, grade, signal, and timestamp, plus optional reason tags for transparency.
For UX, a common pattern is: headline list → token detail where you render TM Grade (quality), Trading Signals (timing), Support/Resistance (risk placement), Quantmetrics (risk-adjusted performance), and Price Prediction scenarios. This lets users understand why a token was flagged and how to act with risk controls.
Polling vs webhooks. Dashboards typically poll with short-TTL caching. Alerting flows use scheduled jobs or webhooks (where available) to smooth traffic and avoid duplicates. Always make notifications idempotent.
1) What does the Moonshots API return?
A list of breakout candidates with fields such as symbol, tm_grade, signal (often Bullish/Bearish), optional reason tags, and updated_at. Use it to drive discover tabs, alerts, and watchlists.
2) How fresh is the list? What about latency/SLOs?
The endpoint targets predictable latency and timely updates for dashboards and alerts. Use short-TTL caching and queued jobs/webhooks to avoid bursty polling.
3) How do I use Moonshots in a trading workflow?
Common stack: Moonshots for discovery, Trading Signals for timing, Support/Resistance for SL/TP, Quantmetrics for sizing, and Price Prediction for scenario context. Always backtest and paper-trade first.
4) I saw results like “+241%” and a “7.5% average return.” Are these guaranteed?
No. Any historical results are illustrative and not guarantees of future performance. Markets are risky; use risk management and testing.
5) Can I filter the Moonshots list?
Yes—pass parameters like min_grade, signal, and limit (as supported) to tailor to your audience and keep pages fast.
6) Do you provide SDKs or examples?
REST works with JavaScript and Python snippets above. Docs include quickstarts, Postman collections, and templates—start with Run Hello-TM.
7) Pricing, limits, and enterprise SLAs?
Begin free and scale up. See API plans for rate limits and enterprise options.
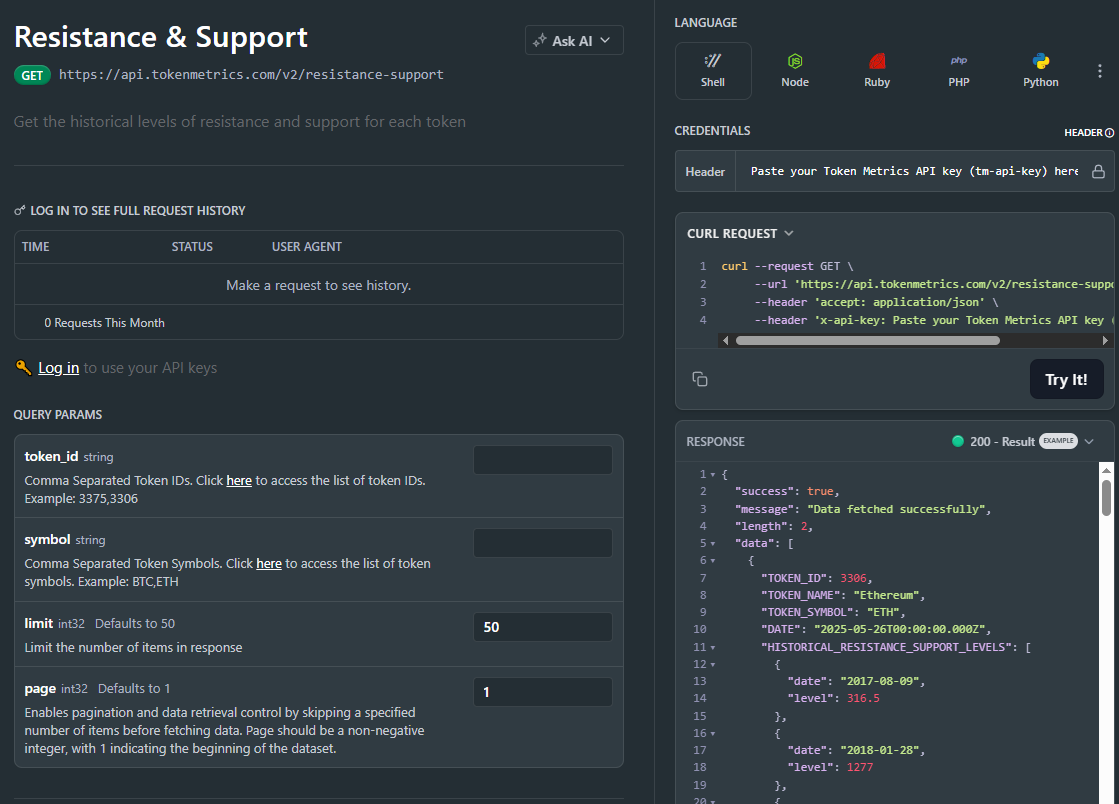
Most traders still draw lines by hand in TradingView. The support and resistance API from Token Metrics auto-calculates clean support and resistance levels from one request, so your dashboard, bot, or alerts can react instantly. In minutes, you’ll call /v2/resistance-support, render actionable levels for any token, and wire them into stops, targets, or notifications. Start by grabbing your key on Get API Key, then Run Hello-TM and Clone a Template to ship a production-ready feature fast.
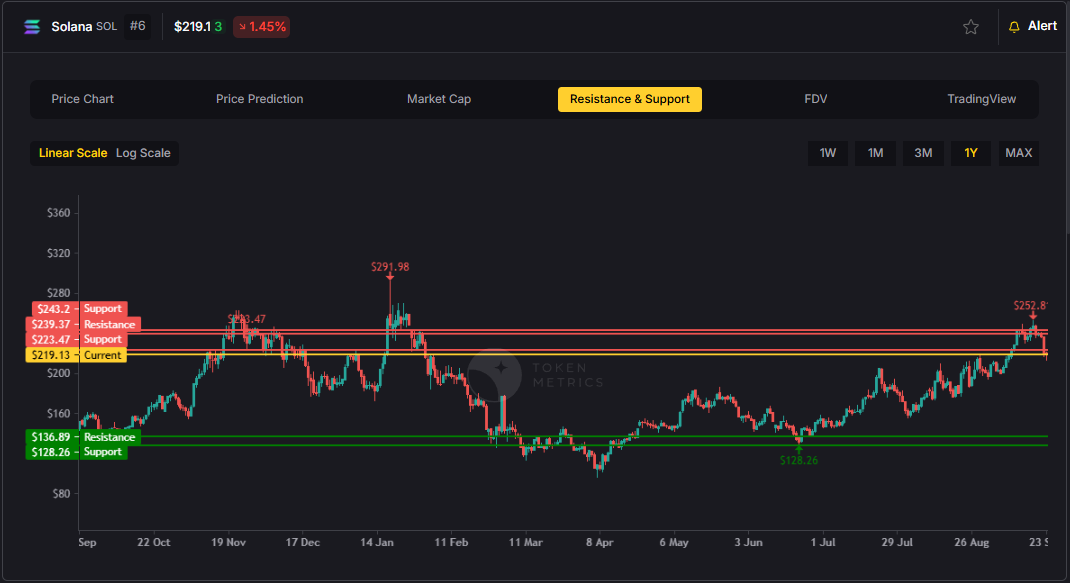
Precision beats guesswork. Hand-drawn lines are subjective and slow. The support and resistance API standardizes levels across assets and timeframes, enabling deterministic stops and take-profits your users (and bots) can trust.
Production-ready by design. A simple REST shape, predictable latency, and clear semantics let you add levels to token pages, automate SL/TP alerts, and build rule-based execution with minimal glue code.
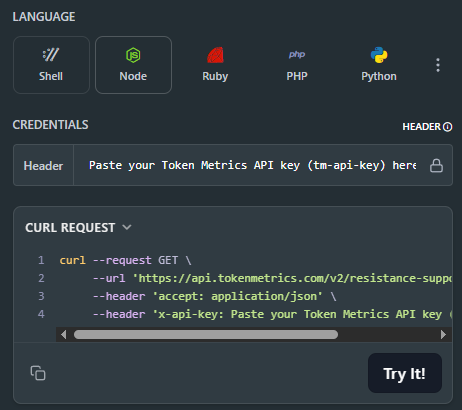
Need the Support and Resistance data? The cURL request for it is in the top right of the API Reference for quick access.
👉 Keep momentum: Get API Key • Run Hello-TM • Clone a Template
Kick off with our quickstarts—fork a bot or dashboard template, plug your key, and deploy. Confirm your environment by Running Hello-TM. When you’re scaling or need webhooks/limits, review API plans.
The Support/Resistance endpoint analyzes recent price structure to produce discrete levels above and below current price, along with strength indicators you can use for priority and styling. Query /v2/resistance-support?symbol=<ASSET>&timeframe=<HORIZON> to receive arrays of level objects and timestamps.
Polling vs webhooks. For dashboards, short-TTL caching and batched fetches keep pages snappy. For bots and alerts, use queued jobs or webhooks (where applicable) to avoid noisy, bursty polling—especially around market opens and major events.
1) What does the Support & Resistance API return?
A JSON payload with arrays of support and resistance levels for a symbol (and optional timeframe), each with a price and strength indicator, plus an update timestamp.
2) How timely are the levels? What are the latency/SLOs?
The endpoint targets predictable latency suitable for dashboards and alerts. Use short-TTL caching for UIs, and queued jobs or webhooks for alerting to smooth traffic.
3) How do I trigger alerts or trades from levels?
Common patterns: alert when price is within X% of a level, touches a level, or breaks beyond with confirmation. Always make downstream actions idempotent and respect rate limits.
4) Can I combine levels with other endpoints?
Yes—pair with /v2/trading-signals for timing, /v2/tm-grade for quality context, and /v2/quantmetrics for risk sizing. This yields a complete decide-plan-execute loop.
5) Which timeframe should I use?
Intraday bots prefer shorter horizons; swing/position dashboards use daily or higher-timeframe levels. Offer a timeframe toggle and cache results per setting.
6) Do you provide SDKs or examples?
Use the REST snippets above (JS/Python). The docs include quickstarts, Postman collections, and templates—start with Run Hello-TM.
7) Pricing, limits, and enterprise SLAs?
Begin free and scale as you grow. See API plans for rate limits and enterprise SLA options.
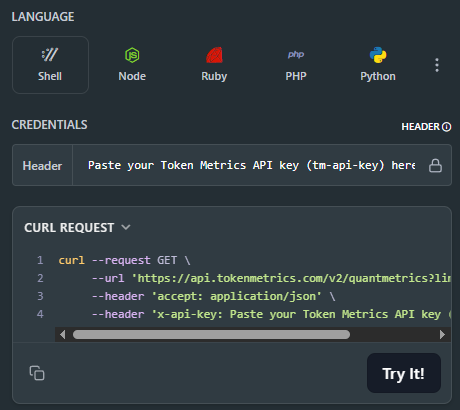
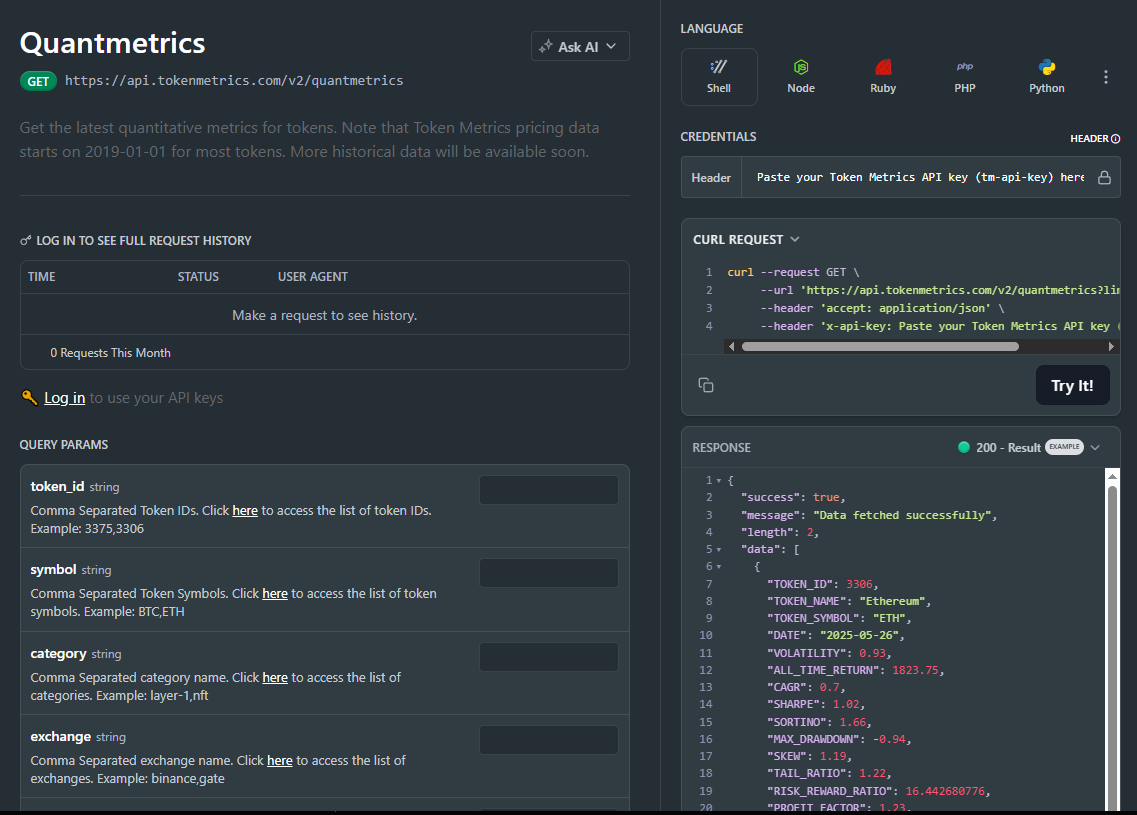
Most traders see price—quants see probabilities. The Quantmetrics API turns raw performance into risk-adjusted stats like Sharpe, Sortino, volatility, drawdown, and CAGR so you can compare tokens objectively and build smarter bots and dashboards. In minutes, you’ll query /v2/quantmetrics, render a clear performance snapshot, and ship a feature that customers trust. Start by grabbing your key at Get API Key, Run Hello-TM to verify your first call, then Clone a Template to go live fast.
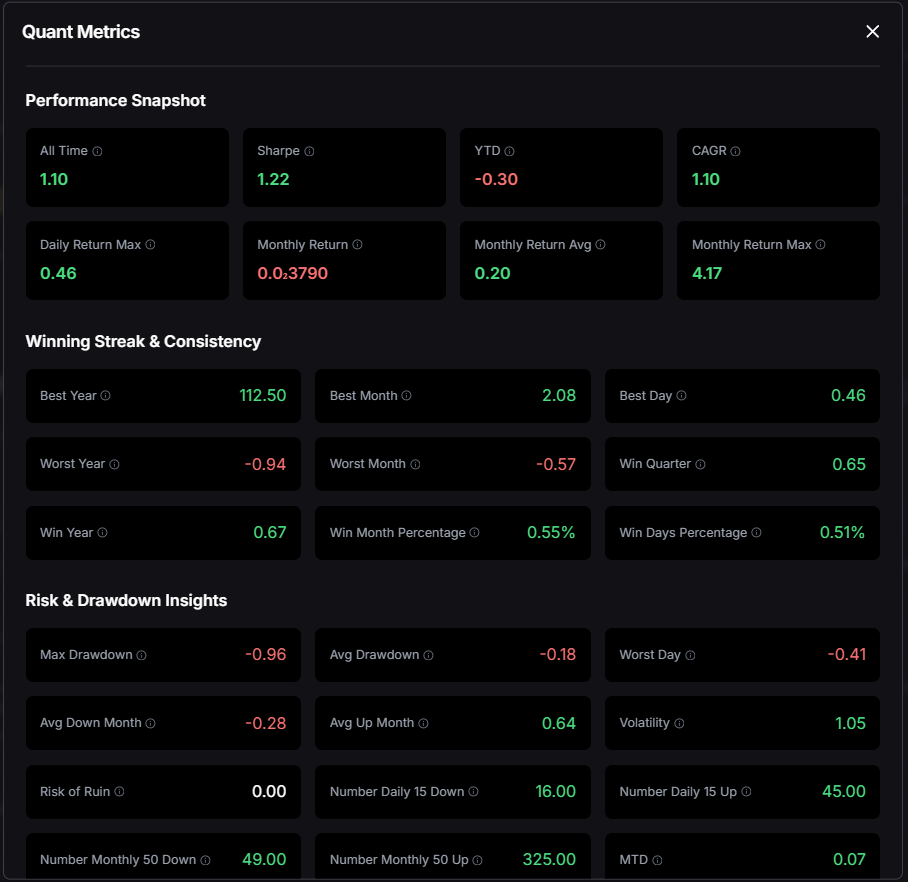
Risk-adjusted truth beats hype. Price alone hides tail risk and whipsaws. Quantmetrics compresses edge, risk, and consistency into metrics that travel across assets and timeframes—so you can rank universes, size positions, and communicate performance like a pro.
Built for dev speed. A clean REST schema, predictable latency, and easy auth mean you can plug Sharpe/Sortino into bots, dashboards, and screeners without maintaining your own analytics pipeline. Pair with caching and batching to serve fast pages at scale.
The Quant Metrics cURL request is located in the top right of the API Reference, allowing you to easily integrate it with your application.
👉 Keep momentum: Get API Key • Run Hello-TM • Clone a Template
Kick off from quickstarts in the docs—fork a dashboard or screener template, plug your key, and deploy in minutes. Validate your environment with Run Hello-TM; when you need more throughput or webhooks, compare API plans.
Quantmetrics computes risk-adjusted performance over a chosen lookback (e.g., 30d, 90d, 1y). You’ll receive a JSON snapshot with core statistics:
Call /v2/quantmetrics?symbol=<ASSET>&window=<LOOKBACK> to fetch the current snapshot. For dashboards spanning many tokens, batch symbols and apply short-TTL caching. If you generate alerts (e.g., “Sharpe crossed 1.5”), run a scheduled job and queue notifications to avoid bursty polling.
1) What does the Quantmetrics API return?
A JSON snapshot of risk-adjusted metrics (e.g., Sharpe, Sortino, volatility, max drawdown, CAGR) for a symbol and lookback window—ideal for ranking, sizing, and dashboards.
2) How fresh are the stats? What about latency/SLOs?
Responses are engineered for predictable latency. For heavy UI usage, add short-TTL caching and batch requests; for alerts, use scheduled jobs or webhooks where available.
3) Can I use Quantmetrics to size positions in a live bot?
Yes—many quants size inversely to volatility or require Sharpe ≥ X to trade. Always backtest and paper-trade before going live; past results are illustrative, not guarantees.
4) Which lookback window should I choose?
Short windows (30–90d) adapt faster but are noisier; longer windows (6–12m) are steadier but slower to react. Offer users a toggle and cache each window.
5) Do you provide SDKs or examples?
REST is straightforward (JS/Python above). Docs include quickstarts, Postman collections, and templates—start with Run Hello-TM.
6) Polling vs webhooks for quant alerts?
Dashboards usually use cached polling. For threshold alerts (e.g., Sharpe crosses 1.0), run scheduled jobs and queue notifications to keep usage smooth and idempotent.
7) Pricing, limits, and enterprise SLAs?
Begin free and scale up. See API plans for rate limits and enterprise SLA options.
.png)
Liquidity farming just got a major upgrade. Token Metrics AI ($TMAI) has launched its first liquidity incentive campaign on Merk — and it’s designed for yield hunters looking to earn fast, with no lockups, no gimmicks, and real rewards from Day 1.
For two weeks, liquidity providers can earn high daily rewards across three different pools. All rewards are paid in $TMAI and distributed continuously — block by block — through the Merkl platform.
Pool Starting APR % Total Rewards (14 days) Current TVL
Aerodrome WETH–TMAI 150% 16.79M TMAI (~$11,000) $86,400
Uniswap v3 USDC–TMAI 200% 14.92M TMAI (~$9,800) $19,900
Balancer 95/5 WETH–TMAI 200% 5.60M TMAI (~$3,700) $9,500
These pools are live and actively paying rewards. APR rates aren’t displayed on Merkl until the first 24 hours of data are available — but early providers will already be earning.
1. Turbo Rewards for a Short Time
This isn’t a slow-drip farm. The TMAI Merkl campaign is designed to reward action-takers. For the first few days, yields are especially high — thanks to low TVL and full daily reward distribution.
2. No Lockups or Waiting Periods
You can provide liquidity and withdraw it anytime — even the same day. There are no lockups, no vesting, and no delayed payout mechanics. All rewards accrue automatically and are claimable through Merkl.
3. Choose Your Risk Profile
You get to pick your exposure.
4. Influence the Future of TMAI Yield Farming
This campaign isn’t just about yield — it’s a test. If enough users participate and volume grows, the Token Metrics Treasury will consider extending liquidity rewards into Q3 and beyond. That means more TMAI emissions, longer timelines, and consistent passive income opportunities for LPs.
5. Built for Transparency and Speed
Rewards are distributed via Merkl by Angle Labs, a transparent, gas-efficient platform for programmable liquidity mining. You can see the exact rewards, TVL, wallet counts, and pool analytics at any time.
Getting started is simple. You only need a crypto wallet, some $TMAI, and a matching asset (either WETH or USDC, depending on the pool).
Step-by-step:
This is a rare opportunity to earn serious rewards in a short amount of time. Whether you’re new to liquidity mining or a DeFi veteran, the TMAI Merkl campaign is built for speed, flexibility, and transparency.
You’re still early. The best yields happen in the first days, before TVL rises and APR stabilizes. Dive in now and maximize your returns while the turbo phase is still on.
👉 Join the Pools and Start Earning

The hunt for a dependable Crypto API normally ends in a graveyard of half-maintained GitHub repos, flaky RPC endpoints, and expensive enterprise feeds that hide the true cost behind a sales call. Developers waste days wiring those sources together, only to learn that one fails during a market spike or that data schemas never quite align. The result? Bots mis-fire, dashboards drift out of sync, and growth stalls while engineers chase yet another “price feed.”
That headache stops today. Token Metrics API, the same engine that powers more than 70 000 users on the Token Metrics analytics platform, is now live on RapidAPI—the largest marketplace of public APIs with more than four million developers. One search, one click, and you get an AI-grade Crypto API with institutional reliability and a 99.99 % uptime SLA.
bash
CopyEdit
curl -H "X-RapidAPI-Key: YOUR_KEY" \
-H "X-RapidAPI-Host: tokenmetrics.p.rapidapi.com" \
https://tokenmetrics.p.rapidapi.com/v2/trader-grades?symbol=BTC
The response returns Bitcoin’s live Trader Grade (0-100) and bull/bear flag. Swap BTC for any asset or explore /indices, /sentiment, and /ai-reports.
Use case
How developers apply the Token Metrics API
Automated trading bots
Rotate allocations when Trader Grade > 85 or sentiment flips bear.
Portfolio dashboards
Pull index weights, grades, and live prices in a single call for instant UI load.
Research terminals
Inject AI Reports into Notion/Airtable for analyst workflows.
No-code apps
Combine Zapier webhooks with RapidAPI to display live sentiment without code.
Early adopters report 30 % faster build times because they no longer reconcile five data feeds.
Overages start at $0.005 per call.
• RapidAPI listing: https://rapidapi.com/tm-ai/api/token-metrics
https://rapidapi.com/token-metrics-token-metrics-default/api/token-metrics-api1
• Developer docs: https://developers.tokenmetrics.com
• Support Slack: https://join.slack.com/t/tokenmetrics-devs/shared_invite/…
Spin up your key, ship your bot, and let us know what you create—top projects earn API credits and a Twitter shout-out.

The modern crypto stack is a jungle of AI agents: IDE copilots that finish code, desktop assistants that summarise white-papers, CLI tools that back-test strategies, and slide generators that turn metrics into pitch decks. Each tool speaks a different protocol, so developers juggle multiple keys and mismatched JSON every time they query a Crypto API. That fragmentation slows innovation and creates silent data drift.
To fix it, we built the Token Metrics Crypto MCP Server—a lightweight gateway that unifies every tool around a single Multi-Client Crypto API. MCP (Multi-Client Protocol) sits in front of the Token Metrics API and translates requests into one canonical schema. Paste your key once, and a growing suite of clients speaks the same crypto language:
Consistency – Claude’s grade equals Windsurf’s grade.
One-time auth – store one key; clients handle headers automatically.
Faster prototyping – build in Cursor, test in Windsurf, present in Tome without rewriting queries.
Lower cost – shared quota plus $TMAI discount across all tools.
Your LLM assistant, IDE, CLI, and slide deck now share a single, reliable crypto brain. Copy your key, point to MCP, and start building the next generation of autonomous finance.
The Crypto MCP Server follows the core Token Metrics API plans: Free, Advanced, Premium, and VIP up to 500 000 calls/month and 600 req/min. Paying or staking $TMAI applies the familiar 10 % pay-in bonus plus up to 25 % staking rebate—35 % total savings. No new SKU, no hidden fee.
The Token Metrics Crypto MCP Server turns seven scattered tools into one cohesive development environment. Your LLM assistant, IDE, CLI, and slideshow app now read from the same real-time ledger. Copy your key, point to MCP, and start building the next generation of autonomous finance.
• Github repo: https://github.com/token-metrics/mcp
👉 Ready to build? Grab your key from https://app.tokenmetrics.com/en/api
👉 Join Token Metrics API Telegram group
Step-by-step client guides at smithery.ai/server/@token-metrics/mcp or https://modelcontextprotocol.io/clients — everything you need to wire Token Metrics MCP into Open AI, Claude, Cursor, Windsurf and more.

In the fast-paced world of crypto trading, timing is everything. One small delay can mean missing out on a breakout — or getting caught in a dump. That’s why we’ve completely redesigned the Token Metrics Market Page for 2025, bringing users faster access to the most accurate crypto trading signals powered by AI, on-chain analysis, and proprietary data science models.
This isn’t just a design refresh. It’s a full rethinking of how traders interact with data — with one goal in mind: make smarter trades faster.
Crypto has matured. In 2025, the market is no longer driven by just hype or tweets. The best traders are using quantitative tools, AI signals, and real-time on-chain intelligence to stay ahead. And the Token Metrics Market Page is now built to meet that standard.
Gone are the days of switching between ten different platforms to get a complete view of a token. With the new Market Page, everything you need to make a data-backed trading decision is at your fingertips — no noise, no fluff, just high-signal information.
At the top of the redesigned Market Page, we’ve surfaced the week’s most compelling bullish and bearish crypto signals. These aren’t just based on price action — they’re curated using a powerful blend of AI, technical analysis, momentum trends, and on-chain activity.
Take Launch Coin week. It’s been topping the bullish charts due to a sharp uptick in volume and social traction — even though the price has begun to stabilize. Our platform caught the early signal, helping users ride the wave before it showed up on mainstream crypto news feeds.
Every token featured here has passed through our proprietary signal engine, which incorporates:
The result? You don’t just know what’s pumping — you know why it’s moving, and whether it’s likely to hold.
Want to isolate tokens in the DeFi space? Looking for only high-grade bullish signals on Ethereum or Solana? With new filtering options by sector, signal strength, and chain, you can zero in on the exact types of trades you're looking for — whether you're a casual trader or running a portfolio strategy.
This personalized dashboard experience brings hedge-fund-grade analytics to your fingertips, democratizing access to sophisticated data tools for retail and pro traders alike.
Every token card on the Market Page now comes with a visual snapshot showing:
No need to deep-dive into separate pages unless you want to — Token Metrics puts quick visual context right where you need it to reduce friction and increase speed.
We know many users monitor the market and execute trades from their phone. That’s why we’ve ensured the entire Market Page is fully mobile-responsive, optimized for fast swipes, taps, and decisions without losing any key insights.
With Token Metrics, your next trade idea can start while you’re commuting, grabbing coffee, or even mid-conversation at a crypto meetup.
This redesign is just one piece of the broader Token Metrics vision — making AI-driven crypto trading accessible to everyone.
If you’re serious about catching the next 10x altcoin, surviving market crashes, or just improving your signal-to-noise ratio, here’s why thousands of crypto traders choose Token Metrics:
Our users aren’t just following the market — they’re leading it.
One of our users recently shared how they caught a 47% pump on an obscure DePIN token by acting on a Buy Signal that showed up in the Market Page’s Bullish section three days before the breakout. The token had minimal social chatter at the time, but our models flagged rising volume, strong fundamentals, and a breakout formation building on the technical side.
Stories like this are becoming common. With every new feature and dataset added to Token Metrics, users are getting smarter, faster, and more confident in their crypto trades.
This is just the beginning. Coming soon to the Market Page:
We’re building the most intelligent crypto trading assistant on the web — and the new Market Page is your window into it.
In crypto, being early is everything. But with thousands of tokens and hundreds of narratives, knowing where to look can be overwhelming.
The redesigned Token Metrics Market Page removes the guesswork.
By giving you AI-powered insights, real-time signals, and actionable visualizations, it transforms your screen into a decision-making engine. Whether you’re day trading or managing a long-term altcoin portfolio, the right data — surfaced the right way — gives you the edge you need.
Visit the new Market Page today, and see why 2025’s smartest crypto traders are making Token Metrics their go-to tool for navigating this volatile, opportunity-packed market.
Ready to Trade Smarter?
Explore the new Market Page
Want the signal before the crowd?
Try Token Metrics free and get instant access to:
Because in crypto, data is the new alpha — and Token Metrics helps you unlock it.

In the fast-moving world of crypto, narratives can generate staggering returns — but they can also evaporate just as quickly. Launch Coin, one of 2025’s most talked-about tokens, is a perfect case study in how trends emerge, peak, and fade — and why having the right data matters more than ever for successful trading.
At its height, Launch Coin delivered an eye-popping 35x return, capturing the full attention of retail traders, influencers, and crypto-native venture funds alike. The premise was simple but powerful: users could launch a token simply by replying to a tweet. This radically lowered the barrier to token creation and empowered anyone with an idea to tokenize it — instantly.
But by late May, the token had corrected to 20x — still strong on paper, but signaling a definitive cooling of momentum. And with it, the social token narrative that once set Crypto Twitter on fire appears to be losing its grip. As traders reevaluate their exposure, this moment offers a broader lesson: the ability to detect the peak of a narrative is as important as catching its beginning.
Launch Coin arrived at just the right time.
The combination of virality, accessibility, and novelty made Launchcoin irresistible. Its core feature — allowing users to tokenize ideas from social media — felt like the next evolution of community-building and creator monetization.
But more than the technology, it was the narrative that did the heavy lifting. In crypto, narratives are often the fuel that turns good ideas into short-term trading frenzies. And in Launchcoin’s case, the market piled in, creating the kind of momentum rarely seen outside meme coin season.
From a pure return standpoint, Launch Coin is still a winner. But price alone doesn’t tell the full story. The sharp retrace from its peak indicates a critical shift: interest is waning, even if believers remain vocal.
This kind of transition is common in crypto. We’ve seen it before:
Launchcoin fits the same pattern. The rapid rise of token creation without friction led to a flood of low-quality projects, diluting excitement and prompting serious traders to rotate out. Today’s pullback reflects narrative fatigue — a critical turning point for traders.
Many traders chase stories. But seasoned traders look for signals — the objective indicators that show when momentum is truly shifting. Token Metrics helps you cut through the noise by surfacing:
For Launch Coin, Token Metrics flagged the beginning of signal deterioration weeks before the broader market realized. While social media was still buzzing, our models showed declining momentum, weaker volume, and slowing engagement — early warnings for savvy traders.
One of the biggest challenges in crypto trading is knowing when to rotate. Launch Coin’s decline didn’t happen in a vacuum. As capital exited social tokens, we saw attention shift toward AI tokens, DeFi lending protocols, and real-world asset platforms.
Token Metrics tracks narrative shifts in real time. On our Market Page, users can filter trending bullish signals by:
This makes it easier to identify early movers, reposition capital, and avoid getting trapped in narratives that are losing steam.
Another insight: many of the most successful long-term tokens are backed by infrastructure, not just ideas. Ethereum, Solana, Chainlink — these all power ecosystems. Launchcoin’s challenge is whether it can evolve from a fun gimmick into a lasting layer for social token infrastructure.
Token Metrics’ Investor Grade can help you evaluate this potential by analyzing:
By weighting these factors into its grade, Token Metrics helps users avoid being misled by short-term excitement and focus instead on tokens with staying power.
The Launchcoin episode highlights one truth about crypto: timing and information make the difference between profit and loss. And in an ecosystem driven by volatility, Token Metrics is designed to be your advantage.
Here’s what traders gain by using Token Metrics:
Whether you’re scalping new tokens or investing in long-term projects, Token Metrics provides the data, structure, and confidence you need to trade smarter.
As Launch Coin cools, traders are asking: what’s the next 10x narrative?
Right now, data suggests that AI agents, DeFi primitives, and multi-chain interoperability are gaining traction. On the Token Metrics platform, the top-ranking bullish signals this week include several tokens tied to machine learning infrastructure and decentralized lending vaults.
But don’t wait for a newsletter to tell you what’s trending.
Explore the Token Metrics Market Page, set your filters, track the signals, and ride the next wave before it peaks. Because in crypto, the early bird doesn’t just get the worm — it gets the alpha.
Narratives will always rise and fall. What matters is your ability to spot when a hype cycle is starting — and when it’s ending.
With Token Metrics, you get more than just indicators. You get a full platform designed to surface truth beneath the noise — helping you trade with conviction, not confusion.
The Launchcoin cycle is a reminder of how fast crypto moves — and how important it is to trade with insight, speed, and structure.
Explore the platform today at tokenmetrics.com, and don’t just follow the narrative — trade it.

Every crypto investor dreams of discovering that one hidden gem — the token that goes from unknown to unstoppable, delivering 10x or even 50x returns. But with over 25,000 cryptocurrencies on the market in 2025, the big question remains: how do you actually find the one that will moon before the crowd catches on?
That’s where Token Metrics steps in.
By combining AI-powered crypto signals, narrative filters, advanced grading systems, and deep-dive analytics, Token Metrics makes it easier than ever to identify high-potential projects early — and trade them with confidence.
Whether you’re a retail trader looking for your first big win, or a seasoned investor building a crypto portfolio, Token Metrics gives you the tools to make smarter, faster, and more profitable decisions.
Not every token is destined for greatness. But nearly every 10x token follows a pattern before it takes off. At Token Metrics, we’ve studied thousands of chart patterns, price trends, and fundamental indicators to isolate the key ingredients most 10x tokens share before they explode:
These are early-stage AI signals generated when a token begins to show strong upside potential. Token Metrics’ AI tracks market data, price momentum, sentiment, and technical indicators to identify early breakout signals.
When both grades are high — especially above 80 or 90 — it’s often a green light.
Every bull run has its dominant themes: DeFi in 2020, NFTs in 2021, AI and Modular Chains in 2025. A token aligned with a current hot narrative is more likely to gain attention and capital inflow.
Real traction shows up through social media engagement, Discord activity, Telegram volume, GitHub commits, and on-chain user growth. Token Metrics integrates this into its AI analysis to measure rising network effect.
To see this in action, let’s look at Launchcoin, one of the most explosive tokens of early 2025. Launchcoin allowed anyone to tokenize ideas through social media replies — making it the centerpiece of the creator token narrative.
It went from stealth mode to stardom in days, ultimately delivering a 35x return for users who caught it early. How?
Users who followed the early bold signal and confirmed it with high grades had the data needed to act decisively — and ride the wave before it crested.
Token Metrics isn’t just a signal service — it’s a full-suite crypto analytics platform designed to help traders and investors discover, analyze, and act on opportunities before the crowd.
Here are the core tools that help you catch winners early:
View a curated dashboard of the latest AI-generated bold signals, updated in real time. Filter by:
This is your front-line tool for finding high-upside tokens before they trend on social media or exchanges.
Dig deeper into any token with complete analysis, including:
These pages help you validate and compare tokens before jumping in.
Narratives drive attention and capital in crypto. Use AI-driven filters to discover tokens within hot themes like:
Narrative filtering helps you spot which sectors are heating up and which tokens are leading the charge.
Get a real-time feed of tokens that are climbing the ranks fastest based on signal performance, volume, and momentum. Great for catching short-term breakouts.
Set custom alerts for:
This ensures you never miss a move — even if you’re not logged in 24/7.
Using Token Metrics gives you an edge, but timing and execution still matter. Here are key strategies:
Early bold signals are where most 10x gains start. Check the Market Page daily and move quickly when grades align.
Don’t just chase price action. Look for both Trader and Investor Grades above 80 — ideally above 90 for the biggest potential moves.
Tokens in trending narratives often rise faster. Track narrative heatmaps on Token Metrics to stay aligned with the market zeitgeist.
Momentum can shift fast. A token might go from a bold signal to a breakout in 24–48 hours. Stay on top of daily updates.
Don’t go all-in on one theme. Spread bets across AI, DeFi, Memes, and Infrastructure to capture multiple emerging waves.
The crypto markets can be overwhelming — with noise, scams, and hype around every corner. Token Metrics simplifies the process by turning complex data into actionable insights.
Whether you're looking to catch your first 10x, avoid false pumps, or build a smart long-term crypto portfolio, Token Metrics gives you:
With tools designed for traders, investors, and builders alike, Token Metrics turns analytics into alpha.
The next 10x token is already out there. It might be trading under the radar today, quietly showing early signs — a bold signal, strong grade, growing community.
Token Metrics is your map.
You don’t need to follow the crowd. With the right tools and discipline, you can trade ahead of the market, find the next Launchcoin, and position yourself for outsized gains.

The crypto market has been a rollercoaster lately.
Bitcoin is dipping. Altcoins are bleeding. Sentiment across the board is skittish. Fear is gripping retail traders — and in times like these, many are unsure where to turn, what to buy, or when to hold back.
But not everyone’s losing.
Some traders are still finding wins. One example? Hyperliquid (HYPE) — a standout performer in April 2025. And here’s the kicker: Token Metrics called the move before it happened.
While most traders were distracted by meme coins or frozen in fear, Token Metrics users were riding a +51.8% breakout, armed with AI-driven insights and data-backed confidence. This blog breaks down what happened, how Token Metrics spotted the trade before the crowd, and what tools you can use today to find the next HYPE-level breakout before it happens.
On April 14, while much of Crypto Twitter was silent on HYPE, Token Metrics issued a bullish signal on the token. The platform’s AI-powered Trader Grade identified a strong setup forming — based on technical indicators, rising volume, and early momentum shifts.
That signal marked the beginning of a +51.8% price surge, which saw HYPE peak at $38.50 before a broad market correction pulled it back to ~$32.40.
Even with the correction, traders who acted on the early signal locked in solid profits, exited smart, or are now watching for the next move with eyes wide open — guided by grades, not guesswork.
While most platforms react to price action after it happens, Token Metrics is built to anticipate movement before it’s obvious. Here’s how:
The Trader Grade analyzes short-term price action, RSI trends, MACD crossovers, breakout patterns, and dozens of other technical indicators. HYPE’s chart showed tightening consolidation and rising buy volume — and TM’s systems flagged it in real time.
One of the earliest clues in any breakout is an uptick in volume. Token Metrics identifies surging liquidity that precedes breakouts — something that traditional screeners miss or catch late.
Hyperliquid was part of a subtle but growing "on-chain perpetuals" narrative — a theme most traders weren’t tracking yet. TM’s AI-powered narrative filters helped surface HYPE as an early player in a trending category.
Token Metrics doesn’t just throw out signals randomly. The platform assigns confidence scores based on data quality, historical performance, and AI pattern recognition. HYPE didn’t just look good — it looked statistically strong.
After topping at $38.50, HYPE retraced — now sitting about 15.8% below its high. Some might see weakness. But Token Metrics helps traders read beyond the price:
This context is what makes Token Metrics invaluable. While the crowd panics, TM users stay informed, balanced, and ready.
Let’s zoom out. Why does this matter for your trading journey?
Most traders operate on emotion, social media chatter, or FOMO. Token Metrics flips that model on its head — giving you a complete data-driven crypto trading toolkit:
These grades score tokens on a 0–100 scale based on short-term technical momentum. A Trader Grade above 80 often precedes a strong move — as seen with HYPE.
Built from 80+ on-chain and off-chain data points — including liquidity, tokenomics, VC backers, exchange listings, community engagement, and developer activity.
Get alerted when a new bullish or bearish signal is triggered. These alerts are based on pattern recognition, performance history, and current price action.
Narratives drive price — from DeFi Summer to AI Agent tokens. TM helps you stay on top of evolving themes and find the tokens leading those trends early.
Set custom alerts for grade movements, bold signals, or top gainer movements — so you never miss a trade even when you’re not glued to the screen.
Let’s break it down: Why use Token Metrics instead of trading blindly?
Tools like the Market Page and Top Gainers tab help you spot tokens heating up — before they explode. You won’t be the one buying at the top anymore.
TM’s objective grades help filter out low-quality tokens. You can avoid chasing scams or hype-based pumps with no foundation.
Instead of spending hours flipping through charts and Twitter threads, Token Metrics gives you instant, high-signal data — all in one place.
Whether you’re swing trading or building a long-term bag, the Trader and Investor Grades help validate (or invalidate) your bias.
The crypto market rotates fast. Token Metrics surfaces where capital is flowing — and which narratives are gaining strength — so you can rotate with it.
Looking ahead, HYPE’s next move depends on what happens at the $32 support zone:
Either way, Token Metrics users won’t be guessing. They’ll wait for the next signal — bullish or bearish — and make calculated moves based on real data.
This is the difference between reactive trading and strategic trading.
The HYPE breakout wasn’t luck. It was the result of acting on strong, data-backed signals before the crowd caught on.
If you’re tired of chasing pumps, panicking in drawdowns, or wondering why others always seem to find winners early, then it's time to level up.
With Token Metrics, you can:
Join thousands of traders using Token Metrics to find breakout tokens before they pump.
👉 Explore the platform now at tokenmetrics.com
👉 Get real-time signals, bold alerts, and daily data updates
👉 Trade with structure — not speculation
Because in crypto, the edge goes to the trader with information, not emotion.

Solana has been one of the most closely watched altcoins in the 2025 crypto cycle. With its blazing speed, developer activity, and expanding DePIN ecosystem, Solana has remained on every smart investor’s radar. But with the broader market pulling back sharply — and Bitcoin dipping below $105K — traders are asking: Is Solana still a buy?
Token Metrics' AI-powered tools offer critical insights into this volatile moment.
April's Bullish Signal Paid Off
Token Metrics’ proprietary indicator turned bullish on Solana on April 19, when the price was just $138.18. That signal wasn’t just noise. Within a month, Solana surged by 33.1%, reaching $184 by May 23.
This kind of real-time, data-driven signal is exactly why traders are turning to Token Metrics. Rather than guessing or chasing hype, our platform delivers objective, AI-backed alerts that help traders enter early and exit intelligently.
The Pullback: Market-Wide, Not Solana-Specific
Fast forward to today, and the story has changed. Solana is undergoing a major pullback, largely driven by the overall market correction. Bitcoin’s slide below $105K has dragged most altcoins down, Solana included.
However, Token Metrics' Trader Grade for Solana is now 'Neutral' — not bearish. That’s a crucial distinction. While momentum has cooled, our system is not yet signaling a full reversal. That means there’s still room for recovery.
Technical Outlook: The $160 Level is Critical
Technical analysis highlights a key battleground at $160. If bulls can reclaim this level in the near term, the uptrend could resume. Failure to hold above it, however, could open the door for deeper losses.
Token Metrics users can monitor these levels in real-time with our dynamic charts, trend indicators, and updated market signals.
What Traders Should Watch Next
Conclusion
Solana remains a high-potential asset — but trading it without real-time analytics in this environment is risky. Token Metrics doesn’t just tell you what’s happening; it shows why it’s happening and what to do next.
Join Token Metrics today to access AI-powered trading signals, risk analysis, and the tools to trade crypto like a pro — even in uncertain markets.

In crypto, everything can change overnight. One minute the market’s bullish — the next, it’s bleeding red. That’s why the ability to spot bearish signals early is crucial for protecting capital and maximizing long-term gains. Token Metrics gives traders an edge with AI-driven alerts that help you act before the crash hits.
Why Most Traders Miss the Top
Retail traders often get caught in the hype. By the time “everyone” is talking about a token, it’s usually too late. The smartest investors are watching subtle changes in data: volume drops, negative sentiment, weakening momentum.
Token Metrics makes those patterns visible before price crashes.
What Is a Bearish Signal on Token Metrics?
A bearish signal is a warning based on:
These signals are automatically triggered and displayed on the Market Page.
How to Identify Bearish Tokens Early
Behavioral Clues You Shouldn’t Ignore
Real Example: Avoiding Losses with Signal Data
Ian Balina mentioned how users avoided major losses by exiting weak tokens early thanks to falling grades and bearish signals. Instead of hoping, they acted — preserving capital and rotating into stronger plays like Launch Coin or AI tokens.
What to Do When You See Bearish Signs
Combining Risk Management with Signals
Token Metrics isn’t just about finding moonshots. It’s also about knowing when not to buy or when to exit early. By using bearish signals, you protect yourself from downside while staying positioned for the next big opportunity.
Conclusion
The best crypto traders aren’t just profit-hunters — they’re risk managers. Bearish signals from Token Metrics help you anticipate weakness, reduce losses, and trade with clarity. In a volatile market, that edge can make all the difference.


 Create Your Free Account
9450 SW Gemini Dr
PMB 59348
Beaverton, Oregon 97008-7105 US
.svg)


.png)
Token Metrics Media LLC is a regular publication of information, analysis, and commentary focused especially on blockchain technology and business, cryptocurrency, blockchain-based tokens, market trends, and trading strategies.
Token Metrics Media LLC does not provide individually tailored investment advice and does not take a subscriber’s or anyone’s personal circumstances into consideration when discussing investments; nor is Token Metrics Advisers LLC registered as an investment adviser or broker-dealer in any jurisdiction.
Information contained herein is not an offer or solicitation to buy, hold, or sell any security. The Token Metrics team has advised and invested in many blockchain companies. A complete list of their advisory roles and current holdings can be viewed here: https://tokenmetrics.com/disclosures.html/
Token Metrics Media LLC relies on information from various sources believed to be reliable, including clients and third parties, but cannot guarantee the accuracy and completeness of that information. Additionally, Token Metrics Media LLC does not provide tax advice, and investors are encouraged to consult with their personal tax advisors.
All investing involves risk, including the possible loss of money you invest, and past performance does not guarantee future performance. Ratings and price predictions are provided for informational and illustrative purposes, and may not reflect actual future performance.


%20Price%20Prediction%20.webp)


%20Price%20Prediction.webp)


